Trust indicators and explainable AI: A study on user perceptions - Idiap Publications
←
→
Page content transcription
If your browser does not render page correctly, please read the page content below
Trust indicators and explainable AI: A study on user
                        perceptions

 Delphine Ribes Lemay1, Nicolas Henchoz1, Hélène Portier1, Lara Defayes1, Thanh-
          Trung Phan4,5, Daniel Gatica-Perez4,5 and Andreas Sondereger2,3
        1   EPFL+ECAL Lab, Ecole Polytechnique fédérale de Lausanne, Switzerland
                               delphine.ribes@epfl.ch
                            2 Bern University of Applied Sciences
                            3
                              Université de Fribourg, Switzerland
                      4 Idiap Research Institute, Martigny, Switzerland
             5LIDIAP-STI, Ecole Polytechnique fédérale de Lausanne, Switzerland

       Abstract. Nowadays, search engines, social media or news aggregators are the
       preferred services for news access. Aggregation is mostly based on artificial
       intelligence technologies raising a new challenge: Trust has been ranked as the
       most important factor for media business. This paper reports findings of a study
       evaluating the influence of manipulations of interface design and information
       provided in the context of eXplainable Artificial Intelligence (XAI) on user
       perception and in the context of news content aggregators. In an experimental
       online study, various layouts and scenarios have been developed, implemented
       and tested with 266 participants. Measures of trust, understanding and preference
       were recorded. Results showed no influence of the factors on trust. However, data
       indicates that the influence of the layout, for example implicit integration of
       media source through layout structuration has a significant effect on perceived
       importance to cite the source of a media. Moreover, the amount of information
       presented to explain the AI showed a negative influence on user understanding.
       This highlights the importance and difficulty of making XAI understandable for
       its users.

       Keywords: Trust indicators, Fake news, Transparency, Design, Explainable AI,
       XAI, Understandable AI.

1      Introduction

News aggregators are considered as one of the most phenomenal changes in the media
industry over the last decade [1], leading to disruption of the content supply chain and
therefore of the business models in the media industry. They can be considered as a
curation of news from various media organisations [2]. This curation can be performed
by machine based algorithms, human judgement or a mix of both. However, due to the
volume of content processed, automation has gained in importance in recent years. In
2009, for instance, Google was already curating over 25’000 media sources around the
world without human assistance. The phenomenon continues to increase: according to
the 2019 Reuters report [3], across all countries, search engines, social media or news
aggregators are the preferred services for news access. However, previous research [4],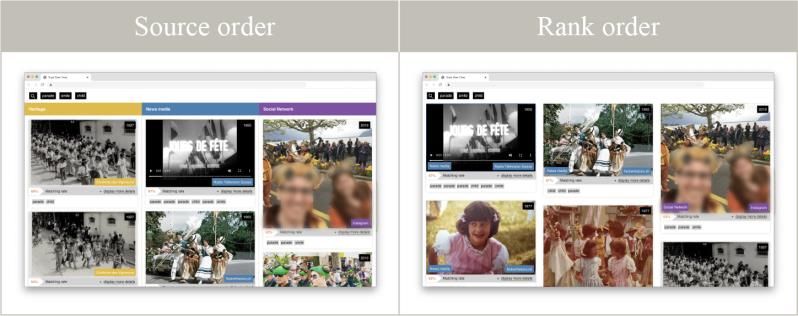
2

[5] has indicated the importance of trust for the acceptance and perceived usefulness of
such tools. But the rise of automated aggregation generates new trust issues. First, the
multiplication of sources and the ease of creating and sharing content has spawned the
massive distribution of fake news [6]. Additionally, users may get confused by the
variety of news sources [7]. Finally, coming along with the increasing complexity and
opacity of aggregating algorithms, users may not understand how algorithms make
decisions, resulting in a loss of confidence in the aggregation [8]. In this regard, the
question arises as how trust and confidence can be influenced when designing
interfaces.
  The work presented in this paper aims at evaluating the influence of design measures
in the particular context of news content aggregators and specifically the effect of layout
design and algorithm transparency on user trust.

2      Background and Related work
2.1    Trust indicators
To address trust issues, various projects have been initiated. For example, following the
US 2016 election, “The Trust Project” [9] was launched, putting forward a set of eight
trust indicators with the objective to provide information on the news article (e.g. the
source, the publication date, the funding). Similarly, other sets of indicators have been
proposed [10]. Such indicators are used, for example, for the “Facebook context
button”. From the proposed list of indicators, the source appears to be essential to assess
the reliability of the content [11]–[14] and evidence from literature [15] suggests that
source visibility should be designed to favor visibility. In a more intrusive way, some
social networks have launched warning labels such as the “Facebook disrupted label”
or “warnings on misleading Tweets label”. Their purpose is to inform readers about the
veracity or the trustworthiness of the information. Whether produced manually by
external and independent fact checking organisations or in a more automatic way based
on mathematical models [16], they may be harmful if misused or used inadequately
[17], [18].

2.2    Aggregation algorithm transparency
Transparent AI or eXplainable Artificial intelligence (XAI) systems provide
understandable justifications for algorithm outputs [19]. XAI is considered critical for
building trust with AI [20]. To successfully implement a XAI system, it is important to
determine the XAI system goals, the information to be explained and the way it is
explained [21]. In the particular context of news content aggregators, the goal for the
XAI system is to make the user understand why a content has been aggregated and how
well the content matches the user search criteria. In this regard it has been suggested
that information should be explained and represented in a simplified way in case that
users are AI-novices [22]. In addition, it should be designed in an engaging way [23]
and encourage users to interact with and further inspect the result [24]. In addition,
previous research on automation has shown that the accuracy of the automated system
(also referred to as automation reliability) considerably influences trust and usage
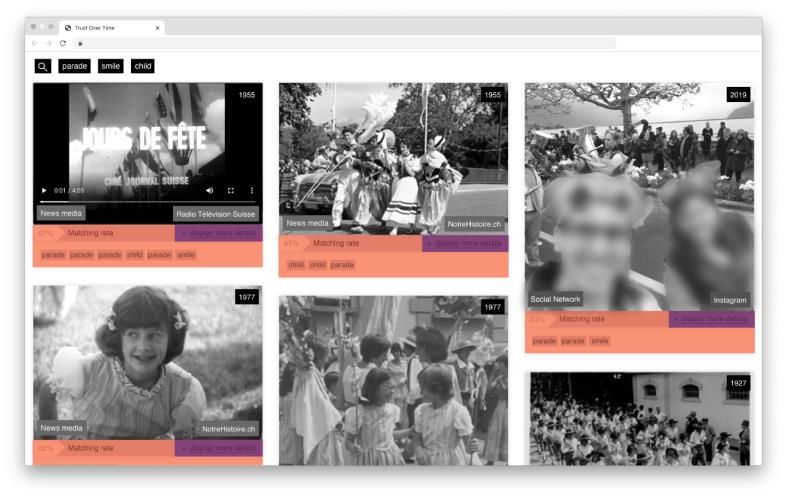
3

behaviour [25]. Furthermore, research on technology acceptance has shown the
important role of system usefulness and ease of use [26].

2.3    The present study
In order to address the above-mentioned research question, different versions of an AI-
based news content aggregator prototype for an important national event (i.e.
winegrowers' festival) were developed. The versions differed with regard to detail of
explanation of the AI (level of XAI) and the visual representation of the results (design
manipulation). With regard to the design manipulation, it was expected that the visual
organisation of the content based on its source (i.e. curated heritage archives, news
media archives, or social media) would lead to an increase in trust in the result of the
content aggregator compared to an unstructured presentation. In a similar vein it was
hypothesized that increasing detail of explanation of the AI would lead to a better
understanding and hence to higher trust ratings.

3      Method

3.1    Participants
A total number of 226 participants (mean age of 32.38, SD = 13.74, ranging from 18 to
80 yrs., 128 women, 94 men and 4 identifying themselves differently) were recruited
for this study. About half of participants (N = 108) were students while the other half
consisted of employees working in various domains.

3.2    Experimental design
We conducted an online experiment following a 2 x 3 between-subjects design, with
the factors ‘XAI’ (detailed explanation vs. short explanation vs. no explanation) and
design (source order vs. rank order). Figure 1 shows the different experimental
manipulations. In a second stage of the study, one variable (Perceived relevance of the
interface design) was recorded and analysed as repeated measures variable.
  For the manipulation of the level of XAI in the short explanation condition, a color-
coded matching rate number (CCMRN) in percentage was presented for each search
result, together with the relevant keywords next to the aggregated content. This
information helps understanding the prioritisation of the content and the accuracy with
which the content matches the user search. In the detailed explanation condition, the
same information as in the short explanation condition was presented. Furthermore,
users could obtain additional information on content features, keywords extracted from
indexation as well as success rate in percentage regarding the AI indexation by clicking
on a button labeled “+ display more details”. In the no explanation condition, no
information regarding matching rate and search performance was presented.
  In the source order condition of the design manipulation, search results were
organized with regard to the source they were extracted from. The different sources of
content were: ''heritage'' for content originating from curated cultural heritage archives
such as museums, ''news media'' for content being produced by national and regional
news and television companies, and ''social network'' for content being generated by
4

users on platforms such as Instagram and Facebook. This version of the news
aggregator interface was designed to clearly indicate the source of the presented
content. Therefore, results were sorted into labeled and color-coded columns, each
column representing a media type. The search results within each column were
organized with regard to their matching rate with the search keywords, with high-
matching content being placed on top of the column. Each column could be scrolled
individually while the title always stayed visible. In the rank order condition, search
results were ordered with regard to matching with the search keywords, without being
organized by source. However, the source of the content was indicated by a color code
in the description.

Fig. 1. Representation of the different interfaces as a function of XAI (detailed
explanation vs. short explanation (without the purple) vs. no explanation (without the
purple and salmon - top image) and design (source order vs. rank order - bottom image)
and .

3.3    Measures
Trust in the search results was assessed with the items ‘Do you trust the results obtained
by this search engine?’, ‘Did you find the results obtained by this search engine
5

relevant?’, ‘Did you find that the images that came up in the search matched the
keywords?’ with a scale ranging from 1 ‘not at all’ to 7 ‘absolutely’.
Perceived adequacy of the sorting order was assessed with the item ‘Would you have
liked to change the order in which the images appeared?’ using a Likert scale ranging
from 1 ‘not at all’ to 7 ‘absolutely’.
Perceived usefulness of citing the source was assessed with the item ‘Do you find it
useful to have the source of the content cited?’ on a scale ranging from 1 ‘not at all’ to
7 ‘absolutely’.
Subjective understanding of the CCMRN was assessed with the item ‘Did you
understand what the matching rate number represents?’ on a scale ranging from 1 ‘not
at all’ to 7 ‘absolutely’. Two screenshots displaying two different CCMRN (one with a
low value and one with a high value) with their associated content were shown above
the item.
Objective understanding of the CCMRN was assessed with the item ‘Try to explain, as
simply as possible, how this matching rate number is calculated’. Participants' answers
were coded into three categories, 1: not understood, 2: moderately understood, 3:
understood.
Perceived usefulness, trustworthiness and interest in the CCMRN was assessed with
the items ‘Do you find the matching rate number to be a useful indicator?’, ‘Do you
trust this indicator?’ and ‘Would you like to have an indicator like this when doing
online search?’ on a scale ranging from 1 ‘not at all’ to 7 ‘absolutely’.
Perceived accuracy of the CCMRN was assessed with the item ‘Do you find that the
percentages shown match the similarity between the search keywords and the found
content?’ on a scale ranging from 1 ‘not at all’ to 7 ‘absolutely’.
Perceived usefulness, trustworthiness and interest in the detailed explanation available
was assessed with the items ‘Does this information help you to understand how the
matching rate number is calculated?’, ‘Would you like to have access to this kind of
information the next time you do an online search?’, ‘Do you trust this information’ on
a scale ranging from 1 ‘not at all’ to 7 ‘absolutely’. A screenshot displaying the content
together with its associated CCMRN and its associated details was displayed above the
item.
As a repeated measures variable, Perceived relevance of the interface design was
assessed by asking the participants ‘Do you find it relevant to sort the results according
to the interface below? on a scale ranging from 1 ‘not at all’ to 7 ‘absolutely’. The
question was asked twice. First, a screenshot of the source order interface was displayed
and then, a screenshot of the rank order interface was displayed.
Additional variables such as perceived usefulness, relevance and accuracy of human
indexation versus AI indexation were recorded but are not explicitly reported in this
publication and will be part of a future publication.

3.4    Procedure
Participants recruited via institutional mailing lists and social media were equally
distributed over the six experimental conditions. They answered an online
questionnaire before and after seeing one of the online versions of the interface. They
were asked to use a desktop computer or a laptop to complete this online-study. The
search query feature was removed in order to control for results quality (i.e. all
6

participants obtain the same search result interface for a maximal experimental control).
Before launching the user interface, a text was displayed explaining the context of the
search and indicating the keywords used in the search, which were ‘parade’, ‘smile’,
and ‘child’). The time to complete the survey was about 30 minutes.

3.5    Statistical Analysis
Data was analysed with two-factorial ANOVAs with post-hoc analyses using Sidak
corrections. Data regarding the perceived relevance of the interface design was
analysed with a three-factorial mixed ANOVA with the two questions regarding the
relevance of the design versions (source order vs. rank order) as repeated measures
variables. The link between two measures was calculated using the Pearson correlation.

4      Results
Trust in the search results. Participants in the source order condition tended to trust the
results more (M = 4.91, SE = 0.12) than participants in rank order condition (M = 4.69,
SE = 0.12) but the difference is not significant, F(1, 220) = 1.70, p = .19, η2 = .01.
Interestingly, no significant differences regarding participants’ trust in search results
were found for the XAI manipulation (F < 1), and also the interaction of the two factors
did not reach significance level (F < 1). Since no interaction effect reached significance
level for all the dependent variables, they are not reported for the following dependent
variables.
Perceived adequacy. Participants in the source order condition were significantly less
inclined to change the order in which the search results were presented (M = 3.59, SE
= .18) than those in the rank order condition (M = 4.20, SE = .18), F(1, 220) = 5.53, p
= .02, η2 = .03. No significant difference was found for the XAI manipulation F(2, 220)
= 1.45, p = .23, η2 < .01.
Perceived relevance of the interface design. The repeated measures comparison of the
two design versions (source order vs. rank order) indicated significantly higher ratings
for the source order (M = 5.28, SE = .10) compared to the rank order (M = 3.74, SE =
.12), F(1, 220) = 113.41, p < .001, η2 = .34. Both between-factors did not influence this
measure, Fdesign < 1; FXAI(2, 220) = 1.52, p = .22, η2 = .014.
Perceived usefulness of citing the source. Participants in source order condition (S-)
found it significantly more useful (M = 6.58, SE = .10) to have the source cited than
participants in the rank order condition (M = .30, SE =.10), F(1, 220) = 3.94, p = .048,
η2 = .02). No significant differences were found for the XAI manipulations (F
7

2.58, SE = .08) did not reach significance level. There is a positive relationship between
subjective and objective understanding of the CCMRN, r = .27, p < .001 indicating that
participants who subjectively think they understood the CCMRN were better able to
explain it.
Usefulness, trustworthiness and interest in the CCMRN. No significant differences
were found for the design manipulations F(1, 220) = 1.2, p = .26, η2 = .006 nor for the
XAI manipulations F(2, 220) = 2.2, p = .11, η2 = .02.
Perceived accuracy of the CCMRN. No significant differences were found for the
design manipulations (F < 1) nor for the XAI manipulations (F < 1).
Perceived helpfulness, trustworthiness and interest in the detailed explanation. No
significant differences were found for the design manipulations F (1, 220) = 1.2, p =
.26, η2 = .006 nor for the XAI manipulations F (2, 220) = 2.2, p = .11, η2 = .02.

       Discussion and conclusion
This study addressed the effect of design manipulations and XAI on user trust and
understanding. Surprisingly, results indicate that user trust is not influenced by the
proposed design manipulations. We believe there are several reasons for this. The first
one may be the content used. The winegrowers' festival is a popular event whose media
content may not be prone to fake news, whatever the source. Therefore, the
implemented design manipulations might have shown little influence on trust. To
pursue efforts in understanding the influence of interface design on user trust, it might
be important to conduct additional research with the suggested design manipulations
on different content more connotated to include fake news (e.g. political, ecological or
economical information). The second explanation for the unexpected outcomes may be
due, as discussed in [15], to the similitude in the presentation of the content for both
design conditions, resulting in a comparable effect on trustworthiness of the design
manipulations. We manipulated the design of results sorting, either by source or by
ranking order but the presentation format of the content remained identical for both
conditions (i.e. position of the image or video within the content, size of the content,
size of the elements surrounding the content), leading to a similar effect on user trust.
Finally, the lack of effect on user trust might be due to the visibility of the sources in
both conditions. Since the source appears to be essential to assess the reliability of the
content [11]–[14], the effect on trust remains the same as long as the source is clearly
highlighted.
  While the proposed manipulations of XAI and design did not influence trust ratings,
they did show an effect on subjective and objective understanding of the CCMRN. For
participants in the detailed explanation condition, a discrepancy was observed between
their subjective and objective understanding of the CCMRN: in the detailed explanation
condition, participants performed worse in explaining the CCMRN. Nevertheless, they
rated their subjective understanding similarly when compared to the other two XAI
conditions. This indicates that providing an additional amount of information does not
automatically lead to a better understanding of the AI system. Similar findings were
presented in previous research where it was shown that XAI systems must be designed
in a tailored way as otherwise this too much information can erode trust [25]. We
observed however that the understanding of the CCMRN is not converted at this point
8
into an effect on trust. This could be due to the fact that participants found it difficult
to imagine the meaning of a percentage score. It would therefore be interesting to test
the effect using only the red-orange-green colour code, the highlighted keywords, or a
sentence as proposed in [25], [27], [28]. We believe that the effect on comprehension
would be comparable, but users would be more inclined to use it. Surprisingly, we
found that participants in the source order condition rated their subjective
understanding of the CCMRN higher compared to participants in the rank order
condition, but their objective understanding was similar. In the source order condition,
results are sorted into categories and displayed as columns which can be scrolled
individually. On the contrary, in the rank order condition, results are scrolled all
together. The clear organisation in three separate columns might facilitate the reading
and comprehension of the relevant information, which helped participants to focus on
the meaning of the presented information.
Interestingly, the design manipulations showed effects on specific user perceptions.
Participants in the source order condition found it more important to present
information about the source in addition to the content compared to participants in the
rank order condition. This corroborates results found in previous research [15]
indicating the importance of clearly indicating the source of aggregated content in order
to favor its visibility. However, as the results of this study indicate, the way the source
is highlighted is also an important factor to influence people's perception of its
importance. Moreover, results indicated that participants in this study preferred the
source order layout. As for the subjective and objective understanding of the CCMRN,
the proposed source order layout made the content easier to read, which might have
influenced their preference ratings.
Limitations of this study are that results are based on data of a popular event
dataset in Switzerland and hence need to be interpreted within this cultural context.
Moreover, results are based on self-report data, which must be taken into account when
interpreting the results [29].
To conclude, the presented study established a connection between layout design and
user understanding. More specifically, we related the sorting of news into column
categories to the importance of citing the source. This knowledge is useful in the fight
against misinformation when designing news content aggregators. The results of this
study also demonstrated a link between the amount of information provided to explain
AI and the understanding of the AI, indicating that more information does not forcefully
lead to a better understanding. In this regard, the real challenge for the future
development of XAI environments might not be to make the system explainable but to
make it understandable for the person that is supposed to use and trust it.
This project has received funding from the Initiative for Media Innovation based at
Media Center, EPFL, Lausanne, Switzerland.9
References
[1] A. M. Lee and H. I. Chyi, “The Rise of Online News Aggregators:
Consumption and Competition,” Int. J. Media Manag., vol. 17, no. 1, pp. 3–24,
Jan. 2015, doi: 10.1080/14241277.2014.997383.
[2] K. Isbell, “The Rise of the News Aggregator: Legal Implications and Best
Practices,” SSRN Electron. J., Jan. 2012, doi: 10.2139/ssrn.1670339.
[3] N. Newman, “Reuters Institute Digital News Report 2019,” p. 156, 2019.
[4] O. Oechslein, M. Haim, A. Graefe, T. Hess, H.-B. Brosius, and A. Koslow,
“The Digitization of News Aggregation: Experimental Evidence on Intention to
Use and Willingness to Pay for Personalized News Aggregators,” in 2015 48th
Hawaii International Conference on System Sciences, HI, USA, Jan. 2015, pp.
4181–4190. doi: 10.1109/HICSS.2015.501.
[5] “Innovation in News Media World Report 2018,” WAN-IFRA. https://wan-
ifra.org/insight/innovation-in-news-media-world-report-2018/ (accessed Apr.
16, 2021).
[6] V. L. Rubin, Y. Chen, and N. K. Conroy, “Deception detection for news: Three
types of fakes,” Proc. Assoc. Inf. Sci. Technol., vol. 52, no. 1, pp. 1–4, 2015,
doi: https://doi.org/10.1002/pra2.2015.145052010083.
[7] “Reuters Institute Digital News Report 2017,” p. 136, 2017.
[8] European Commission, “Final report of the High Level Expert Group on Fake
News and Online Disinformation,” Shaping Europe’s digital future - European
Commission, Mar. 12, 2018. https://ec.europa.eu/digital-single-
market/en/news/final-report-high-level-expert-group-fake-news-and-online-
disinformation (accessed Dec. 14, 2020).
[9] “The Trust Project Homepage, https://thetrustproject.org/.”
[10] A. X. Zhang et al., “A Structured Response to Misinformation: Defining and
Annotating Credibility Indicators in News Articles,” p. 10, 2019, doi:
10.1145/3184558.3188731.
[11] S. Kiousis, “Public Trust or Mistrust? Perceptions of Media Credibility in the
Information Age,” Mass Commun. Soc., vol. 4, no. 4, pp. 381–403, Nov. 2001,
doi: 10.1207/S15327825MCS0404_4.
[12] C. I. Hovland and W. Weiss, “The Influence of Source Credibility on
Communication Effectiveness*,” Public Opin. Q., vol. 15, no. 4, pp. 635–650,
Jan. 1951, doi: 10.1086/266350.
[13] T. ACUNA, “The digital transformation of news media and the rise of
disinformation and fake news,” EU Science Hub - European Commission, Apr.
25, 2018. https://ec.europa.eu/jrc/en/publication/eur-scientific-and-technical-
research-reports/digital-transformation-news-media-and-rise-disinformation-
and-fake-news (accessed Dec. 14, 2020).
[14] C. Pornpitakpan, “The Persuasiveness of Source Credibility: A Critical Review
of Five Decades’ Evidence,” J. Appl. Soc. Psychol., vol. 34, no. 2, pp. 243–281,
2004, doi: 10.1111/j.1559-1816.2004.tb02547.x.
[15] A. Kim and A. R. Dennis, “Says Who?: How News Presentation Format
Influences Perceived Believability and the Engagement Level of Social Media
Users,” in 51st, Hawaii, 2018, vol. 43 Issue 3, pp. 1025–1039.
[16] X. Zhou and R. Zafarani, “Fake News: A Survey of Research, Detection10
Methods, and Opportunities,” 1, 2018. [Online]. Available:
http://www.journalism.org/2017/09/07/news-use-across-social-media-
platforms-2017/
[17] G. Pennycook and D. G. Rand, “The Implied Truth Effect: Attaching Warnings
to a Subset of Fake News Stories Increases Perceived Accuracy of Stories
Without Warnings,” Ssrn, 2017, doi: 10.2139/ssrn.3035384.
[18] K. Clayton et al., “Real Solutions for Fake News? Measuring the Effectiveness
of General Warnings and Fact-Check Tags in Reducing Belief in False Stories
on Social Media,” Polit. Behav., 2019, doi: 10.1007/s11109-019-09533-0.
[19] D. Gunning, “Explainable Artificial Intelligence (XAI),” Mach. Learn., p. 18.
[20] D. Shin, “The effects of explainability and causability on perception, trust, and
acceptance: Implications for explainable AI,” Int. J. Hum.-Comput. Stud., vol.
146, p. 102551, Feb. 2021, doi: 10.1016/j.ijhcs.2020.102551.
[21] S. Mohseni, N. Zarei, and E. D. Ragan, “A Multidisciplinary Survey and
Framework for Design and Evaluation of Explainable AI Systems,”
ArXiv181111839 Cs, Aug. 2020, Accessed: Apr. 08, 2021. [Online]. Available:
http://arxiv.org/abs/1811.11839
[22] I. Lage et al., “Human Evaluation of Models Built for Interpretability,” Proc.
AAAI Conf. Hum. Comput. Crowdsourcing, vol. 7, no. 1, Art. no. 1, Oct. 2019.
[23] B. M. Muir, “Trust between humans and machines, and the design of decision
aids,” Int. J. Man-Mach. Stud., vol. 27, no. 5, pp. 527–539, Nov. 1987, doi:
10.1016/S0020-7373(87)80013-5.
[24] T. Kulesza et al., “Explanatory Debugging: Supporting End-User Debugging of
Machine-Learned Programs,” in 2010 IEEE Symposium on Visual Languages
and Human-Centric Computing, Sep. 2010, pp. 41–48. doi:
10.1109/VLHCC.2010.15.
[25] R. F. Kizilcec, “How much information? Effects of transparency on trust in an
algorithmic interface,” Conf. Hum. Factors Comput. Syst. - Proc., pp. 2390–
2395, 2016, doi: 10.1145/2858036.2858402.
[26] V. Venkatesh and H. Bala, “Technology Acceptance Model 3 and a Research
Agenda on Interventions,” Decis. Sci., vol. 39, no. 2, pp. 273–315, 2008, doi:
10.1111/j.1540-5915.2008.00192.x.
[27] M. Eslami et al., “‘I always assumed that I wasn’t really that close to [her]’:
Reasoning about Invisible Algorithms in News Feeds,” in Proceedings of the
33rd Annual ACM Conference on Human Factors in Computing Systems, New
York, NY, USA, Apr. 2015, pp. 153–162. doi: 10.1145/2702123.2702556.
[28] W. Wang and I. Benbasat, “Recommendation Agents for Electronic Commerce:
Effects of Explanation Facilities on Trusting Beliefs,” J. Manag. Inf. Syst., vol.
23, no. 4, pp. 217–246, May 2007, doi: 10.2753/MIS0742-1222230410.
[29] P. M. Podsakoff, S. B. MacKenzie, J.-Y. Lee, and N. P. Podsakoff, “Common
method biases in behavioral research: A critical review of the literature and
recommended remedies,” J. Appl. Psychol., vol. 88, no. 5, pp. 879–903, 2003,
doi: 10.1037/0021-9010.88.5.879.You can also read