TURKEY'S LEADING MOBILITY APP - Galata Acquisition Corp.
←
→
Page content transcription
If your browser does not render page correctly, please read the page content below
TURKEY’S LEADING MOBILITY APP
Disclaimers

About this Presentation
This confidential presentation (this “Presentation”) is for informational purposes only to assist interested parties in making their own evaluation with respect to an investment in connection with a possible transaction (the “Business
Combination”) involving Marti Technologies Inc. (“Marti” or the “Company”) and Galata Acquisition Corp. (“Galata” or “SPAC”), and for no other purpose. The information contained herein does not purport to be all-inclusive and none of
Galata, the Company or their respective representatives or affiliates makes any representation or warranty, express or implied, as to the accuracy, completeness or reliability of the information contained in this Presentation.
This Presentation and any oral statements made in connection with this Presentation do not constitute (i) a solicitation of a proxy, consent or authorization with respect to any securities or in respect of the proposed Business Combination or
(ii) an offer to sell, a solicitation of an offer to buy or a recommendation to purchase any securities. No such offering of securities shall be made except by means of a prospectus meeting the requirements of section 10 of the Securities Act of
1933, as amended (the “Securities Act”), or an exemption therefrom. You should not construe the contents of this Presentation as legal, tax, accounting, investment or other advice or a recommendation. You should consult your own counsel
and tax and financial advisors as to legal and related matters concerning the matters described herein, and, by accepting this Presentation, you confirm that you are not relying upon the information contained herein to make any decision.
The distribution of this Presentation may also be restricted by law and persons into whose possession this Presentation comes should inform themselves about, and observe, any such restrictions. The recipient acknowledges that it is (a) aware
that the United States securities laws prohibit any person who has material, non-public information concerning a company from purchasing or selling securities of such company or from communicating such information to any other person
under circumstances in which it is reasonably foreseeable that such person is likely to purchase or sell such securities, and (b) familiar with the Securities Exchange Act of 1934, as amended, and the rules and regulations promulgated
thereunder (collectively, the "Exchange Act"), and that the recipient will neither use, nor cause any third party to use, this Presentation or any information contained herein in contravention of the Exchange Act, including, without limitation,
Rule 10b-5 thereunder.
This Presentation and information contained herein constitutes confidential information and is provided to you on the condition that you agree that you will hold it in strict confidence and not reproduce, disclose, forward or distribute it in
whole or in part without the prior written consent of SPAC and the Company and is intended for the recipient hereof only. By accepting this Presentation, the recipient agrees (a) to maintain the confidentiality of all information that is
contained in this Presentation and not already in the public domain and (b) to return or destroy all copies of this Presentation or portions thereof in its possession upon request.
This Presentation is being distributed to selected recipients only and is not intended for distribution to, or use by, any person or entity in any jurisdiction or country where such distribution or use would be contrary to local law or regulation.
Neither this Presentation nor any part of it may be taken or transmitted into the United States or published, released, disclosed or distributed, directly or indirectly, in the United States, as that term is defined in the Securities Act, except to a
limited number of qualified institutional buyers, as defined in Rule 144A under the Securities Act, or institutional “accredited investors” within the meaning of Regulation D under the Securities Act.
Forward Looking Statements
Certain statements in this Presentation may be considered forward-looking statements within the meaning of the U.S. federal securities laws with respect to the proposed Business Combination. Forward-looking statements generally relate to
future events, such as the benefits of the Transaction or the anticipated timing of the Transaction, or SPAC or the Company’s future financial or operating performance. For example, statements regarding anticipated growth in the industry in
which the Company operates and anticipated growth in demand for the Company’s products, projections of the Company’s future financial results, possible growth opportunities for the Company and other metrics are forward-looking
statements. In some cases, you can identify forward-looking statements by terminology such as “pro forma,” “may,” “should,” “could,” “might,” “plan,” “possible,” “project,” “strive,” “budget,” “forecast,” “expect,” “intend,” “will,” “estimate,”
“anticipate,” “believe,” “predict,” “potential” and “continue” or the negatives of these terms or variations of them or similar terminology. Such forward-looking statements are subject to risks, uncertainties and other factors which could cause
actual results to differ materially from those expressed or implied by such forward-looking statements.
These forward-looking statements are based upon estimates and assumptions that, while considered reasonable by SPAC, the Company and their respective management, as the case may be, are inherently uncertain. Factors that may cause
actual results to differ materially from current expectations include, but are not limited to: competition; the ability of the company to grow and manage growth, maintain relationships with consumers, suppliers and strategic partners and retain
its management and key employees; costs related to the Business Combination; changes in applicable laws or regulations; the possibility that the Company may be adversely affected by other economic, business or competitive factors; the
Company’s estimates of expenses and profitability; the evolution of the markets in which the Company competes; the ability of the Company to implement its strategic initiatives and continue to innovate its existing products; the ability of the
Company to defend its intellectual property; and the impact of the COVID-19 pandemic on the Company’s business.
Nothing in this Presentation should be regarded as a representation by any person that the forward-looking statements set forth herein will be achieved or that any of the contemplated results of such forward-looking statements will be
achieved. You should not place undue reliance on forward-looking statements, which speak only as of the date they are made. Neither SPAC nor the Company undertakes any duty to update or revise these forward-looking statements.
You should consult the risk factors included in this Presentation and SPAC’s public filings with the SEC, including the “Risk Factors” section in the registration statement on Form F-4 and the proxy statement included therein (the “Registration
Statement”) that SPAC intends to file relating to the proposed Transaction and the “Risk Factors” section of other documents that SPAC files with the SEC from time to time, for additional information regarding risks and uncertainties related to
the potential Transaction and which could cause actual future events to differ materially from the forward-looking statements in this Presentation. Forward-looking statements speak only as of the date they are made. Readers are cautioned
not to put undue reliance on forward-looking statements, and SPAC and Marti assume no obligation and do not intend to update or revise these forward-looking statements, whether as a result of new information, future events or otherwise.

                                                                                                                                                                                                                                                             2
Disclaimers (cont’d)

Use of Projections
This Presentation contains financial forecasts for the Company with respect to certain financial results for the Company’s fiscal years 2022 through 2023. The Company’s independent auditors have not audited, studied, reviewed, compiled or
performed any procedures with respect to the projections for the purpose of their inclusion in this Presentation, and accordingly, they did not express an opinion or provide any other form of assurance with respect thereto for the purpose of
this Presentation. These projections are forward-looking statements and should not be relied upon as being necessarily indicative of future results. In this Presentation, certain of the above-mentioned projected information has been provided
for purposes of providing comparisons with historical data. The assumptions and estimates underlying the prospective financial information are inherently uncertain and are subject to a wide variety of significant business, economic,
competitive and other risks and uncertainties that could cause actual results to differ materially from those contained in the prospective financial information. Accordingly, there can be no assurance that the prospective results are indicative of
the future performance of the Company or that actual results will not differ materially from those presented in the prospective financial information. Inclusion of the prospective financial information in this Presentation should not be regarded
as a representation by any person that the results contained in the prospective financial information will be achieved.

The performance projections and estimates are subject to the ongoing COVID-19 pandemic, and have the potential to be revised to take into account further adverse effects of the COVID-19 pandemic on the future performance of SPAC and
Marti. Projected financial results and estimates are based on an assumption that public health, economic, market and other conditions will improve; however, there can be no assurance that such conditions will improve within the time period
or to the extent estimated by SPAC or Marti. The full impact of the COVID-19 pandemic on future performance is particularly uncertain and difficult to predict; therefore actual results may vary materially and adversely from the projections
included herein.

Financial Information; Non-GAAP Measures
The financial information and data contained in this Presentation is unaudited and does not conform to Regulation S-X promulgated under the Securities Act. Such information and data may not be included in, may be adjusted in or may be
presented differently in, the registration statement on Form S-4 to be filed relating to the Business Combination and the proxy statement/prospectus contained therein.

This Presentation also includes certain financial measures not presented in accordance with generally accepted accounting principles of the United States (“GAAP”) including, but not limited to, Adjusted EBITDA and certain ratios and other
metrics derived therefrom. The Company defines Adjusted EBITDA as net income (loss) plus non-operating income (loss), depreciation and amortization, net interest expense, income taxes, stock-based compensation and transaction costs.
These non-GAAP financial measures are not measures of financial performance in accordance with GAAP and may exclude items that are significant in understanding and assessing the Company’s financial results. Therefore, these measures
should not be considered in isolation or as an alternative to net income, cash flows from operations or other measures of profitability, liquidity or performance under GAAP. You should be aware that the Company’s presentation of these
measures may not be comparable to similarly-titled measures used by other companies. The Company believes these non-GAAP measures of financial results provide useful information for management and investors regarding certain financial
and business trends relating to the Company’s financial condition and results of operations. The Company believes the use of these non-GAAP financial measures provides an additional tool for investors to use in evaluating ongoing operating
results and trends and in comparing the Company’s financial measures with other similar companies, many of which present similar non-GAAP financial measures to investors. These non-GAAP financial measures are subject to inherent
limitations as they reflect the exercise of judgments by management about which expense and income are excluded or included in determining these non-GAAP financial measures.

This Presentation also includes certain projections of non-GAAP financial measures. Due to the high variability and difficulty in making accurate forecasts and projections of some of the information excluded from these projected measures,
together with some of the excluded information not being ascertainable or accessible, the Company is unable to quantify certain amounts that would be required to be included in the most directly comparable GAAP financial measures without
unreasonable effort. Consequently, no disclosure of estimated comparable GAAP measures is included and no reconciliation of the forward-looking non-GAAP financial measures is included.

Industry and Market Data
In this Presentation, SPAC and the Company rely on and refer to certain information and statistics obtained from third-party sources which SPAC and the Company believe to be reliable. While SPAC and the Company believe such third-party
information is reliable, there can be no assurance as to the accuracy or completeness of the indicated information, and the Company has not independently verified the accuracy or completeness of any such information.

Trademarks
This Presentation contains trademarks, service marks, trade names and copyrights of other companies, which are the property of their respective owners. The Company’s use thereof does not imply an affiliation with, or endorsement by, the
owners of such trademarks, service marks, trade names and copyrights. Solely for convenience, some of the trademarks, service marks, trade names and copyrights referred to in this Presentation may be listed without the TM, SM © or ®
symbols, but the Company will assert, to the fullest extent under applicable law, the rights of the applicable owners to these trademarks, service marks, trade names and copyrights. There is no guarantee that either SPAC or the Company will
work, or continue to work, with any of the firms or businesses whose logos are included herein in the future.

                                                                                                                                                                                                                                                         3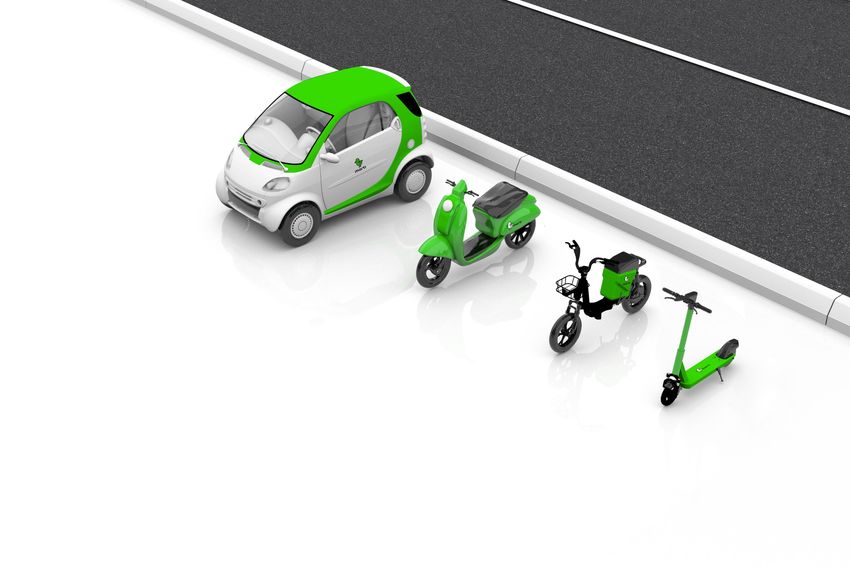
Galata has deep expertise and extensive experience in Turkey

           Kemal Kaya
           CEO
           ● 35+ years of executive and management experience in Turkey
           ● Senior Advisor to The Blackstone Group                         Marti is an excellent match for Galata
           ● Former CEO of Yapi Kredi Group, one of the leading financial
             groups in Turkey                                                 Annual market growth significantly in excess of inflation

            Daniel Freifeld                                                   Low penetration rates and favorable demographics
            President
            ● 20+ years of experience in Turkey
                                                                              Profitable and scalable unit economics reinforcing a discernible
            ● CIO of Callaway Capital Management                              competitive advantage
            ● Turkish speaker
                                                                              Favorable regulatory structure encouraging growth and
            Michael Tanzer                                                    opportunities for data-driven digital distribution
            CFO
            ● 13+ years of investment experience
                                                                              Further industry consolidation opportunities
            ● Portfolio Manager at Callaway Capital Management
            ● Former Senior Analyst at Southpaw Asset Management

                                                                                                                                                 4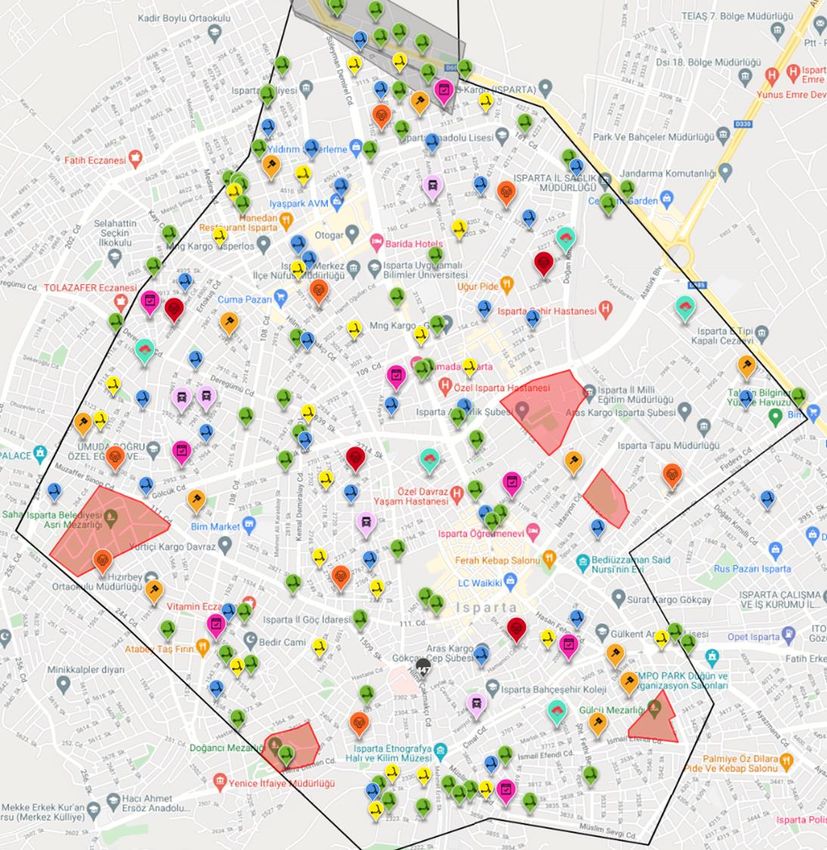
Transaction summary

                             About Marti                                                                                        Transaction overview                                                                            Due diligence conducted by Galata

●     Marti is Turkey’s leading mobility provider,                                                     ●       Galata is a NYSE-listed special purpose acquisition                                                      ●      Background checks on management and
      operating a fleet of e-scooters, e-bikes, and                                                            company which proposes to close a merger with                                                                   shareholders
      e-mopeds, serviced by proprietary software                                                               Marti in Q4 2022
                                                                                                                                                                                                                        ●      Engagement of leading global audit and
      systems and IoT infrastructure
                                                                                                       ●       Pro-forma enterprise value of c.$532 million and                                                                accounting firm for financial due diligence
●     Marti has achieved strong growth and best-                                                               equity value of c.$630 million
                                                                                                                                                                                                                        ●      Engagement of international and local counsel
      in-class unit profitability 1
                                                                                                              o      Implied pro forma enterprise value of 4.2x                                                                for legal due diligence
●     As the #1 mobility app on the iOS & Android                                                                    2023FD (Fully Deployed 2) net revenue of c.$125
                                                                                                                                                                                                                        ●      Engagement of the world’s leading business
      stores in Turkey, Marti seeks to become                                                                        million and 9.7x 2023FD (Fully                        Deployed 2)
                                                                                                                                                                                                                               consultancy for comprehensive commercial due
      Turkey’s first mobility super app by                                                                           EBITDA of c.$55 million
                                                                                                                                                                                                                               diligence
      expanding into other attractive adjacencies,
                                                                                                              o      $57.5 million convertible note PIPE
      leveraging its growing and loyal customer                                                                                                                                                                         ●      Comprehensive evaluation of competitors and
                                                                                                                     commitments plus assumed incremental PIPE
      base                                                                                                                                                                                                                     comparative transactions
                                                                                                                     commitments of up to $92.5 million to be raised
                                                                                                                     post-announcement will fund future growth                                                          ●      Independent analysis of current market share,
                                                                                                                                                                                                                               unit economics, and regulatory regime
                                                                                                       ●       Marti shareholders are rolling 100% of their equity
                                                                                                               and are expected to own c.50% 3 of the Company at
                                                                                                               close

Source: Company information, Helbiz and Bird investor presentations and SEC filings. Note: 1. In FY2021, Marti had a positive (+1%) EBITDA margin vs Bird’s (-33%) and Helbiz’s (-409%) significantly negative EBITDA margins. 2. FD refers to Fully Deployed figures that Marti would be expected
to achieve in 2023 if only the proceeds from the ~$57.5 million in convertible note PIPE commitments plus assumed incremental PIPE commitments of up to ~$92.5 million to be raised post-announcement were to be deployed towards purchasing E-Scooters, E-Mopeds and E-Bikes                        5
immediately upon receipt. 3. Based on the Pro-Forma Diluted Ownership laid out on the Detailed transaction overview slide.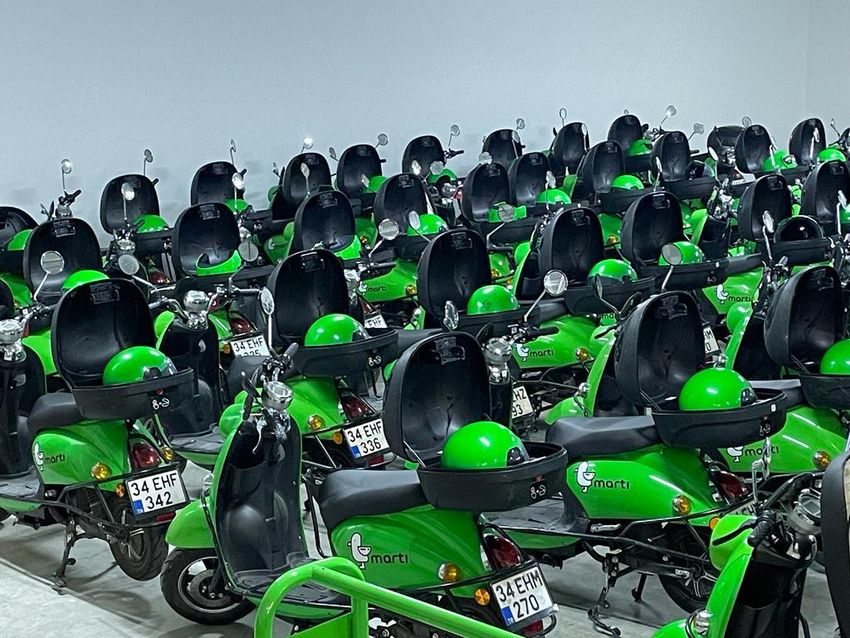
Marti Overview

We believe…

                               Transportation is the number one issue in emerging market megacities

                                              Everything on wheels will be electric…

                                            … and everything electric will be shareable

Source: Company information.
                                                                                                      7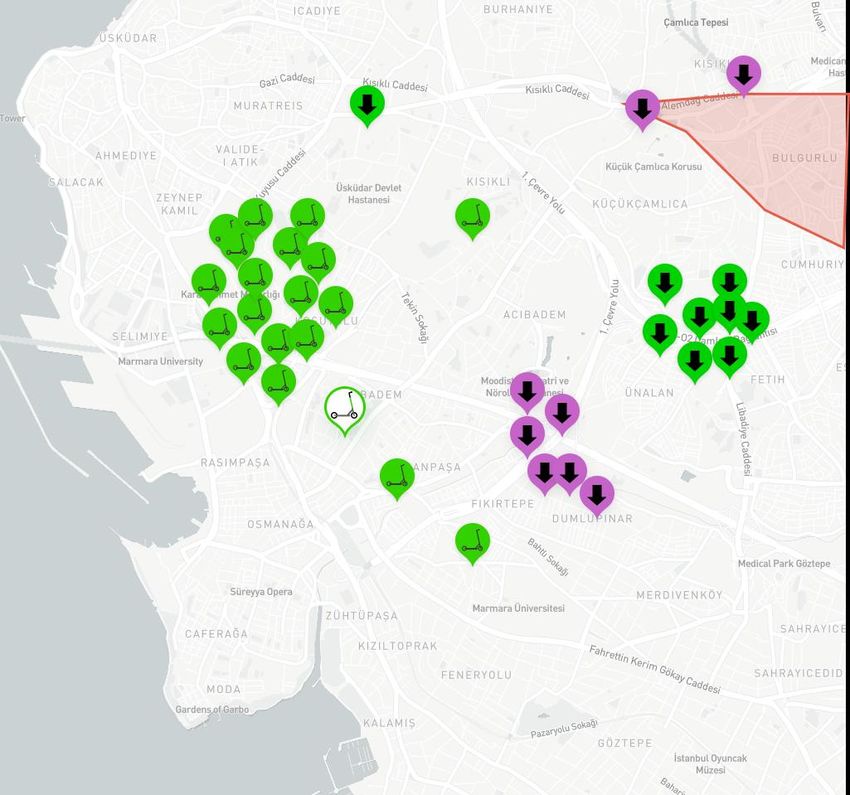
Leadership team…

                          Alper Öktem                                Cankut Durgun                                    İrem Bilgic                            Sena Öktem
                          Founder, CEO                               Cofounder, President                             Chief Operating Officer                Cofounder, Deputy CEO

                                       Erdem Selim                                           Eyal Enriquez                                          Levan Yakut
                                       Chief Financial Officer                               Chief Strategy Officer                                 Chief Vehicle Officer

                           Management team cumulatively has c.85 years of experience across technology, telecommunications, finance, and consulting industries

Source: Company information.
                                                                                                                                                                                     8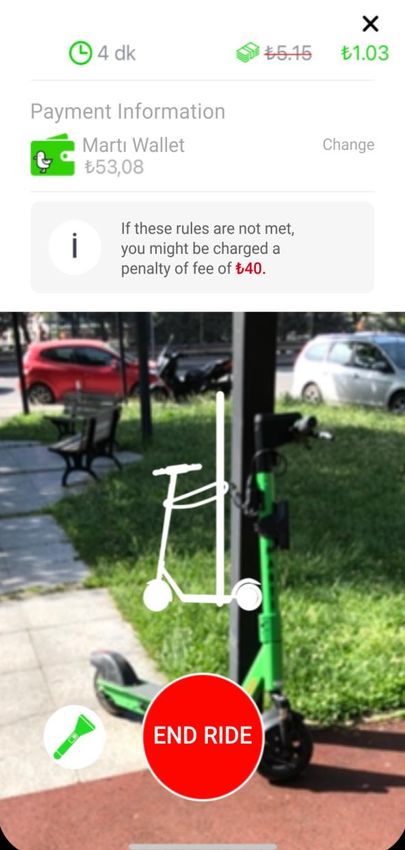
…backed by investors with strong knowhow of Turkey and mobility

Marti’s diverse investor base includes the leading mobility funds in the Valley and MENAT region, the largest private
equity fund in Turkey and the largest provider of international finance to Turkey

                      Leading early stage VC and mobility          The largest private equity primarily        Leading provider of international finance to
                              investor in MENAT                    focusing on investments in Turkey                     Turkey’s public sector

                       Silicon Valley-based early stage VC,   San Francisco-based debt financing provider to        UAE-based global venture capital
                            dedicated to global mobility            high growth technology companies                           investor

Source: Company information.
                                                                                                                                                              9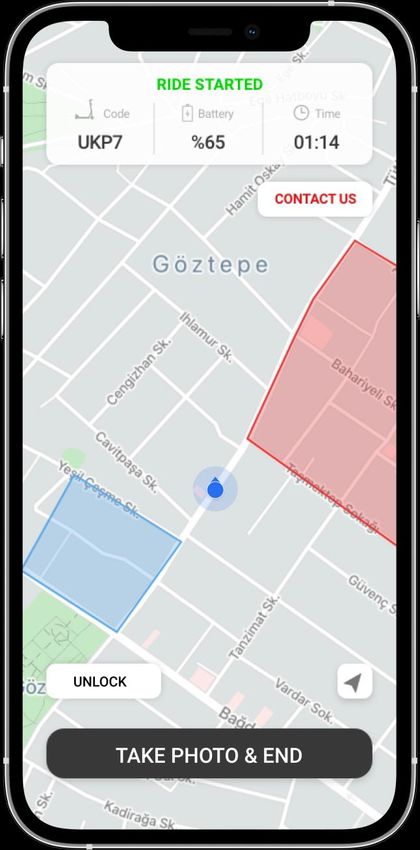
Marti is Turkey’s mobility app leader today…

                                                        Key figures

               #1 travel app                                                                                  64%
                in Turkey (iOS / Android)1                                                               Market share2

                        3.5M+                                                                                 92%
                       Unique riders3                                                                    Rides from
                                                                                                      daily commuters4

                       $125M                                                                                  57%
                         2023 FD net                                                                      2023 FD gross
                          revenues5                                                                         Margin5,6

Source: Company information. Note: 1. Travel app with the highest number of #1 ranking in Turkey iOS/Android app stores for last 12 months as of May 31, 2022. Ranking figures based on data.ai (fka AppAnnie). 2. Total app downloads as of May 31, 2022 as per data.ai (fka app.annie) as compared to five
competitors. Only micromobility operators included in analysis. Market share figures reflect Marti's performance across the aggregate of its existing three service modalities: escooters, ebikes, and emopeds. Individual market shares by modality are different. 3. Internal company data as of July 14, 2022. 4.
Share of rides from daily commute and first and last mile journeys in Istanbul. Definition of journeys: (i) first and last mile: rides that start or end in 100m radius of metro, metrobus, marmaray, ferry stops; (ii) leisure: Rides with more than 10 times difference between the total ride distance and the air    10
distance (bird’s eye view) from start to end points of ride (iii) commute: all remaining rides. Outliers for short or missing distance info excluded. Period: Apr 2021 – Mar 2022.. 5. Based on Fully Deployed figures that Marti would be expected to achieve in 2023 if only the proceeds from the ~$57.5 million in
convertible note PIPE commitments plus assumed incremental PIPE commitments of up to ~$92.5 million to be raised post-announcement were to be deployed towards purchasing E-Scooters, E-Mopeds and E-Bikes immediately upon receipt. 6. Pre depreciation.
…and Marti is on its way to becoming Turkey's first mobility super app
Environmentally friendly and complementary services for the daily commute Other Future Opportunities
Mobility as a Service Provider
E-scooters E-bikes E-mopeds E-cars
Launch Date 2019 2021 2021 2024E
Revenue per ride1 $0.8 $1.3 $1.6 $2.97
Avg. Distance2 1.8 km3 1.9 km4 3.2 km5 8.0 km7
Fintech Services Advertisement
Avg. Duration2 c.10 minutes3 c.11 minutes4 c.13 minutes5 c.25 minutes7
Age Range 16-40 years old6 16-70 years old6 16-70 years old6 18-70 years old7
46,000+ currently fully-funded vehicles; expected to reach ~128,000+ by the end of 20236
Source: Company information, crowd screening. Note: 1. Average 2023E net revenue per ride, except for E-cars. 2. Average per ride figures. 3. Last 12 months data: June 2021 – May 2022 period. 4. Dec 2021 – May 2022 data indexed to last 12 months E-scooters data to achieve full year
figures. 5. Last 11 months data: July 2021 – May 2022 period. 6. Fully funded fleet as of July 2022. Expected fleet size is based on full $150M PIPE funding. 7. Management estimates. 11As Marti grows, scale is expected to further reinforce its competitive advantages
Rider
preference
Single
country focus
Greater
Increased
vehicle
demand /
availability
volumes
Lower
depreciation
Lower price
Better Lower
vehicles with operating Vertical
longer useful Better integration
cost
life margins and
cash position
Faster
vehicle
expansion
Source: Company information.
12Turkey offers significant untapped mobility opportunities, but does not have a super app yet…
All of the top 20 world economies have a mobility super app… except for Turkey
Source: Company information.
13… and Turkey needs immediate mobility solutions
Inadequate public transportation and unpleasant mobility alternatives for last mile journeys
High cost of car ownership1 High traffic congestion2
Hyundai i10
2.0 1.9x
64x 1.8
1.6
1.4
1.2
1.1x 1.1x 1.0x
1.0
0.8
Chevrolet Spark Dacia Sandero Dacia Spring 0.6
12x 8x 0.4
6x 0.2
0.0
Turkey U.S. France U.K. Istanbul Paris New York London
Min Cost of Owning a New Car / Min Monthly Wage Traffic congestion2
Low metro station density Limited taxi penetration3
292
16
13 13 14
14
12
39 10
8
6
17 4
7 2 1
0
Istanbul London New York Paris Istanbul Paris London New York
# of stations per 100 km2 # of taxis per thousand people
Source: Statista, OECD, TomTom, Transport for London, İstanbul Büyükşehir Belediyesi, Todd W. Schneider, Hyundai Turkey, Chevrolet US, Dacia UK and Dacia France, WorldPopulationReview, CityPopulation, Transport & Environment, Salaryaftertax. Note: 1. Represents the lowest priced new car
purchase cost in each country as of mid 2020. Maintenance and fuel costs are significant costs and are not included and net minimum wage salaries are used in this graph. OECD Annual Average 2020 FX rates and OECD minimum wage figures are used. 2. Based on TomTom 2021 traffic index. Indexed 14
to London 2021 traffic congestion score. 3. Both taxis and cabs and private hire vehicles are included. Assumes no private hire vehicles in Turkey.By addressing this unmet and underserved demand, Marti has grown significantly with attractive margin
levels, even during COVID
Marti offers LTM revenue is consistently growing
LTM Net Revenue1 Operational Fleet
(million $) (000 vehicle)
Last mile connectivity - complementary to long Full curfew Partial curfew
25 35
distance transport 30
20
25
15 20
10 15
Timing flexibility with on demand booking 10
5
5
0
'- 0
Mar-22May-22
Mar-19 May-19 Jul-19 Sept-19 Nov-19 Jan-20 Mar-20 May-20 Jul-20 Sept-20 Nov-20 Jan-21 Mar-21 May-21 Jul-21 Sep-21 Nov-21 Jan-22 Mar-22 Jun-22
Ability to pick-up and drop-off anywhere LTM Net Revenue ($) Operational Fleet ('000s)
Attractive gross profit margin levels (LTM)
Gross margin (%)
Affordable transportation
60%
45% 37% 37% 40% 41% 38% 39%
33% 31%
30%
15%
Vehicle designs tailored to local topography and 4%
0%
weather
(15%) (7%) (4%)
(14%)
(30%) (24%)
(45%)
2 2
Environmentally friendly and socially distanced Q2'19 Q3'19 Q4'19 Q1'20 Q2'20 Q3'20 Q4'20 Q1'21 Q2'21 Q3'21 Q4'21 Q1'22 Q2'22
travel solutions
Gross Margin (pre-depreciation)
Source: Company information. Note: Based on last 12 months avg pre-depreciation gross margin. 1. Last 12 months net revenue. Periods before Feb 2020 do not have 12 months rolling data so monthly revenue is annualized by multiplying by 12. 2. Q2’19 and Q3’19 LTM are based on 6 months and 9
months, respectively. 15Marti's service exhibits low price elasticity of demand, as evidenced by the results of its recent price increase
~25% price increase in 15 zones A Ride per vehicle per day in control B Factoring out the negative impact of
compared with control group of 2 group declined by 16%, highlighting seasonality in control group, revenue per
zones without change adverse seasonality impact on demand vehicle increased by 24%
# of zones % chg. in price
Price impact – Post-increase
Zones without price change Performance of control Post- Pre- Post-
2 0% Pre-increase3 % diff. on zones with price (adjusted for % diff.
(control group)2 group increase3 increase4 increase4,5 seasonality)4,6
A increase4
Ride per vehicle Ride per vehicle per
Zones with price increase 15 25%1 4.1 3.4 (16%) 3.3 2.8 3.2 (3%)
per day day
B
Net revenue per
26.1 27.9 32.3 24%
vehicle per day (TL)
+25% -16% +24%
11.0 TL 4.1 32.3 TL
8.9 TL 3.4 26.1 TL 27.9 TL
Average old price per ride Average new price per ride Before After Before After (without After (with seasonality
(10 min ride) (10 min ride) seasonality adjustment) adjustment)
B A Ride per vehicle per day B Average daily net revenue per vehicle
Source: Company information. 1. Weighted average of price change is based on number of vehicles. Individual price change by zone varies between 10% and 51%. 2. 2 zones in Istanbul (Asia and Europe-2) are used as control groups since prices did not change during analysis period. 3. Istanbul Europe
1 zone analysis period is used for control group to factor out seasonality. 4. Performance analysis is based on 10 days prior to price change vs. 10 days after price change. 15 zones that have 10 days of post increase data are included in analysis group. 5. Performance without adjusting for seasonality. 16
6. Performance after adjusting for seasonality based on control groupRevenue per minute increased ~51% in TL terms and ~12% in USD terms in Q4 2021 vs. Q4 2020, while
daily rides per vehicle stayed the same
~51% increase in TL revenue per minute applied to reflect Daily rides per vehicle stayed the same even
TL depreciation against USD and rising costs though deployed fleet size doubled
150.9 Q4 2020 Q4 2021 Q4 2020 Q4 2021
111.8
100.0 100.0 100.0 100.7
100 100
TL Revenue per minute USD Revenue per minute Daily rides per vehicle
All charts have been indexed to Q4 20201
Source: Company information. Note: Price change is only one of the factors impacting daily rides so this analysis needs to be viewed as a directional and correlated view rather than a definite causality. 1. Q4 2020 Figures shown as 100.
17Despite its mobility leadership in Turkey, Marti's current presence remains a small fraction of the total
addressable market in Turkey
Today 2026 E
Consumer Mobility Market1
TAM1 (TAM)
Consumer Mobility Market1
CAGR: 5%
(TAM)
$70 – 80B
$55 – 65B
Shared Mobility Market2
(TSM)
Shared Mobility Market2 TSM2
(TSM) CAGR: 11%
$18 – 25B
$10 – 15B
Marti’s current Marti’s estimated
market presence3 market presence4
$0.02B $0.13B
Source: McKinsey disruptive scenario and Company information. 1. TAM (total addressable market) is the total consumer mobility market including privately owned as well as shared mobility to get around locally. 2. TSM (total serviceable market) includes all shared mobility to get around locally (excl.
private ownership). 3. Marti’s current revenues of c.$20m based on latest annualized net revenue using last 12 months as of May 2022. 4. 2023 fully deployed revenue estimate shown as a proxy. Fully Deployed figures are based on the assumption that Marti would be expected to achieve in 2023 if 18
only the proceeds from the ~$57.5 million in convertible note PIPE commitments plus assumed incremental PIPE commitments of up to ~$92.5 million to be raised post-announcement were to be deployed towards purchasing E-Scooters, E-Mopeds and E-Bikes immediately upon receipt.Key investment highlights
1. Highly attractive market demographics
2. Clear market leader
3. Strong customer retention, reinforced by scale
4. Vertically integrated business model driving lower
costs and higher revenues
5. Best-in-class unit economics
6. Constructive regulatory framework
7. Strong ESG fundamentals
Source: Company information. Note: Key investment highlight #5 is in comparison to Bird and Helbiz.
19Single country
focus
1. Highly attractive market demographics
Highly urbanized society, with several large
Large, young and growing population base1
and dense city centers
% Population < Turkey has a
50 yrs2 58% 61% 62% 58% 54% 60% 62% 55% 76% population larger
than the Nordics,
2021 Belgium and
Growth (%)
0.4% 0.6% (0.1%) 0.0% (0.2%) 0.2% 0.5% 0.1% 0.8%
Spain combined
3
10
84 85
65 68
60
47
38 4
2 2 2
9 10 1 1 1 1
Austria
Italy
France
Germany
Sweden
Poland
Spain
UK
Turkey
Germany
Austria
Italy
France
Poland
Sweden
Spain
UK
Turkey
2021 Population (million) Number of cities >1 million population4
Source: BMI, CityPopulation. Note: 1. 2021 figures are based on estimates as of 2020. 2. Represents 0-49 age group. 3. Doesn’t include immigrants. 4. Reflects population of city centers only.
20Greater vehicle
availability
2. Clear market leader
Marti is the most downloaded travel Marti operates in 16 cities, representing c.69% of
app in Turkey national GDP
# of app downloads in millions1 Istanbul
30.1%
1.1%
3.8%
5.6 64% 1.8% 0.7%
market 0.4%
4.0% Ankara
share 9.6%
0.5%
1.1%
Izmir 0.5%
0.4%
6.1%
0.9%
0.4%
2.0%
2.0%
1.8 1.1%
1.9%
2.6%
Adana 1.2%
Antalya
0.7
0.3 0.2 0.1
Comp #1 Comp #2 Comp #3 Comp #4 Comp #5
Marti’s footprint Pending license2 Multi Modality3 % City GDP as a percentage of Turkey’s GDP
Source: Sensor Tower, GDP data per city from Turkstat. Note: 1. As of May 31, 2022 (as per data.ai, fka App Annie) as compared to five competitors. Only micromobility operators included in analysis. Market share figures reflect Marti's performance across the aggregate of its existing three service
modalities: escooters, ebikes, and emopeds. Individual market shares by modality are different. 2. Marti has applied for license in Van, Usak, Trabzon, Diyarbakir, and Sivas. 3. E-scooters, e-bikes, and e-mopeds are in operation in Istanbul and Izmir; E-scooters and e-bikes are in operation in Adana and 21
Antalya.Rider preference
Increased
demand
Greater vehicle
availability
3. Strong customer retention, reinforced by scale
Commute accounts for 92% App opening to ride conversion ratio increases with vehicle availability2
of all rides1 54%
53%
48% 50%
43%
34%
25%
20%
15% 17%
10% 12%
First and
last mile
1000 800 600 500 400 300 200 100 50 40 30 20
commute
Daily 31% Distance of rider to the nearest vehicle (meter)
commute
61%
Vehicle availability drives customer retention3
Leisure 4.0 4.0 3.9
28.6
8% 3.5 3.4
3.3 26.0
3.0 3.1
2.9 18.8
2.6 16.7 17.7
2.4 20.6 3.3
2.2 2.1
9.7
7.9
5.8
2.1 3.7
0.1 0.3 0.8
Jun-19
Jun-20
Jun-21
Jun-22
Dec-19
Dec-20
Dec-21
Mar-19
Mar-20
Mar-21
Mar-22
Sep-20
Sep-19
Sep-21
92% non-discretionary
Avg. daily vehicles deployed (000 vehicles) Avg. monthly rides per unique rider
Source: Company information. Note: 1. Share of rides from daily commute and first and last mile journeys in Istanbul. Definition of journeys: (i) first and last mile: rides that start or end in 100m radius of metro, metrobus, marmaray, ferry stops; (ii) leisure: Rides with more than 10 times difference
between the total ride distance and the air distance (bird’s eye view) from start to end points of ride (iii) commute: all remaining rides. Outliers for short or missing distance info excluded. Period: Jun 2021 – May 2022. 2. Scooters (fleet generations 1,2,3,4) included in analysis for Jun 2021 – May 2022 22
period. 3. Based on E-scooters data, Mar 2019 – Jun 2022 period.4. Vertically integrated business model drives lower costs & higher revenues
Marti’s in-house management across the micromobility value chain sets the company apart from other operators
Mobility applications End user, operation, technical etc. ▲ ▲ ▲ ▲ ▲ ▲ ▲
Battery charging ▲ □ □ ▲ □ ▲ □
Fleet operations Repair & Maintenance ▲ □ □ ▲ ▲ ▲ ▲
Rebalancing ▲ □ □ ▲ □ ▲ □
Vehicle design ▲ ▲ ▲ ▲ ▲ □ ▲
Vehicle manufacturing
Parts procurement and vehicle
assembly ▲ □ □ □ ▲ □ ▲
▲ In-house managed □ Third party managed
Source: Public research.
23Rider preference
Lower
operating cost
4. Vertically integrated business model drives lower costs & higher revenues (cont’d)
Vertical
integration
In-house software – system architecture
Secure and scalable Supporting full in-house development of Backed by leading tech service
software systems applications providers
Modularity End-user applications
Microservices approach with few monolith
applications and serverless services
Operation applications Data Server App Server
Horizontal Scaling Technical service applications
AWS Cloud enables on demand server capacity
based on traffic loads
Call center applications
Maps
Design for Failure Back office applications
Multiple instances, automatic service restart
! and regular server backups to avoid
interruptions Payment gateway (under development)
Payments Notifications
Source: Company information.
24Rider preference
4. Vertically integrated business model drives lower costs & higher revenues (cont’d)
Vertical
integration
In-house data analytics – proprietary tools and systems
Vehicle rebalancing to meet customer demand Automated grouping of battery swap tasks
• Real-time modelling • Improved efficiency of task
Swap1 allocation
• Based on demand Swap2
prediction and fleet • Increases tasks per shift
footprint
Swap3 • Minimizes distance traveled
Available for
rebalancing Swap4 by operation vehicles
Selected vehicles • Regular updates for
continuous improvement
Swap5
Drop-off points to be
selected
Drop-off point selected
Source: Company information.
25Rider preference
4. Vertically integrated business model drives lower costs & higher revenues (cont’d)
Vertical
integration
In-house data analytics – proprietary tools and systems
Damage identification tool and self-diagnostics system Health checker app
Damage prediction Self-diagnostics
• In-house app for technical
Vehicle : PBR2 Location: IZMIR Reason: Last 7 rides average
distance low. Average distance:655.81 meters
PPND - IMMEDIATE ACTION (IoT - Vehicle Communication) 22:21
service employees - enables
Vehicle : 9T23 Location: ASYA Reason: Last rides repair
VHU5 - SUSPICIOUS ACTIVITY (IoT - Lock Open) 12:03
quick diagnosis
comment. Comment: Throttle didn’t work.
21:38
Vehicle : EKAP Location: ASYA Reason: Last rides repair 9R9D - SUSPICIOUS ACTIVITY (IoT - Lock Open)
comment. Comment: Front brake wasn’t working
9R9D - IMMEDIATE ACTION (Vibration Level : High )
19:04
• Reduces need to bring
vehicles to warehouse
• Automatic repair ticket
Helps detect mechanical errors Detects electronic malfunctions
generation
Algorithm proxies used Types of error detected
• Gas sensor
• Average ride distance or duration
• Motor sensor
• In-app ride rating • IoT lock communication
• Brake sensor
• In-app customer comments
• IoT board – motor controller
communication
Source: Company information.
26Rider preference
4. Vertically integrated business model drives lower costs & higher revenues (cont’d)
Vertical
integration
In-house built consumer mobile app
PFGR %65 01:14
Easy location Quick unlock Easy navigation Easy docking Quick payment
Easily find the nearest Quickly scan a QR code Easily navigate to your Pay quickly through a
Park easily with IoT lock
Marti and reserve it and start your ride destination using directions variety of options
Source: Company information. Note: iOS App store rating: 4.7 & Google Play Store rating: 4.0.
27Lower
operating cost
4. Vertically integrated business model drives lower costs & higher revenues (cont’d)
Vertical
Better vehicles with integration
longer useful life
In-house hardware capabilities
Ability to produce customized products that suit local needs and deliver superior operational performance
Product design Component procurement Product assembly Outcomes
Prototype testing and design Proprietary sourcing In-house assembly
• Faster pace of vehicle improvement
iterations
Chassis Battery • Greater remote control and diagnosis
40+ product prototypes are evaluated capability over the vehicle
by hardware team
• Lower vehicle costs
Final vehicle is designed based on local
geographic needs and cost-benefit ratio of
individual components
Motion sensors Wheel • Reduced component part lead times
In-house built hardware & IoT systems
Assembly of sourced components by • Lower theft and vandalism
Strong relationship with local and
in-house team and assembly partners
foreign manufacturing partners
Enables steady supply and
operational efficiency Drives vehicle quality, cost benefits
IoT boards
IoT Locks and lower lead times
Source: Company information.
28Lower
operating cost
4. Vertically integrated business model drives lower costs & higher revenues (cont’d) Better
margins and
cash position
Low labor cost
Minimum wage in Turkey is lower than that of China
2020 Real Minimum Wage ($)
c.$24,700
c.$22,900
c.$21,700 c.$21,100
c.$15,100
c.$4,300 c.$4,000
c.$860
Source: Trading Economics for China and India; OECD for the rest.
29Rider preference
4. Vertically integrated business model drives lower costs & higher revenues (cont’d)
Vertical
integration
In-house operations and control systems
Control room Regional operations dashboard
● 24x7 monitoring of warehouses
and vehicles in different regions
● Coordination and mobilization of
field teams as needed for prompt
response
Operations field team
● Battery replacement (swap) teams
in action
● Live status check 24x7
● Working in shifts for 24 hours a ● Fleet deployment adjusted as per usage
day, 7 days a week ● Any operational need is addressed promptly
Source: Company information.
30Lower
operating cost
4. Vertically integrated business model drives lower costs & higher revenues (cont’d) Better
margins and
cash position
In-house security systems and effective use of CCTVs result in low rates of theft and vandalism
Surveillance and security systems in place across all operating cities
Monthly theft and
Security team of motorcyclists
vandalism %1
that operate 24x7 to ensure
safety of vehicles and
intervene when needed
< 0.1%
Access to high density
public CCTV cameras in
Turkey
Marti’s innovative physical IoT based cable lock
Source: Company information. Note: 1. All time average as of May 2022.
31Better vehicles
with longer
useful life
4. Vertically integrated business model drives lower costs & higher revenues (cont’d) Better
margins and
cash position
In-house maintenance and vehicle assembly lengthens useful life of equipment
Warehouse maintenance teams Electronic repair teams reuse valuable components
• Vehicle repair & quality control in warehouse • Centrally located, Istanbul-based
• Led by mechanic managers, technicians, teams
quality control, coating and cleaning
• Repair battery, IoT board, IoT lock,
personnel
engine driver and other valuable
parts
Battery repair IoT board repair
Improving useful life of fleet 1 with increased experience
Generation 2 Generations 3 and beyond
Generation 1
24 months +24 months +24 months
16 months
Locally designed and
assembled vehicles 10 months
8 months
Off-the-shelf vehicles
Source: Company information. Note: 1. Figures refer to scooters only
32Rider preference
Better vehicles
with longer Lower
useful life operating cost
5. Best-in-class unit economics Better
margins and
cash position
Consistently improving unit economics
Generations 1 & 2 Generations 3 & 4 Delta
vehicles1 vehicles2,3
Daily net revenue per vehicle $2.77 $2.774 0%
Daily net operating costs per vehicle $2.25 $1.65 (27%)
Daily gross margin $0.52 $1.11 +114%5
All-in vehicle costs $660 $632 (4%)
Payback period days 1,227 567 (54%)6
Share of fleet5 12% 88% -
Source: Company information. Note: 1. Gen 1&2 figures reflect only 2020 performance. 2. Gen 3&4 figures include the total life cycle of the E-scooters. 3. Generation 5 vehicles are excluded since year-round figures are not available yet. 4. Gen 3&4 vehicles of an advanced age have
been moved to locations of lower relative demand upon the arrival of new Gen 5 vehicles. Gen 1&2 vehicles always operated in the same locations of higher relative demand as Marti had yet to expand to new locations. 5. Delta percentage does not match the calculation based on 33
the numbers shown in the slide due to rounding. 6. Refers to E-scooters fleet.Lower
operating cost
5. Best-in-class unit economics (cont’d) Better
margins and
cash position
More vehicles drive greater usage
Average # of vehicles deployed Average rides per vehicle per day # of Rides
(thousand) (million)
3.0 2.9
2.6 2.7
2.4
103
96
38
73
67
31
22
30 27
10
18 4 18
9 25 26
36 8
17
2020A 2021A 2022E 2023E 1 2023FD 2 2020A 2021A 2022E 2023E 1 2023FD 2 2020A 2021A 2022E 2023E
1
2023FD
2
E-Scooters E-Mopeds E-Bikes
Source: Company information. Note: The figures in average rides per vehicle per day and # of Rides include all modalities. 1. 2023 estimates assume receipt of proceeds from the ~$57.5 million in convertible note PIPE commitments plus assumed incremental PIPE commitments of up to ~$92.5 million to be
raised post-announcement. 2. FD refers to Fully Deployed figures that Marti would be expected to achieve in 2023 if only the proceeds from the ~$57.5 million in convertible note PIPE commitments plus assumed incremental PIPE commitments of up to ~$92.5 million to be raised post-announcement were to 34
be deployed towards purchasing E-Scooters, E-Mopeds and E-Bikes immediately upon receipt.Lower
operating cost
5. Best-in-class unit economics (cont’d) Better
margins and
cash position
Greater revenue per ride driven by new modalities
# of Rides Net revenue per ride Net revenue
(million) ($) ($, million)
$125
103 85
$1.16 $1.17 $1.22
73 $0.99
$0.87
27 23
18 17
8 10
1 2 1 2
2020A 2021A 2022E 2023E 2023FD 2020A 2021A 2022E 2023E 2023FD 2020A 2021A 2022E 2023E 1 2023FD 2
Source: Company information. Note: 1. 2023 estimates assume receipt of proceeds from the ~$57.5 million in convertible note PIPE commitments plus assumed incremental PIPE commitments of up to ~$92.5 million to be raised post-announcement. 2. FD refers to Fully Deployed figures that Marti would be
expected to achieve in 2023 if only the proceeds from the ~$57.5 million in convertible note PIPE commitments plus assumed incremental PIPE commitments of up to ~$92.5 million to be raised post-announcement were to be deployed towards purchasing E-Scooters, E-Mopeds and E-Bikes immediately 35
upon receipt.Lower
operating cost
5. Best-in-class unit economics (cont’d) Better
margins and
cash position
Improving unit economics
Net revenue per ride Net costs per ride2 Gross profit per ride3
($) ($) ($)
CAGR CAGR CAGR5
(11%) +19%
+2%
$0.75
$1.22 $0.58
$1.16 $1.17 $0.55 $0.53 $0.69
$0.53 $0.64
$0.99
$0.87 57%
$0.42 $0.41 55%
$0.33
42%
36% 37%
1 4 1 4 1 4
2020A 2021A 2022E 2023E 2023FD 2020A 2021A 2022E 2023E 2023FD 2020A 2021A 2022E 2023E 2023FD
Gross profit per ride ($) Gross profit margin (%)
Source: Company information. Note: CAGR calculated based on 2023 FD (Fully Deployed) figures. In FY2021, Marti had a positive (+1%) EBITDA margin vs Bird’s (-33%) and Helbiz’s (-409%) significantly negative EBITDA margins. 1. 2023 estimates assume receipt of proceeds from the ~$57.5 million in
convertible note PIPE commitments plus assumed incremental PIPE commitments of up to ~$92.5 million to be raised post-announcement. 2. Refers to net variable costs per ride. 3. Refers to pre-depreciation gross profit. 4. FD refers to Fully Deployed figures that Marti would be expected to achieve in 2023 if
only the proceeds from the ~$57.5 million in convertible note PIPE commitments plus assumed incremental PIPE commitments of up to ~$92.5 million to be raised post-announcement were to be deployed towards purchasing E-Scooters, E-Mopeds and E-Bikes immediately upon receipt. 5. Growth rate for
36
gross profit per ride.Single country
focus
6. Constructive regulatory framework
E-scooter regulatory framework –
local requirements
National Local server requirement for operational data
1 Permits awarded for five years at the national level upkeeping or reading
30% of scooters owned by each operator must
be produced locally, starting in December 2024
2 E-scooter licenses awarded for two years at city level Able to be operated in a fully dockless model
City
Helmets recommended, but not required
3 Operational permits awarded at district level
Districts receive a "per scooter per day" fee
District
Source: Official Gazette of E-Scooter Regulations.
37Rider preference
7. Strong ESG fundamentals
Environmentally friendly transportation mode and 100% recycling
By 2023, Marti could help save CO2 emission equivalent Supporting environmental sustainability
to the carbon absorbed by c.1m trees1 p.a.
130 100% Electric vehicles – Currently 46,000+ fully-funded, highly-efficient
and clean vehicles aligned with the European Bank of Reconstruction and
Development’s (‘’EBRD’’) ‘’Green Cities’’ concept
(73%)
Waste reduction – Several vehicle parts are repaired in-house and reused
Reduction
~90% Battery
~80% New locks
~60% Engine (motor)
Reuse rates of vehicle parts2
35
Recycling – Reprocess of all parts of decommissioned vehicles and fully
recycling other parts through third parties
Majority renewable energy – Targeting majority renewable clean energy
Replacement Journeys E-scooter usage for charging vehicles in the mid-term. Current usage in line with
Total Lifecycle Emissions (g C02 / km) Turkey's 42%3 energy share from renewable sources
Source: Company information. EY report, Statista, EBRD, Ministry of Environment and Urban Planning, Ministry of Energy and Natural Resources. Note: 1. Based on 2023 Fully Deployed number of rides; assuming c.95g of lower CO2 emissions per person km by all modalities vs replacement journeys, average
distance traveled by E-scooter (1.8km), Moped (3.3km) and E-Bike (1.9km) and a tree absorbs c.22kg of CO2 / year. 2. Most recent data for July 1-15, 2022. 3. Total share of renewables in 2020 as % of total electricity production in Turkey. 38Rider preference
7. Strong ESG fundamentals
Strong sustainability and governance setup with social commitment
Sustainable business model Strong corporate governance setup
Supporting youth employment – 34% of Marti’s workforce is in the 15-24 Above average women participation in management roles -
years age group, which is a vulnerable unemployed segment Women constitute c.36% 4 representation in management roles
25% 25% in Marti, a significantly higher rate vs. Turkey average
23%
20% 20% 20% 15-24
18% 18%
Women employees in management roles in Turkey 19%
14% 36%
13%
12% 15+ Women employees on Marti management team
10% 11% 11% 11%
10%
2014 2015 2016 2017 2018 2019 2020 2021 Marti’s women representation vs Turkey’s workforce
Unemployment rate1 % in Turkey, 2014 - 2021
Accessible transportation mode for “everyone” – Marti covers c.96% of Istanbul, Performance based pay - Competitive compensation packages and
serving all segments of the population, including underserved communities 2 reward programs at every level promoting employee satisfaction
and work excellence
Health & safety – Minimal workplace accidents
Annual average accidents (2019-2022)3
Major 0
Minor 1.0
Source: Turkstat, Company information. Note: 1. 15+ age segment covers all unemployed people older than 15 years old. 2. Based on population of districts in Istanbul. 3. Based on the data since inception; calculated as average of 2019 - 2022 accidents data for employees on Marti
payroll. Major defined as accidents that require absence from work and rest. Minor defined as accidents that require on foot treatment where employee gets back to work the same day 4. As of July 15, 2022. Management team includes department heads and above roles 39Financials
Financial performance and projections summary
Net Revenue Gross Profit2 EBITDA3
($, million) ($, million) ($, million)
59%
57%
125 96 55%
54%
85 44%
71
49% 37%
85
55
47 44%
46 42%
35 32
37% 39%
36% 4%
1%
23 0 1
17 7 9 34%
10 3 (1)
-15 -8%
-4 29% (8%)
1 4 1 4 1 4
2020A 2021A 2022E 2023E 2023FD 2020A 2021A 2022E 2023E 2023FD 2020A 2021A 2022E 2023E 2023FD
Gross Profit Gross Profit Margin EBITDA EBITDA Margin
Source: Marti projected financials. Note: 1. 2023 estimates assume receipt of proceeds from the ~$57.5 million in convertible note PIPE commitments plus assumed incremental PIPE commitments of up to ~$92.5 million to be raised post-announcement 2. Gross profit pre-depreciation. 3.
2022 EBITDA adjusted for c.$17m of proposed De-SPAC related transaction fees. 4. FD refers to Fully Deployed figures that Marti would be expected to achieve in 2023 if only the proceeds from the ~$57.5 million in convertible note PIPE commitments plus assumed incremental PIPE
commitments of up to ~$92.5 million to be raised post-announcement were to be deployed towards purchasing E-Scooters, E-Mopeds and E-Bikes immediately upon receipt. 41Financial performance and projections summary
2020A 2021A 2022E 2023E1 2023FD2
Rides (thousand) 8,331 17,577 26,754 72,767 102,696
Avg. Rides per Vehicle per Day 2.6x 2.7x 2.4x 3.0x 2.9x
Avg. # of Vehicles Deployed 8,814 18,077 30,307 66,876 95,819
Net Revenue (thousand $) 9,665 17,444 23,370 85,413 125,285
YoY Growth (%) 506% 80% 34% 265% NM
Gross Profit (pre-depr) (thousand $) 3,458 7,249 8,719 46,682 71,279
Gross Margin (pre-depr) % 36% 42% 37% 55% 57%
Opex (thousand $) (7,089) (12,139) (17,144)5 (37,926) (52,346)
% of Net Revenue 73% 70% 73% 44% 42%
EBITDA3 (thousand $) (739) 238 835 31,731 54,736
EBITDA Margin (%)3 (8%) 1% 4% 37% 44%
Capex (thousand $) 9,003 31,892 9,5504 86,1874 144,6164
% of Net Revenue 93% 183% 41% 101% 115%
Source: Company information. Note: 1. 2023 estimates assume receipt of proceeds from the ~$57.5 million in convertible note PIPE commitments plus assumed incremental PIPE commitments of up to ~$92.5 million to be raised post-announcement. 2. FD refers to Fully Deployed figures that Marti
would be expected to achieve in 2023 if only the proceeds from the ~$57.5 million in convertible note PIPE commitments plus assumed incremental PIPE commitments of up to ~$92.5 million to be raised post-announcement were to be deployed towards purchasing E-Scooters, E-Mopeds and E-Bikes
immediately upon receipt. 2. 2022E EBITDA adjusted for c.$17m of proposed De-SPAC related transaction fees. 3. Includes down payments made in Dec 2022 for vehicles purchased in 2023. 4. Net of one time transaction fees of $17m. 42Transaction Summary
Detailed transaction overview

                             Key Metrics                                                                                   Sources ($, million)                                                                                         Uses ($, million)

●     Expected pro forma enterprise value of c.$532                                              Cash Held in Trust                                                                146.6                  Cash to Balance Sheet                                                               279.6
      million at closing
                                                                                                 Issuance of Shares                                                                450.0
                                                                                                                                                                                                          Existing Marti Shareholders                                                         450.0
●     Implied pro forma enterprise value of 4.2x
                                                                                                 Convertible Note Proceeds (committed)                                              57.5
      2023FD1 net revenue of $125 million and 9.7x                                                                                                                                                        Fees and Expenses                                                                   17.0
      2023FD1 EBITDA of $55 million                                                              Convertible Note Proceeds (assumed)                                                92.5

●     Marti pre-deal equity holders will initially receive                                       Total Sources                                                                     746.6                  Total Uses                                                                          746.6
      45 million shares (implying 71% of PF non-diluted
      shares outstanding), and will be issued 9 million
      shares at a $20.00 post-close share price
                                                                                                        Pro-Forma Capitalization ($, million)                                                              Pro-Forma Diluted Ownership Breakdown3
●     Under the MIP, Marti management will receive
      incremental shares of 10% of total shares
                                                                                                 Equity Value                                                                      629.7
      outstanding on a four year vesting schedule
                                                                                                 (+) debt2                                                                         158.5
●     Under the LTIP, Marti management will receive
      incremental shares of 2-12% of total shares                                                (-) cash2                                                                        (256.4)
      outstanding triggered by share price milestones                                                                                                                                                                          Target                               Convt             SPAC Sponsor
                                                                                                                                                                                                                               49.8%                                14.4%             Public 12.0%
      between $12.50 - $25.00 per share                                                          Enterprise Value                                                                  531.8                                                                                              23.8%

Source: Marti projected financials. Note: Assumes no redemptions from trust account. 1. FD refers to Fully Deployed figures that Marti would be expected to achieve in 2023 if only the proceeds from the ~$57.5 million in convertible note PIPE commitments plus assumed incremental PIPE
commitments of up to ~$92.5 million to be raised post-announcement were to be deployed towards purchasing E-Scooters, E-Mopeds and E-Bikes immediately upon receipt. There is no guarantee that incremental convertible note PIPE commitments will be raised post-announcement. PIPE
commitments are subject to a $150 million minimum cash condition. 2. As of Dec 2022 (estimated closing). Cash also includes De-SPAC proceeds and Marti’s cash and cash equivalents. 3. Convertible note ownership breakdown assumes a full $150MM PIPE raise                                          44
Appendix
Comparable peers overview

   We are here today…            …and our journey could take us here

                Micro-mobility     Mobility super app

                                                                       46
Financial benchmarking
Micromobility Mobility super apps
Revenue CAGR (‘21A-’23FD1) Peers average: 67% Peers average: 47%
168%
67% 43% 69%
28%
Gross Margin (’23FD1) Peers average: 25% Peers average: 45%
57% 47% 58%
25% 29%
EBITDA Margin (’23FD1) Peers average: 10% Peers average: (4%)
44%
10% 9% 11%
-33%
Source: Marti projected financials, CapitalIQ. CapitalIQ data as of July 25, 2022. 1. FD refers to Fully Deployed figures that Marti would be expected to achieve in 2023 if only the proceeds from the ~$57.5 million in convertible note PIPE commitments plus assumed incremental PIPE
commitments of up to ~$92.5 million to be raised post-announcement were to be deployed towards purchasing E-Scooters, E-Mopeds and E-Bikes immediately upon receipt. Note: Helbiz excluded from micromobility benchmark comparison because the company does not have analyst
coverage and comparable figures in CapitalIQ. 47Operational benchmarking
Funds Raised # of Vehicles Funds Raised De-SPAC Valuation
Company Headquarters Operational Countries
($, million) (thousand) / # of vehicles ($, million)
71 463 1,543 4506 1
1
623 674 9,277 2,4006 28
1 31 8 3,780 3006 3
2
660 1355 3,407 2,0007 16
Peers Average 438 70 5,488
Source: Company information, Investor presentation and Press releases for the peers. Note: 1. Reflect figures prior to de-SPAC transactions for comparability purposes. 2. Reflect figures prior to the acquisition of Spin for comparability purposes. 3. Total funded fleet. 4. Based on Q2 2021 fleet. 5. Reflects
number of vehicles up to the $200m Series D fund raise in Oct-2021. 6. Pre-money valuation in De-SPAC announcements. 7. Based on latest Series D valuation announced on 25-Oct-2021. 48You can also read