2030 Brazil Roadmap Multiplying the Transition: Market-based solutions for catalyzing clean energy investment in emerging economies - Climate ...

Page created by Jeff Contreras
 
CONTINUE READING
2030 Brazil Roadmap Multiplying the Transition: Market-based solutions for catalyzing clean energy investment in emerging economies - Climate ...
2030 Brazil
Roadmap
Multiplying the Transition:
Market-based solutions for catalyzing clean
energy investment in emerging economies
James Ellis
Natalia Castilhos Rypl

October 2021
About
    BloombergNEF is working with the Climate Investment Funds to identify how financial intermediaries can mobilize clean energy investment in
    emerging markets. In the context of post-pandemic sustainable recoveries and the need to meet international climate commitments such as the
    Nationally Determined Contributions (NDCs), accelerating the global energy transition is now more pressing than ever. BNEF sees electrification
    through clean power and transport as the basis of decarbonization, and therefore, as the backbone of the energy transition. With investors’
    appetite for ESG products at an all-time high and capital needs for clean energy investment in many emerging markets often unmet, this project
    looks at how to better match this supply and demand. This slide deck serves to support the dialog with stakeholders on this topic.

    About Climate Investment Funds (CIF)                                          About BloombergNEF (BNEF)
    The Climate Investment Funds (CIF) is one of the world’s largest and          BloombergNEF (BNEF) is a strategic research provider covering
    most ambitious climate finance mechanisms. Founded in 2008, it                global commodity markets and the disruptive technologies driving
    represents one of the first global efforts to invest in a dedicated climate   the transition to a low-carbon economy. Our expert coverage
    finance vehicle. The CIF emerged from recognition by world leaders            assesses pathways for the power, transport, industry, buildings
    that climate change and development are inextricably intertwined. The         and agriculture sectors to adapt to the energy transition. We help
    CIF’s creation also recognized a need to fill a gap in the international      commodity trading, corporate strategy, finance and policy
    climate finance architecture—to deliver climate-smart investment at           professionals navigate change and generate opportunities.
    scale. The CIF supports developing and emerging economies in shifting
    to low carbon and climate resilient development.

1
BNEF Take: Emerging markets and the
energy transition                                                     ●
                       Despite reaching a record-high in 2020, at $501 billion, global energy transition
Global energy transition investment                                       investment has become even more concentrated in high income countries as a
                                                                          result of the Covid-19 pandemic. Emerging markets are, however, key to
    $ billion                                                             achieving the global energy transition, as they will produce the bulk of global
                                                                          emissions until 2050. In the context of delivering sustainable post-pandemic
 600                                                                      recoveries, accelerating economy-wide decarbonization is therefore more
                                                               501        important than ever to keep global temperatures well below 2°C to deliver on the
                                                      459                 goals set under the Paris Agreement.
                                              434 441
                                        378                           ● BNEF sees electrification through clean power as the basis of decarbonization,
 400                              330                          159        and therefore, as the backbone of the energy transition. The power sector is a
          290              297                           180
                 263 240                                                  major contributor to overall emissions, with coal still the largest source of
                                              213 177
           57                           161                               generation. Clean power generation technologies are the most readily available,
 200             78        104 137                                        scalable decarbonization solutions. To enable zero-carbon electrification of
                      78
                                                               294        further sectors, renewable energy capacity needs to be expanded through utility-
          213 168                     212 238                             scale projects and distributed assets.
                  143 164 164 181 185
      0                                                               ● At $307 billion in 2020, investment volumes in renewable energy and storage
                                                                          are, however, far from the necessary levels to achieve this: BNEF estimates that
          2011             2014               2017             2020
                                                                          expanding and decarbonizing the power system to stay on track for warming of
            High income                   Upper middle income             as much as 1.75 degrees Celsius would require over $2 trillion globally in power
            Lower middle income           Low income                      generation assets and batteries per year until 2050. There is therefore an urgent
            Other/undisclosed                                             need to mobilize and accelerate clean power investment, particularly in
                                                                          emerging markets.
Source: BloombergNEF. Note: Numbers include renewable energy, electrified transport, electrified heat, energy storage, carbon capture and storage and hydrogen.

2
Project overview
● Focus: Scaling up clean energy investment through financial intermediaries in emerging markets
    – Global energy transition investment and sustainable debt issuance reached a record high in 2020, but flows continue to
      be concentrated in the world’s wealthiest countries and a select group of trail-blazing emerging markets.
    – The 2020s are the decade where lessons learned need to be replicated and scaled across emerging markets to ensure
      that their economies can grow sustainably, and help meet the objectives of the Paris Agreement.
    – Through fund-deployment and fund-raising activities, financial intermediation has an important role to play in activating
      more players in the investment chain, mobilizing more capital and ensuring more liquidity for the energy transition.

● The “Roadmaps”: Exploring country-level clean energy finance to 2030
    – Focus: The short- to mid-term opportunities for intermediation in mobilizing clean energy investment in emerging
      markets in order to fulfil the commitments of the Paris Agreement.
    – Countries: India, Indonesia, South Africa, Morocco and Brazil.

● Final report - structure:
    – Part 1: “Looking back”: The evolution of financial intermediation in delivering clean energy investment.
    – Part 2: “Present situation”: Current opportunities and constraints to mobilizing investment through intermediaries.
    – Part 3: “Looking forward”: The further potential of leveraging intermediaries to accelerate clean energy investment.

3
Brazil: Key references and background
reading
• Ministry of Mines and Energy, Empresa de Pesquisa Energetica (EPE) National Energy Plan (PNE) 2050
• Ministry of Mines and Energy, Empresa de Pesquisa Energetica (EPE) Ten-Year Energy Expansion Plan (PDE 2030)
• Brazil Intended Nationally Determined Contribution (INDC) 2015
• Empresa de Pesquisa Energetica (EPE) 2020 Analysis of Biofuels (Análise de Conjuntura dos Biocombustíveis 2020)
• Ministry of Mines and Energy, RenovaBio national biofuels policy (2020)

4
Contents

State of the energy transition                                  6
Electrified transport in Brazil                                 15
Financial ecosystem, capacity and financing needs               41
Leveraging intermediaries to accelerate the energy transition   51

5
State of the energy
transition
Brazil

6
State of the energy transition

Brazil to resume steady economic and
population growth
GDP                                Population            Comments
 $tn (real 2019))                  million               ● With a large and diversified
3.0                                250                      economy, Brazil’s GDP was the
                                                            twelfth largest globally in 2020.
2.5
                                   200                   ● The pandemic pushed Brazil into a
                                                            recession in 2020, with GDP
2.0
                                                            shrinking by 4.1%.
                                   150

1.5
                                                         ● The plunge followed years of
                                                            middling economic performance
                                   100
                                                            with the economy having expanded
1.0
                                                            just 1.5% per year from 2017-19.
                                    50
0.5                                                      ● A gradual return to economic
                                                            growth and steady population
0.0                                  0                      growth underpins a long-term
                                                            forecast for rising electricity
                                                            demand.
Source: BloombergNEF, IMF, OECD.   Source: World Bank.   Source: BNEF New Energy Outlook 2020.

7
State of the energy transition

Electricity demand to climb, buoyed by
air conditioning and new sources
Brazil electricity demand by source
                                                                                       ● After a fall in final electricity demand in 2020, a return to
 TWh                                                                                      economic growth underpins a rising long-term forecast for
                                                                                          electricity demand.
800
                                                                  699TWh               ● Long-term growth in demand should average over 1% annually,
700                                                                                       lifting 2019 demand of 534 terawatt-hours (TWh) by more than
                                                                                 11%
600                                                                                       30% by 2050, to around 700TWh.
                   534TWh
500
                                                                                 21% ● Air conditioning (AC) is a key driver. Demand associated with
                                                                                          AC in Brazil is expected to expand 4% annually to 2050. AC
400                                                                                       nearly triples as a proportion of the country’s electricity
                                                                                 67%      demand, rising to account for 21% of the total by 2050,
300                                                                                       compared with a global average 12.8%.
200                                                                                    ● AC is generally well-correlated with output from solar PV in the
                                                                                          region. In warmer climates, such as Brazil, peak demand is
100                                                                                       expected to shift to the middle of the day
    0                                                                                  ● Longer term, new sources of demand, primarily electric vehicles
     2012            2020        2025     2030     2035    2040   2045     2050           (EVs) further support electricity consumption. Demand
         General demand                 Air conditioning     Electric vehicles            associated with EVs rises from negligible levels today to
Source: BloombergNEF. Note: Demand is final consumption.                                  account for as much as 11% of total consumption in 2050.

8
State of the energy transition

Brazil’s targets imply significant growth
in renewable energy
Renewable energy targets                                                         Installed clean power capacity outlook
                                                                                 GW
    Entity                       Target               Comments
                                                                                 450                                                418
    National Energy              Renewable energy     Scenario shown implies                                                         13
                                                                                 400
    Plan (PNE) 2050,             target of 45% of     restriction on expansion
    Ministry of Mines            primary energy       of hydro in protected      350
    and Energy,                  demand by 2030       areas, producing                                                              152           304
                                                      growth in non-hydro        300                                                              16
    Empresa de
    Pesquisa                                          renewables in addition     250                                                              54
    Energetica (EPE)                                  to thermal sources.                                212
                                                                                                                     195            75             37
                                                                                 200                      13
                                                                                           151                        16
                                                                                                          53          34
    Nationally                   See above, and       See above                  150        14                                      50             84
                                                                                                          14          10
    Determined                   also expand non-                                           17                        22
    Contribution                 hydro renewables                                100
                                 to 28-33% by 2030.                                        110           126         113            128           113
                                                                                  50
    BNEF Outlook                 81GW of              Least-cost outlook           0
                                 renewables (ex-      shows lower capacity                2020        PNE 2030    NEO 2030    PNE 2050         NEO 2050
                                 hydro) by 2030 and   than PNE, tied to
                                 190GW by 2050        differing demand                 Hydro     Small-scale PV   Solar PV   Wind         Biomass & waste
                                                      projections.
Note: PNE 2050 Scenario “Exceto UC e TI” Source: BloombergNEF.                   Source: BloombergNEF

9
State of the energy transition

Brazil continues to focus on biofuels in
its emission reduction priorities
Emissions by sector                                                                                                                        Emissions policy
                                                                                                                                       ●    In 2015, Brazil submitted one of the most ambitious NDC targets among
                                                                                             Agriculture                                    emerging markets. But it has yet to move to a net-zero approach. Due
  70%
                                                                                                                                            to the significant role of hydropower, the power sector accounts for only
                                                                                             Building                                       ~7% of emissions, around half that of the transport sector (14%).
  60%                                                                                                                                       Transport emissions have risen steadily and are the third largest source
                                                                                             Bunker Fuels                                   after ‘land use, land-use change, and forestry’ (LULUCF) (24%) and
  50%                                                                                                                                       agriculture (36%).
                                                                                             Electricity/Heat
                                                                                                                                       ●    Brazil’s NDC includes increasing the share of sustainable biofuels in the
  40%                                                                                        Fugitive Emissions                             energy mix to 18% by 2030, expanding biofuel consumption, increasing
                                                                                                                                            ethanol supply, and raising the share of advanced biofuels and
                                                                                             Industrial Processes                           biodiesel in the mix.
  30%
                                                                                                                                       ●    RenovaBio, Brazil’s national biofuel policy, came into force in 2020. It
                                                                                             Land-Use Change and                            establishes annual decarbonization targets for fossil fuel suppliers,
  20%                                                                                        Forestry                                       targeting a 10% reduction in carbon emissions by 2028. It classifies
                                                                                             Manufacturing/Construction                     biofuels by their greenhouse gas emissions profiles, and introduces a
                                                                                                                                            carbon credit system. The tradeable carbon credits (Cbios) represent
  10%                                                                                        Other Fuel Combustion                          the equivalent of a one metric ton reduction of CO2 versus fossil fuel
                                                                                                                                            emissions, and create a cost advantage for biofuels over fossil fuels.
                                                                                             Transportation
     0%                                                                                                                                ●    As major markets embrace net-zero goals, a focus on cutting emissions
                                                                                             Waste                                          via biofuels won’t be sufficient. Some studies suggest that wholesale
                                                                                                                                            conversion of car and urban bus fleets to 100% biofuels results in
Source: BloombergNEF Emissions Tracker; “Life-Cycle Assessment of Brazilian Transport Biofuel and Electrification Pathways” Glensor,        similar or higher transport emissions than a business as usual (BAU)
Muñoz 2019.
                                                                                                                                            scenario due to land-use change emissions.

10
State of the energy transition

Brazil's power mix is relatively clean today
Installed capacity                             Power generation mix                     Comments
 GW                                            TWh                                      ● Brazil's power mix today is
200                                            700
                                                                                          relatively clean. Heavy reliance on
180
                                               600                                        hydropower, which accounts for
160                                                                                       nearly two-thirds of capacity,
140                                            500
                                                                                          means overall renewable energy
120                                                                                       stands at 82% of generation,
                                               400
100                                                                                       including large hydro.
 80                                            300
                                                                                        ● Excluding large hydro, renewables
 60                                            200
                                                                                          account for 23% of generation
 40
                                               100                                        capacity.
 20
   0                                             0                                      ● The country‘s clean power matrix
                                                                                          has positive implications for
                                                                                          electrifying transport.
    Large hydro                  Wind           Gas                   Biomass & Waste
    Oil                          Small Hydro    Small-scale PV        Coal
200
  0 Solar PV                     Nuclear        Other - fossil

Source: BloombergNEF                           Source: BloombergNEF

11
State of the energy transition

…and it is poised to become one of the
cleanest major power markets worldwide
  TWh                                                                        TWh
  900                                                      Other             100%              1%
                                                           Small-scale PV
                                                                                               1%                             15%
  800                                                                         90%              9%
                                                           Utility-scale PV                                                   7%
  700                                                                         80%
                                                           Offshore wind
  600                                                                         70%
                                                           Onshore wind                                                       27%
  500                                                                         60%
                                                           Biomass
                                                           Hydro              50%
  400
                                                           Nuclear            40%
  300
                                                           Oil                30%
  200                                                                                          63%                            42%
                                                           Peaker gas         20%
  100                                                      Combined-cycle gas 10%              10%                            3%
     0                                                     Coal                0%
      2012          2020 2025 2030 2035 2040 2045 2050                            2012      2020 2025 2030 2035 2040 2045 2050
 ● Renewable energy – and wind and solar in particular – is poised to continue to grow in importance on Brazil’s grid. Renewables
      represent over 60% of the 11GW of generation capacity under construction. According to BNEF’s least-cost outlook, swiftly rising
      renewables generation will sharply lower the country’s reliance on thermal generation from the early 2020s.
 ● Gas, oil, and coal are projected to fall from 13% of generation today to 4% in 2050. Renewables grow to comprise 93% in 2050.
      Brazil’s power generation is 95% zero-carbon by that year, making it one of the cleanest major markets in the world .
Source: BloombergNEF

12
State of the energy transition

Brazil power sector emissions are
expected to drop (from already low levels)
Power sector CO2 emissions                                                          ● The power sector today accounts for a small
  MtCO2                                                                                share of Brazil’s overall CO2 emissions, and
                                                                                       further reductions are expected as
 100                                                                                   renewables generation rises and fossil
     90                                                                                generation falls.
     80                                                                             ● According to BNEF’s least-cost outlook,
                                                                                       power sector emissions sink from 51MtCO2e
     70
                                                                                       in 2019 to 19MtCO2e by 2050 – a more than
     60                                                                                60% reduction from today’s level.
                                                                             Oil
     50                                                                             ● Oil gets pushed from Brazil’s generation mix
                                                                             Gas
     40                                                                                by the mid-2020s, taking an important
                                                                             Coal      source of emissions with it. Emissions from
     30                                                                                burning coal drop by a third by 2030.
     20                                                                             ● As the role of natural gas in Brazil’s grid
     10                                                                                shifts from baseload to providing back-up
                                                                                       and meeting peak demand, its emissions
      0                                                                                retreat to one fifth of current levels by 2030,
       2012              2020    2025   2030    2035    2040   2045   2050             before steadily rising again to nearly half
Source: BloombergNEF, World Resources Institute (WRI)                                  current levels.

13
State of the energy transition

Brazil’s grid emissions intensity to
decrease even further
Carbon intensity of electricity, by region                                                  ● Due to the significant role hydropower
gCO2/kWh
                                                                                              plays, the carbon intensity of Brazil’s
 900
                                                                                              electricity is already among the lowest of
 800                                                                       Europe
                                                                                              any major market.

 700                                                                       META
                                                                                            ● As the share of zero-carbon generation
                                                                                              increases from 85% today to 96% in
 600                                                                       U.S.               2040, Brazil’s grid emissions intensity is
 500                                                                       Other Americas     set to decrease from 81g of CO2 per
                                                                                              kilowatt-hour to 24gCO2/kWh across the
                                                                           China
 400                                                                                          same time period.
                                                                           India
 300                                                                                        ● Annual emissions from EV use will
                                                                           Other APAC         decrease as renewable energy
 200
                                                                                              generation rises. EVs will charge (and
                                                                           Rest of World
 100                                                                                          eventually be manufactured) with clean
                                                                           Brazil             power, lowering their lifecycle CO2
     0                                                                                        emissions and leading to a growing
         2012          2020      2025   2030   2035   2040   2045   2050
                                                                                              emissions gap with internal combustion
Source: BloombergNEF                                                                          engine (ICE) vehicles.
14
Electrified transport in
Brazil

15
Electrified transport in Brazil

Globally, EVs are booming, but not yet
everywhere
Global passenger EV sales outlook by                                                 Comments
market                                                                               ● There are now 12 million passenger EVs globally, up
  Million                                                                              from just 1 million in 2015. This means that EVs
  3.5                                                                                  accounts for 1% of all cars on the road, a significant
                                                          3.1                          milestone.
  3.0
                                                                     Rest of World
                                                                                     ● However, progress is not evenly distributed. Nearly all
  2.5                                                                                  EVs (96%) are found in just three major automotive
                                                2.1                  Canada            markets: over 44% of all EVs are in China, about 35%
                                         2.0
  2.0                                                                                  are in Europe and North America is home to 17%. The
                                                                     U.S.              remaining 4% are spread across numerous other
  1.5
                                  1.1
                                                                                       markets.
  1.0                                                                Europe          ● Sales of new EVs present a similar picture. Together,
                       0.7
            0.5                                                                        China, Europe and North America accounted for 94%
  0.5                                                                China             of the 3.1 million passenger EVs sold in 2020, while
                                                                                       many other markets are in their infancy.
  0.0
            2015      2016        2017   2018   2019     2020

Source: BloombergNEF Long-Term Electric Vehicle Outlook 2021 (EVO)

16
Electrified transport in Brazil

There remains a huge gap in the rest of
the world for electrifying transport
Global passenger vehicle sales, 2020                                    Comments
   Million
                                                                        ● The rest of the world (everywhere outside of China,
                    72.8                           72.8
                                                               0.01       Europe and North America) accounts for just 6% of
                                                                  1.0     new EV sales, or some 172,000 vehicles. Latin
                     19
     1.7
                                                                  2.1     America’s share of global EV sales in 2020 was
     2.4                                                                  0.36%.
     3.8             14
                                                   69.7                 ● However, while small in terms of EVs, the rest of
                     20                                                   the world accounts for over a third of total
                     12                                                   passenger vehicle sales, or some 27 million
                                                                          vehicles, nearly all of which are internal
                 By region                     By drivetrain
                                                                          combustion engine (ICE) vehicles.
                                            Internal combustion
      Europe              China                                         ● Therefore, the pace of global EV adoption will
                                            Battery-electric              greatly affect the pace of global decarbonization.
      U.S.                Japan
                                            Plug-in hybrid
      India               S. Korea
                                            Fuel-cell
      Other

Source: BloombergNEF Long-Term Electric Vehicle Outlook 2021 (EVO)

17
Electrified transport in Brazil

Most EV markets (not just emerging
ones) are in their infancy
2020 EV share of passenger vehicle sales                                              Comments
     Germany                                                                  14.0%   ● While most emerging markets are only beginning to adopt
       France                                                     11.5%
                                                                                        EVs, both Australia and Japan lag their developed-market
          U.K.                                                 10.8%
        China                                 6.0%                                      peers with under 1% of new sales.
       Global                          4.3%                                           ● The average across the top five markets in Latin America
          Italy                        4.2%                                             is 0.68%. Costa Rica is the only country in the region to
  South Korea                       3.5%
      Canada
                                                                                        have introduced strong incentives.
                                    3.5%
          U.S.                  2.4%                                                  ● Emerging markets are price-sensitive, and ICE vehicles
   Costa Rica                 1.9%
                                                       1
                                                                                        remain the lowest-cost option. Policy support is, in
     Australia            0.8%                       Char
                                                    G… 4
                                                       1
                                                       0        EMEA                    general, limited. Fuel subsidies and, in some markets, the
                                                       6
                                                        .4 t
        Japan            0.8%                        U….4
Southeast Asia           0.7%                            0
                                                         5
                                                         .0
                                                          8
                                                                                        presence of alternatives like ethanol and natural gas
                                                    G…Title
                                                          3
                                                          .3
     Colombia          0.4%                                %
                                                           .2                           vehicles, present further hurdles.
                                                     S…     .%  APAC
                                                             5
                                                             0
       Mexico          0.4%
                                                     U…
                                                             %
                                                             .0
                                                              5
                                                              %
                                                                                      ● The scale being driven by today's leading markets will
                                                  A 0         .
                                                              4
        Brazil         0.4%                                   .%
                                                  M J…         8
                                                               .%                       push down battery and infrastructure costs for emerging
         India        0.2%                                      8
                                                                %
                                                  E…I…          7
                                                                2
                                                                %                       markets, reducing required investment and bringing
         Chile        0.1%                                      AMER
                                                                %
                                                      0                                 forward price parity with ICE vehicles.
Source: BloombergNEF. Note: Includes battery electrics and plug-in hybrids.

18
Electrified transport in Brazil

EV sales in Latin America remain small,
but growth is strong
Latin America annual EV sales                              Latin America passenger                             Comments
                                                           vehicle sales YoY change by
 14,000                                                                                                      ● EV sales in Latin America remain tiny,
                                                           drivetrain                                          but sales growth of around 70% per year
 12,000                                                    100%
                                                  10,769
                                                                                                               since 2016 has outstripped that of ICE
                                                                             75%                               vehicles.
                                          +65%             75%    70%
 10,000                                                                                  62%        65%
                                                                                                             ● Global passenger EV sales rose 48% in
   8,000                                                   50%                                                 2020, even as total passenger vehicle
                                          6,519                                                                sales fell 13%. This trend was mirrored in
   6,000
                                  +62%                     25%                                                 Latin America, which saw a 65%
                                                                                   14%
                                                                        7%                                     increase in EV sales alongside a 29%
                                  4,013                                                        1%
   4,000                +75%                                0%                                                 decline in total passenger vehicle sales.
               +70% 2,296                                                                                    ● With meaningful policy support absent in
   2,000      1,352                                        -25%                                                much of the region, gains to date are
                                                                                                      -29%     almost entirely driven by fundamentals:
        0                                                  -50%                                                improvements in cost and technology,
              2016      2017      2018    2019     2020            2017       2018         2019      2020
                                                                                                               compelling new models and growing
                                                                              EVs        ICEs
                                                                                                               commitment from automakers and
Source: BloombergNEF. Note: EVs include battery-electric and plug-in hybrid electric vehicles.                 consumers alike.
19
Electrified transport in Brazil

Brazil leads the region in EV sales, but
market concentrated in luxury models
Latin America annual EV sales, by country                                     Comments
14,000
                                                                              ● Brazil is the leader in Latin America for EV sales, with 5,894
                                                                                sold in 2020, a position it only assumed in 2019. Growth has
                                                                                been driven by rising plug-in hybrid electric vehicle (PHEV)
12,000
                                                     10,769                     sales, concentrated in luxury brands such as Volvo, BMW and
                                                                Rest of
                                                                LatAm
                                                                                Porsche. Luxury vehicles accounted for 89% of Brazil’s EV
10,000                                                200
                                                      716
                                                                                sales in 2020.
                                                                Chile
                                                      828                     ● We expect Brazil to continue to lead in the next five years due
  8,000
                                            6,519    2,266      Costa Rica      to the size of its market and continued growth in luxury PHEV
                                            706                                 sales, even as adoption remains low as a share of new
  6,000
                                            302                 Colombia        passenger vehicle sales (0.36% in 2020). Competition from
                                            517
                                    4,013   957                                 ethanol, import taxes and flex-fuel vehicle (FFV) incentives
  4,000
                                                                Mexico          will hinder growth of battery electric vehicles (BEVs).
                            2,296           1,644    5,894
                                    511
  2,000       1,352                                                           ● Mexico, Colombia and Costa Rica are expected to remain
                                    1,785                       Brazil
                            1,205           2,393                               regionally important markets in the next five to 10 years.
               775                  675                                         Incremental improvements to the policy environment,
       0
              2016          2017    2018    2019     2020                       improving economics, new models and better availability of
Source: BloombergNEF. Note: “Rest of LatAm” includes Argentina, Dom Rep,        charging will support growing sales across the region, even in
Ecuador, Panama, Peru and Uruguay. EVs include battery-electric and plug-in     the absence of bold policy support.
hybrid electric vehicles.

20
Electrified transport in Brazil

Plug-in hybrids lead in Latin America
Latin America annual EV sales, by type                                      Comments
14,000
                                                                              ● PHEVs are popular in Latin America, in contrast to much of the rest
                                                                                 of the world where BEVs are displacing them. Availability of charging
12,000                                                                           infrastructure is likely the key factor and this is particularly true in
                                                          10,769
                                                                                 Brazil, where PHEVs were 86% of EV sales in 2020.
10,000                                                                        ● PHEVs are an important part of automakers’ CO2 compliance
                                                           3,252                 strategies in Europe, but we expect them to fade quickly after this
  8,000                                                                          decade as battery prices continue to fall and automakers shift their
                                               6,519                             efforts towards dedicated BEV platforms. In China and North
                                                                    BEV          America, most upcoming EV model launches are BEVs and
  6,000
                                                                    PHEV         automakers show limited interest in PHEVs.
                                               2,763
                                     4,013                                    ● In BNEF’s Electric Vehicle Outlook 2021 (EVO), PHEV sales cease
  4,000                                                    7,517
                                     1,370
                                                                                 by 2035. Nevertheless, in some markets, such as Japan, they remain
                             2,296                                               a part of the mix for longer due to the priorities of Japanese
  2,000        1,352          791              3,756                             automakers like Toyota and Honda. The same could occur in other
                598                  2,643                                       markets. For example, automakers in Brazil such as VW, Toyota and
                             1,505
       0
                754                                                              Nissan are taking steps to develop ‘flex-fuel engine EVs’ for the local
               2016           2017   2018      2019        2020                  market, or PHEVs that run on a combination of ethanol and petrol.

  Snapshot: The waning role of plug-in hybrids. Unlike BEVs, there is no route for PHEVs to ever become cheaper on an up-front basis than traditional ICEs.
  Over the last year, several studies have found that PHEVs are charged very infrequently. This means their CO2 reduction benefits may be overstated and that
  their regulatory treatment may change, which could further reduce their appeal to automakers and consumers.

Source: BloombergNEF

21
Electrified transport in Brazil

Electrification is inevitable
Global passenger vehicle sales outlook by                                               Comments
drivetrain                                                                             ● Long-term technological, economic and policy trends are at the
 Million                                                                                 core of the transition in mobility that will see significant changes to
 100                                                                                     the sector over the next 20 years.
  90                                                                Internal           ● In our outlook (EVO), global passenger EV sales continue to rise
  80
                                                                    combustion           quickly as battery prices fall, and sales of ICE vehicles peaked in
                                                                                         2017. Unsubsidized price parity between EVs and ICE vehicles is
  70                                                                Hybrid
                                                                                         achieved in most segments and countries by the late 2020s, and
  60                                                                                     some reach this point much sooner.
  50                                                                Fuel cell          ● EV sales rise from 3.1 million in 2020 to 13.7 million in 2025 (16%
  40                                                                                     of sales), 32 million in 2030 (34% of sales) and 66 million in 2040
  30                                                                Plug-in hybrid       (68% of sales). The global fleet of passenger Evs grows from 10
                                                                                         million on the road at the end of 2020 to 169 million in 2030 (12%
  20                                                                                     of the fleet) and 619 million by 2040 (40% of the fleet).
                                                                    Battery electric
  10
                                                                                       ● However, EVs will take longer to spread in emerging markets.
     0                                                                                   Sales are forecasted to grow rapidly in the 2030s as the
         2015     2020        2025    2030      2035       2040                          economics improve in these price-sensitive markets, but different
Source: BNEF Long-Term Electric Vehicle Outlook 2021 (EVO). Note: EVs                    start times for the steep part of the s-curve in different countries
include battery-electric and plug-in hybrid electric vehicles. Battery-electric          draws out the global adoption curve.
vehicles represent 88% of total electric vehicle sales in 2030.

22
Electrified transport in Brazil

Electrification is inevitable
Lithium-ion battery price survey results: volume-weighted average                                  Comments
Real 2020 $/kWh
                                                          89%                                       ● Battery prices are nearing levels
      1,191                                                                                            where the upfront costs of EVs can
                                                                                                       start to be competitive with ICE
                                                                                                       vehicles without subsidies.
                    924
                                                                                                    ● Battery prices fell again in 2020,
                                                                                                       dropping 13% year-over-year to
                                  726
                                         668                                                           $137/kWh, due to growing order sizes
                                                592                                                    from manufacturers, higher BEV sales
                                                                                                       and the introduction of new cell and
                                                       384                                             pack designs.
                                                                295
                                                                       221                          ● In 2020, the cheapest packs delivered
                                                                              181    157               on a volume-weighted average basis
                                                                                            137
                                                                                                       were in China, coming in at $111/kWh,
                                                                                                       a 13% fall on the average price in
       2010        2011           2012   2013   2014   2015     2016   2017   2018   2019   2020       2019.

Snapshot: Falling lithium-ion battery prices. This trend is the most important factor in our EV adoption outlook. Pack prices have declined 89%
since 2010, while annual battery demand has increased more than 264 times over the same period. This relationship between price and volume is
crucial. From observed historical values, we estimate that the learning rate is ~18%, or for every doubling of cumulative volume, we see an 18%
reduction
Source:    in price.
        BNEF

23
Electrified transport in Brazil

Electrification is inevitable
Lithium-ion battery demand outlook                                                               Comments
GWh/year
5,000                                                                                            ● Demand for lithium-ion batteries in
                                                                                                   passenger EVs was 133 gigawatt-
4,500                                                                  E-buses                     hours (GWh) in 2020, up from
4,000                                                                                              79GWh in 2019. BEVs accounted
3,500
                                                                       Consumer electronics        for 89% of total passenger EV
                                                                                                   battery demand in 2020.
3,000
                                                                       Stationary storage
                                                                                                 ● Annual lithium-battery demand
2,500
                                                                                                   grows rapidly in our outlook (EVO).
2,000                                                                  Electric two-and three-     By 2030, annual demand for
                                                                       wheelers
1,500                                                                                              lithium-ion batteries passes
                                                                       Commercial EVs              2.7TWh per year. Passenger EVs
1,000
                                                                                                   account for 72% of the market
  500                                                                  Passenger EVs               compared to 11% for the next
      0                                                                                            largest sector, commercial
                                                                                                   vehicles.
                                                                                                 ● By 2035, battery demand
                                                                                                   approaches 4.5TWh.
Source: BNEF, Bloomberg, ACEA, China Automotive Information Network.

24
Electrified transport in Brazil

Electrification is inevitable
Lithium-ion battery-pack price outlook                                                     Log-log battery pack price outlook
      2020 $/kWh                                                                           2020 $/kWh
      1,200
                                                                                           10,000

      1,000
                                                        Observed
                                                        prices                                           2010 2011
        800             2024
                                                                                            1,000                    20122013
                        implied price   2030 implied
                                                                                                                             2014
                        $92/kWh         price $58/kWh
                                                                                                                              2015
                                                                                                                               2016
        600                                                                                                                2017    2020
                                                        18%                                  100                             2018
                                                        learning
        400
                                                        rate

        200                                                                                   10
                                                                                                    10        1,000       100,000   10,000,000
           0
            2010 2015 2020 2025 2030                                                                                  Cumulative production (MWh)

  ● We expect the volume-weighted average price of battery packs to drop below $100/kWh in 2024. Cost reductions will come from
      reduced cell and pack material costs, improvements in energy density that lower capital and operating costs, and more efficient
      production processes. The introduction of new pack designs for pure BEV platforms will further drive down prices.
  ● By 2030, the observed learning rate of 18% suggests average prices will fall as low as $58/kWh. Reaching this requires further
      technological advances. These include the adoption of technologies such as high-voltage cathodes and solid electrolytes, plus
      changing manufacturing processes and the introduction of solid-state cells. By 2035, average pack prices could be as low as $45/kWh.
Source: BNEF. Note: The data in this chart has been adjusted to be in real 2020 dollars.

25
Electrified transport in Brazil

…but everything is local. In Brazil,
biofuels dominate.
Brazil total light vehicle energy demand and                                     Comments
ethanol share of total                                                           ● Brazil’s transport sector highlights how everything is local, even when
 Million m3 gasoline equivalent                                                     enduring global policy and technology trends are at work. EVs will
                                                                                    ultimately tend to be dominant everywhere as automakers have a strong
60                                                                         60%      financial incentive to push electrified models across their entire global
                                                                                    footprint. Given its size, Brazil’s car market will eventually be important for
50                                                                         50%      EV adoption globally. But, local characteristics mean Brazil’s auto market
                                                                                    could diverge from the global market for a long period of time.
40                                                                         40%   ● Specifically, the dominance of biofuels in Brazil is relatively unique. Brazil
                                                                                    is the second largest producer of biofuels after the U.S. Around 85% of all
30                                                                         30%      new light vehicles sold run on a combination of ethanol and petrol (flex-fuel
                                                                                    engines), two-thirds of its light passenger fleet is flex-fuel, standard
                                                                                    gasoline is 27% blended, and ethanol’s share of light vehicle total energy
20                                                                         20%      demand hovers near 50%. Diesel has a mandated 10% biodiesel blend.
                                                                                 ● Additionally, electrification has been hampered to date by a lack of
10                                                                         10%      government commitment, high import taxes and opposition from a large
                                                                                    and powerful biofuels lobby. Among the top 10 auto producers globally,
  0                                                                        0%       Brazil also has a strong domestic auto manufacturing industry that makes
      2010 2011 2012 2013 2014 2015 2016 2017 2018 2019 2020                        FFVs for the national market. Several are pursuing development of ‘flex-
                                                                                    fuel engine EVs’ that would integrate biofuels, a relatively unique path
                   Gasoline        Ethanol           Ethanol %                      globally.
Source: BloombergNEF, EPE Análise de Conjuntura dos Biocombustíveis 2020

26
Electrified transport in Brazil

Brazil EV emissions are half those of flex-
fuel vehicles
Lifecycle CO2 emissions of ICE, FFV and BEV                                                                 Comments
produced in 2020 and used for 250,000 km                                                                    ● Biofuels and electrification are both potential ways to reduce CO2
                                                                                                               emissions from the transport sector. Given their dominance in Brazil,
 Tons CO2                                                                                                      biofuels are likely to stick around in Brazil’s transport mix, where they
 60                                                                                                            can be considered both a path to lower emissions and a barrier to
                                                                                                               electrification. This stems from the fact that FFVs compare favorably
 50                                                                                                            with ICEs in other markets in terms of emissions, but fare much worse in
                                                                                        Use                    comparison with EVs in their home market.
 40
                                                                                                            ● Given the low emissions intensity of Brazil’s grid, EV charging there is
 30                                                                                     Battery pack           much lower emitting than ICE vehicles burning fossil fuels. We estimate
                                                                                        manufacturing          the lifecycle CO2 emissions of a medium-segment BEV produced in
 20                                                                                                            2020 and used for 250,000 km to be between 38-85% lower than those
                                                                                        Vehicle
                                                                                        manufacturing          of equivalent ICE vehicles in the six countries shown here. For Brazil,
 10                                                                                                            the BEV emissions are around half those of an FFV.
                                                                                                            ● There is already a clear advantage present to incentivize EV charging
  0                                                                                                            versus ICE vehicle use from a carbon mitigation perspective. It is
       BEV ICE BEV ICE BEV ICE BEV ICE BEV ICE BEV FFV                                                         unlikely that any molecule-fueled vehicle (gasoline or ethanol, for
          U.K.      Germany France               U.S.        China        Brazil                               example) could compete with EVs in lifecycle emissions with a clean
Source: BloombergNEF, ICCT. Note: FFV is flex-fuel vehicle. The tailpipe emissions of ethanol are
                                                                                                               grid, such as Brazil’s. Further, ethanol’s share of light vehicle energy
considered to be zero gCO2/km as this carbon is considered to have been sequestered in the production          demand was 48% in 2020, meaning that around half of fuel use
phase. Share of ethanol in fuel is 48%. Not considered are land-use change emissions, considered a             remained gasoline.
major contributor to the overall CO2 emissions of biofuel growth scenarios, particularly where additional
land used to grow biofuel feedstocks has high stored carbon.

27
Electrified transport in Brazil

Lifecycle CO2 emissions of ICE and BEV
produced in 2020 and used thereafter
U.S.                                                                    Brazil                                                                   China
 tons CO2                                                                tons CO2                                                                  tons CO2
  30                                                                      12                                                                        40
                                                                         10                                                       Brazil           35
 25
                                                                                                                                  FFV              30
 20                                                                        8
                                                                                                                                  BEV              25
                                                           ICE             6                                                                                                                                 ICE
 15                                                                                                                                                20
                                                           BEV             4                                                                       15                                                        BEV
 10
                                                                           2                                                                       10
   5
                                                                                                                                                    5
                                                                           0
   0                                                                           0    30,000 60,000 90,000 120,000 150,000                            0
       0    20,000   40,000   60,000    80,000 100,000                                                                 km driven                        0       50,000     100,000    150,000     200,000
                                                    km driven                                                                                                                                          km driven

       ● 1.5 years                                                                                      ● 8.4 years                                                           ● 11.6 years
       ● 27,000 km                                                                                      ● 108,000 km                                                          ● 153,000 km
  ● Due to the low emissions intensity of Brazil’s grid, BEVs are cleaner than in most other markets. However, the fact that ICEs are
       also cleaner in Brazil than elsewhere due to their substantial use of ethanol pushes back the point at which a BEV’s lifecycle CO2
       emissions fall below that of an ICE vehicle. In Brazil, this point is reached after 108,000 km of driving, or 8.4 years.
Source: BloombergNEF Note: we assume that cars are driven for some average annual distance (which differs between countries) and adjust the emissions factors to take into account grid decarbonisation; for
Brazil we assume that the raw materials and the battery cells and pack are manufactured in China; for the U.S. and China the materials, cells and pack are manufactured domestically; the battery size of medium
BEV is 71 kWh.

28
Electrified transport in Brazil

Lifecycle CO2 emissions of medium
segment ICE and BEV produced in 2020
U.K.                                                                    Germany                                                                 France
 tons CO2                                                                   tons CO2                                                                  tons CO2
  35                                                                         35                                                                        35
 30                                                                          30                                                                       30
 25                                                                          25                                                                       25
 20                                                                          20                                                                       20
                                                        ICE                                                                        ICE                                                                       ICE
 15                                                                          15                                                                       15
                                                        BEV                                                                        BEV                                                                       BEV
 10                                                                          10                                                                       10
  5                                                                           5                                                                        5
  0                                                                           0                                                                        0
      0     20,000   40,000   60,000   80,000 100,000                             0    20,000   40,000   60,000   80,000 100,000                           0     20,000    40,000   60,000   80,000 100,000
                                                   km driven                                                                  km driven                                                                  km driven

U.S.                                                                    Brazil                                                                  China
 tons CO2                                                                   tons CO2                                                                 tons CO2
  35                                                                         35                                                                       60
 30                                                                          30                                                                       50
                                                                                                                                Brazil
 25                                                                          25                                                 FFV
                                                                                                                                                      40
 20                                                                          20                                                 BEV
                                                       ICE                                                                                            30                                                      ICE
 15                                                                          15
                                                       BEV                                                                                            20                                                      BEV
 10                                                                          10
  5                                                                           5                                                                       10

  0                                                                           0                                                                        0
      0     20,000   40,000   60,000   80,000 100,000                             0    30,000 60,000 90,000 120,000 150,000                                0      50,000      100,000    150,000    200,000
                                                   km driven                                                              km driven                                                                      km driven
Source: BloombergNEF Note: we assume that cars are driven for some average annual distance (which differs between countries) and adjust the emissions factors to take into account grid decarbonization; for
the European countries we assume that the raw materials and the battery cells are manufactured in Germany, while the pack is manufactured in the country where the vehicle is used; for the U.S. and China the
materials, cells and pack are manufactured domestically; for Brazil the materials, cells and pack are manufactured in China; battery size of medium BEV is 71 kWh.

29
Electrified transport in Brazil

Domestic battery manufacturing could
lower emissions even further
Lifecycle CO2 emissions of Brazil FFV and BEV                                                            Comments
produced in 2020 and used for 250,000 km                                                                 ● As passenger EVs are imported in Brazil, the entire battery is also
                                                                                                              imported. With no large-scale plans to manufacture batteries
 Tons CO2                                                                                                     domestically, our estimate of lifecycle CO2 emissions reflects an
 18                                                                                                           assumption that cell and pack manufacturing are done in China.
 16                                                                                                      ● However, producing batteries locally could lower the lifecycle CO2
 14                                                                                                           emissions of a BEV. Given the low carbon intensity of Brazil’s electricity,
                                                                                   Use                        emissions from vehicle manufacturing and use of an EV are relatively
 12
                                                 -55%                                                         minor. Battery pack manufacturing accounts for as much as 70% of the
 10                                                                                                           lifecycle emissions of a BEV imported from China and used in Brazil.
                                                                                   Battery pack
  8                          -11%
                                                                                   manufacturing         ● We estimate that producing batteries locally could lower the overall CO2
  6                                                                                                           emissions of an EV in Brazil by 11%, even if processing and refining of
                                                                                   Vehicle
  4                                                                                                           battery materials happens in China. This would bring the lifecycle CO2
                                                                                   manufacturing
                                                                                                              emissions of a Brazilian BEV down to 7.5 tons of CO2, from 8.4 tons. A
  2
                                                                                                              locally produced BEV would then have lifecycle CO2 emissions 55%
  0                                                                                                           below the 16.7 tons of CO2 generated by a local FFV, underscoring the
        BEV (cells and  BEV (domestic                            FFV                                          importance of developing domestic EV manufacturing capacity and
      pack manufactured    battery                                                                            finding alternative applications for biofuels in Brazil.
           in China)    manufacturing)

Source: BloombergNEF, ICCT. Note: FFV is flex-fuel vehicle. The tailpipe emissions of ethanol are considered to be zero gCO2/km as this carbon is considered to have been sequestered in the production phase.
Share of ethanol in fuel is 48%. Not considered are land-use change emissions, considered a major contributor to the overall CO2 emissions of biofuel growth scenarios, particularly where additional land used to
grow biofuel feedstocks has high stored carbon. Battery manufacturing is for NMC (622) with cell and pack manufactured in Brazil (domestic) and in China.

30
Electrified transport in Brazil

Price parity is a long way off
SUV segment BEV and ICE pre-tax prices and                                          Comments
share of battery cost in Europe                                                 ●   Price parity between EVs and ICEs is the most important factor for mass
                                                                                    market EV adoption. Falling battery prices allow EVs to reach up-front price
 Real 2020 thousand $                                                               parity with comparable ICEs without subsidies. Until EVs reach price parity,
45                                                                                  we expect their adoption to be limited in any given market.
40                                                                              ●   Globally, price parity is reached by the end of the decade in most segments
35                                                                                  and geographies. But there is a wide variation between geographies and
                                                                                    segments. While BEVs in Europe and the U.S. will start achieving price parity
30                                                                                  for some segments as early as 2022, smaller vehicles in India do not hit parity
25                                                                 Battery          until after 2030 due to very low average purchase prices in these segments.

20                                                                              ●   In Brazil’s passenger vehicle market, price parity is likely a long way off. In
                                                                   Powertrain
                                                                                    emerging markets in Asia (India, Southeast Asia), we do not expect EVs to
15                                                                                  achieve upfront price parity with ICE vehicles in mass-market segments until
                                                                   Vehicle
10                                                                                  around 2030.
                                                                   ICE          ●   Brazil could follow a similar trajectory. The most-sold passenger vehicle in the
 5
                                                                                    country today, the Chevrolet Onix, a locally made FFV, retails for R$63,430
 0
                                                                                    ($12,396), while the imported, entry-level all-electric Chevrolet Bolt has a
   2020              2025             2030              2035
                                                                                    price tag of 275,100 Brazilian reals ($53,757), approximately 4.3 times more
                                                                                    expensive.
● Availability of such low-cost ICEs, high import taxes, fossil fuel subsidies and the presence of alternatives like ethanol all ensure parity will not be
   achieved in the next few years. With limited national-level support for EVs in Brazil, automakers are unlikely to direct their new electric models there in
   the next few years. At the same time, domestic manufacturing of EVs, a likely route for automakers to eventually take in Brazil in order to circumvent high
   import taxes, is some years off.
Source: BloombergNEF. Note: USDBRL 5.12 on July 30, 2021.

31
Electrified transport in Brazil

Policy and prices constrain near-term
Rest-of-World adoption
Rest-of-World near-term annual passenger EV                                                              Rest-of-World and Brazil historical near-term
sales by drivetrain                                                                                      EV share of new passenger vehicle sales
Thousand                                                                                                 1.2%
200
                                                                                                         1.0%
160
                                                                                                         0.8%
120                                                                             Plug-in hybrid
                                                                                                         0.6%                                                                                    RoW
                                                                                Battery electric                                                                                                 Brazil
  80                                                                                                     0.4%
  40                                                                                                     0.2%

      0                                                                                                  0.0%
           2015      2017         2019       2021        2023         2025                                        2015        2017         2019        2021        2023         2025
  ●       In our outlook (EVO), markets that fall under our Rest of World (RoW) category – such as Brazil, Mexico, Russia, and Turkey – see some EV adoption, though
          generally much later and smaller than main EV markets. EV sales in RoW countries are forecasted to increase from just under 58,000 in 2020 to nearly 170,000 by
          2025.
  ●       Were Brazil EV sales to follow a similar path, they would grow to 17,200 in 2025, from 5,900 units sold in 2020. However, there are indications that the market is
          growing faster than this, with 1H 2021 sales in Brazil already equaling the 2020 total.
  ●       EVs are set to surpass 1% of all passenger vehicle sales in these countries for the first time in 2025. At 0.4% in 2020, the share of EVs in new passenger vehicle sales
          in Brazil is roughly in line with the RoW average.
Source: BNEF Long-Term Electric Vehicle Outlook. Note: Countries included in RoW include markets in Latin America, Russia, Turkey and SE Asia. EV includes battery-electric and plug-in hybrid electric vehicles.

32
Electrified transport in Brazil

Minimal policy support for EVs
 Policy support for EVs and EV charging infrastructure around the world

Legend                           Details
Group 1               Comprehensive policy support
Group 2                 Moderate policy support
Group 3                  Limited policy support
Group 4                  Minimal policy support
–                     Not included in this database

Source: BloombergNEF Global EV and EV Charging Infrastructure Policy Database

33
Electrified transport in Brazil

Transport policies
  Policy                  Status   Start date   Technologies        Details

  Rota 2030               ⚫ In     2018         EV, hybrid          Approved in late 2018, Rota 2030 provides tax incentives for companies that improve the fuel
                          force                 electric vehicle    efficiency of their light-duty vehicles (an energy efficiency program for heavy-duty vehicles
                                                (HEV), FFV          was postponed until the 2027-2032 cycle). It also aims to foster innovation and local R&D.
                                                                    Under the scheme, the typical tax applied to industrial products and EVs, HEVs and FFVs
                                                                    was lowered by at least 3%. However, the actual tax paid depends on the vehicle’s weight.
                                                                    As a result, EV manufacturers argued taxes on EVs are still higher than for FFVs.

  Import tax              ⚫ In     2015         EV, HEV             On October 2015, import tax rates were lowered from 35% to 0% for BEVs, and set at a
  reduction               force                                     range of 0-7% for HEVs. However, EVs still pay higher IPI (federal excise tax) and ICMS
                                                                    (state sales tax) taxes.

  Annual car              ⚫ In     2018         EV                  In 2018, the IPVA (annual car ownership tax) was set at 4%. EVs are exempt in seven states
  ownership tax           force                                     (Ceará, Maranhão, Pernambuco, Piauí, Rio Grande do Norte, Rio Grande do Sul and
  (IPVA)                                                            Sergipe) and enjoy a reduced rate in Mato Grosso do Sul, Rio de Janeiro and São Paulo.

  Circulation             ⚫ In     2014         EV, HEV, FFV        Since 2014 EVs, HEVs and FFVs are exempt from vehicles’ circulation restrictions in Sao
  Restriction             force                                     Paulo. ICE vehicles are not allowed to enter the city during certain peak hours, depending on
  (Rodizio                                                          the final numbers on their license plates (vehicles with final plate numbers 1 or 2 can not
  vehicular)                                                        enter the city on Mondays, 3 or 4 on Tuesdays etc.).

  BNDES                   ⚫ In     2017         EV, HEV, FFV,       In January 2017, changes in funding lines were announced. As a result, non-polluting buses
                          force                 fuel cell vehicle   (EV, HEV, ethanol, FCV, NG) gained priority in access to BNDES funding from 2018.
                                                (FCV), NG

34
Electrified transport in Brazil

Transport policies

  Policy                  Status   Start date   Technologies          Details

  Sao Paulo               ⚫ In     2021         EV, HEV               Sao Paulo municipal law that enables buyers of EVs and HEVs to offset a
  municipal               force                                       portion of their property taxes (IPTU) with the municipal share of annual car
  discount on                                                         ownership tax (IPVA) paid. The law enables buyers to take advantage of the
  property tax                                                        benefit established by an earlier law in force since 2014. The benefit has a low
  (IPTU)                                                              vehicle price limit of 150,000 Brazilian reals, which must be updated.

                                                                      Law 17,563/2021 reduces bureaucracy in the IPVA discount for EVs
                                                                      established with Law 15.997/2014.
  Sao Paulo               ⚫ In     2018         EV, HEV, FFV, fuel    Sao Paulo municipal law that established a schedule for the conversion of
  municipal bus           force                 cell vehicle (FCV),   diesel buses into low-emission buses. The law sets 10-year and 20-year targets
  fleet emissions                               NG                    for fleetwide reductions in tailpipe CO2 and other emissions of 50% and 100%,
  reduction                                                           respectively. It aims to cut emissions by 95% from 2016 levels by January
  target                                                              2038. Law 16.802/2018. The law was temporarily suspended in 2020.
  Sao Paulo               ⚫ In     2020         Charging              Sao Paulo municipal law that provides for the mandatory provision of a solution
  municipal               force                                       for charging EVs in new residential and commercial buildings (condominiums)
  charging                                                            in Sao Paulo city. Law 17.336/2020.
  infrastructure

35
Electrified transport in Brazil

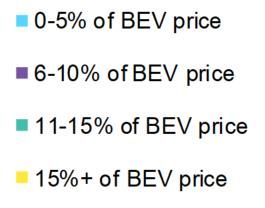
Maximum national direct purchase subsidy available for
passenger BEVs, 2020
     $    Singapore
          Signapore                                                                                                         14,500
             Croatia                                                                                     11,800
           Romania                                                                                  11,100
           Germany                                                                          9,900
              Poland                                                                        9,900
            Slovakia                                                                8,800
            Slovenia                                                             8,300
            Hungary                                                             8,200
              France                                                         7,700
                  U.S.                                                     7,500
        South Korea                                                    6,900
                Malta                                                6,600
                                                                                       Snapshot: Direct purchase incentives. Direct purchase subsidies are
                                                                                                                                   0-5% of BEV price
            Sweden                                                 6,300               considered the most effective tool for Chart  driving Title
                                                                                                                                               early stage adoption of
             Greece                                              6,100                 EVs, as they lower the upfront costs.6-10%     Countries    with direct purchase
                                                                                                                                          of BEV price
        Luxembourg                                           5,500
                                                                                       subsidies  accounted     for over  90%11-…
                                                                                                                                of global  EV   sales  in 2019. In 2020,
               Serbia                                        5,500                                                                 11-15% of BEV price
              Ireland                                        5,500                     direct purchase subsidies for EVs   0-5%…ranged from over $2,100 in India to
              Austria                                        5,500                     $14,700 in Singapore. Many emerging          markets,
                                                                                                                                 0 15%+      5 including
                                                                                                                                         of BEV  price      Latin America
                Spain                                  4,400                           and Southeast Asia, have yet to introduce them.
                  Italy                                4,400
        Netherlands                                    4,400                           However, growing sales of EVs mean that sustaining direct purchase
                  U.K.                              3,900
             Canada                                3,800                               incentives will put an increasing strain on government budgets. As
               Japan                              3,700                                markets mature, they are being phased out and replaced by more
                China                          3,300                                   comprehensive policy tools like fuel efficiency or CO2 requirements (as
            Portugal                           3,300
             Finland                   2,200                                           in the EU) and EV mandates (as in China).
                 India                2,100
Source: BloombergNEF, respective government agencies. Note: Reference EV is the Tesla Model 3. Where unavailable, we used Hyundai Kona or other EV as a reference. Currencies
were calculated using the average exchange rates for 2020

36
Electrified transport in Brazil

Public charging infrastructure is limited
Global cumulative installed public charging                                        Comments
connectors                                                                       ● Globally, there were over 1.36 million public charging connectors at the
 Thousand connectors                                                                end of 2020, a 48% increase from 2019.
1,500                                                                    1,361   ● Public charging infrastructure is very limited in Brazil, with the number
1,250                                                                               of public chargers estimated to be just 754. This translates into 12.9
                                                                          89
                                                                                    EVs per public connector at the end of 2020.
1,000                                                             918    360     ● Globally, there were 7.4 EVs per public connector at the end of 2020.
 750                                                              72                The ratio varies widely across countries, with 5.4 EVs per public
                                                           590                      connector in China and just 3 EVs per connector in the Netherlands.
                                                                  247
 500                                               437                              Norway has the highest ratio of EVs to public chargers, at 25:1.
                                                           60
                                             315           165           810
                                                   49                            ● Differences can be explained by the prevalence of detached houses,
 250                                 183           129            516
                    95        130                                                   and therefore home charging availability, the power of chargers and
           72                                 92           300
                                      68     141   214
     0                                49                                            utilization of infrastructure, which reduces the need for additional
         2012      2013     2014     2015   2016   2017    2018   2019   2020       infrastructure as the electric vehicle fleet grows. In Brazil, as an early
                      China       Europe    U.S.   Japan    RoW
                                                                                    EV market dominated by luxury vehicles far from price parity, most EV
                                                                                    owners likely have installed home charging options, estimated to be
  Snapshot: Public charging. China continues to be the global leader                around 50%.
  on public charging. China’s push for public charging installations is          ● Government-provided financial and legal support for charging
  partly driven by a lack of home and workplace charging options.                   infrastructure deployment has proved critical in many markets. A
  Home and workplace charging dominates in Europe and the U.S.,                     number of governments have announced multi-billion-dollar support
  while in China, the adoption of private infrastructure is lower.                  packages for the sector while also setting charging deployment targets.
Source: BNEF

37
Electrified transport in Brazil

Other segments may be the biggest near-term
opportunity in emerging economies
● Electrification is spreading to other segments of road transport.       Global EV share of new vehicle sales by segment
     There are over 1 million commercial EVs – including buses,           90%
     delivery vans and trucks – and there are over 260 million electric   80%
     mopeds, scooters, motorcycles and three-wheelers on the road         70%
                                                                          60%
     globally. Other segments of transport are already much further       50%
     along on EV adoption. Some 44% of global two- and three-             40%
     wheeler sales and 25% of the existing fleet are already electric.    30%
                                                                          20%
● The bus market continues to electrify quickly. There are almost         10%
     600,000 e-buses on the road globally, representing 39% of new         0%

                                                                                  2020

                                                                                                2040

                                                                                                       2020

                                                                                                                      2040

                                                                                                                                    2030

                                                                                                                                                  2020

                                                                                                                                                                 2040

                                                                                                                                                                                2030
                                                                                         2030

                                                                                                               2030

                                                                                                                             2020

                                                                                                                                           2040

                                                                                                                                                          2030

                                                                                                                                                                         2020

                                                                                                                                                                                       2040
     sales and 16% of the global fleet. While China accounted for the
     vast majority of all e-bus sales in 2020, and continues to account
     for 98% of the global e-bus fleet, other markets around the world           2/3-Wheelers                 Buses          Passenger                   LCVs           MCVs / HCVs
                                                                                                                               cars
     are beginning to scale up the deployment of e-buses.
● Much of this is at the city level. Spurred on by targets in the
                                                                           Snapshot: Long-term EV adoption by segment. Buses and
                                                                           two- and three-wheeled vehicles achieve the highest EV
     2030s and 2040s, big cities and regions are planning to ensure
                                                                           adoption rates globally by 2040 in our outlook (EVO), followed by
     that their fleets make the transition. Over 35 cities have pledged
                                                                           passenger cars, then light commercial vehicles. By 2040, there
     to procure solely e-buses after 2025 as signatories of the C40
                                                                           are over 600 million passenger EVs on the road and over 750
     Cities Fossil-Fuel-Free Streets Declaration, including Rio de         million electric two-and three-wheelers.
     Janeiro, Mexico City, Santiago, Bogota, Medellin and Quito.
                                                                          Source: BNEF Long-Term Electric Vehicle Outlook 2021 (EVO)

38
Electrified transport in Brazil

E-buses: large opportunity, but a long
way to go
Comments                                                                     Brazil municipal bus fleet by powertrain
● In Latin America, e-bus activity shows signs of ramping up. The            180,000
     region’s e-bus fleet in 2020 was nearly 2,000 units. The largest        160,000
     markets are Chile (789) and Colombia (588). It is projected to grow
                                                                             140,000
     to over 11,600 units by 2025 in our outlook (EVO). Key efforts behind
     this include Chile’s call for a 100% electric fleet by 2040 and         120,000
     Colombia’s 2019 Electric Mobility law mandating 30% of all              100,000
     purchases or leases for public transport must be electric through        80,000
     2025.                                                                    60,000
● Brazil hosts e-bus chassis and battery manufacturing capacity, but e-       40,000
     bus orders in Brazil remain negligible to date, even by regional         20,000
     standards. There are around 48 battery e-buses in operation largely
                                                                                   0
     due to municipal pilots in Sao Paulo, Campinas, and Brasilia.
  Snapshot: The economics of e-buses. The economics of e-buses                                       ICE bus fleet   E-bus fleet
  will improve steadily over the next 20 years. By the second half of the
  2020s, e-buses begin to reach upfront cost parity with their diesel        ● Brazil’s municipal bus fleet numbers over 140,000 units and is
  counterparts in some countries, but this takes until the 2030s in many         primarily diesel. Our long-term e-bus adoption forecast suggests
  emerging economies where there are very low-cost diesel options                its e-bus fleet could grow to nearly 10,000 units by 2030, or
  available. E-buses on routes requiring larger battery packs also take          around 6% of the fleet. By 2040, it grows to over 55,000 units, or
  longer to reach parity. The total cost of ownership, however, is               around one third of the fleet.
  competitive within the next 3-5 years in many markets.
                                                                             Source: BNEF Long-Term Electric Vehicle Outlook 2021 (EVO), E-bus Radar

39
Electrified transport in Brazil

Summary: Power sector is clean, transport needs
attention
Opportunities                                                                             Challenges
Clean power sector and expected to get cleaner                                            Domestic auto manufacturing industry
Brazil's power sector is clean, which is favorable for electrifying transport. EVs will   Brazil has a large auto manufacturing industry and FFVs enjoy more incentives than EVs. Limited
charge (and eventually be manufactured) with clean power, lowering lifecycle CO2          support will discourage automakers from focusing on Brazil and high import taxes discourage
emissions and leading to a growing emissions gap with conventional vehicles               consumers from purchasing EVs. With no large-scale plans to manufacture EVs or batteries
(ICEs and FFVs). EV emissions fall further as renewable generation rises.                 domestically, the market will remain dependent on imports, preserving the price gap with ICEs.

Established clean power investment and policy environment                                 Limited policy support for electrification
A pioneer of renewable auctions, Brazil offers an open investment environment             Electrification is hampered by a lack of government commitment. Direct subsidies that lower the
with which domestic and international renewables investors are comfortable and a          upfront costs of EVs are unlikely to be adopted. Policies that target the supply side, such as fuel
diverse financial landscape. It has deep experience in support for new industries.        economy standards, EV mandates, or bans on sales of ICEs may eventually be the preferred
                                                                                          route, but are not under discussion. Policy may continue to support ethanol as an alternative.

Large potential for impact in transport as costs fall                                     Biofuels are deeply entrenched

Emissions from transport are double those from the power sector and are growing.          Biofuels lower emissions but act as a barrier to electrification. While FFVs beat ICEs on
In countries with clean grids, every ICE replaced has a disproportionate impact on        emissions, they compare poorly with EVs. Biofuels are likely to remain in the transport mix for
emissions. Growing scale will push down battery and infrastructure costs for              some time. To preserve a role for them, automakers may pursue development of ‘flex-fuel engine
emerging markets, reducing investment needs and bringing forward price parity             EVs’, a unique path globally. Optimizing the route to net zero could mean electrifying all
with ICEs. Displaced biofuels offer a complementary path for hard-to-abate sectors.       passenger cars and redirecting biofuels to sectors with no other easy decarbonization pathway.

Large, polluting public transport and urban fleets are ripe for disruption                EV market is concentrated in luxury vehicles, price parity is years away
Brazil’s large, diesel bus fleet represents an opportunity for impact, as do urban        Brazil leads the region in EV sales, but growth has been concentrated in luxury vehicles. Price
commercial and passenger fleets. E-buses are a segment that is further along on           parity in the passenger vehicle market is likely a long way off. Public charging network will remain
adoption globally and often led at the city level. Brazil hosts e-bus chassis and         limited as most EV owners are likely to have installed home charging.
battery manufacturing, but lags neighbors Chile and Colombia in adoption.

40
Financial ecosystem,
capacity and financing
needs
Brazil

41
Financial ecosystem, capacity and financing needs

All segments of the investment chain are
activated in Brazil                                          Central banks & financial regulators

                                                                   Asset owners

                                                                        Insurance                  Other               Sovereign                  Pension
                                                                                                                                               Pensio Pensio
                                                                        companies             inst.investors          wealth funds               n funds n
                                                                                                                                               funds funds

                                                                  Delegate              Asset managers
                                                                    assets
                                                                                                                     Passive funds                         Direct ownership,
                                                                                              Active funds
                                                                                                                    (index tracking)                       ownership through shares
                                                                                                                                                           & lending through bonds

                                    Credit rating agencies                                                               Sell shares & bonds
                                                                                        Banks

                                                                             Co-lend            Commercial            Investment                               Exchanges &         Index
                                                                                                  banks                  banks                                    trading        providers
                                            Development
                                                                                                                                                                platforms
                                               finance
                                             institutions                 Lend &                          Lend            Underwrite shares
                                                                          provide risk-sharing tools                      & bonds
                                       Ownership
                                                                      Corporations
                                           Governments
                                                                                Project                      Other                        Listed                      List
                                                                              developers                  corporations                 corporations                shares

                                       Subsidies,                                  Build, own & operate                                                               Public sector
                                       incentives, policies                                                                                                        0.02
                                                                                                                                                                      Private finance
                                       influence investments                                                                                                          0
                                                                                                                                                                      Private non-finance
                                                                                                                                                                                1
                                                                                                    Assets in the real economy

Source: CFLI, BloombergNEF.

42
Financial ecosystem, capacity and financing needs

Brazil‘s financial market is deep, diversified
and mature
Investment chain representation
                                                                              ● The Brazilian financial sector is mature, with all major actors in the
 Entities                     National                International
                                                                                 investment chain activated and active in energy transition
                                                                                 investment. Brazil's domestic development banks have historically
  Asset owners                ⚫ Active                ⚫ Active                   played a dominant role in supplying long-term finance to industry
                                                                                 and infrastructure, including clean power projects.
  Asset managers              ⚫ Active                ⚫ Active                ● Investment opportunities are overwhemingly in the Brazilian real,
                                                                                 potentially exposing international investors to exchange rate risk.
  Banks                       ⚫ Active                ⚫ Active                ● Sustainable debt instruments have grown recently, but there is
                                                                                 plenty of room for expansion. Brazil issued less than half the
  Corporations                ⚫ Active                ⚫ Active                   volume issued by Chile, a much smaller market, in 2020.
                                                                              ● The Brazilian bank association FEBRABAN supports domestic
                                                                                 players in the adoption of recommendations by the Task Force on
 BNEF Take: Intermediation in focus                                              Climate-Related Financial Disclosures (TCFD).
 Brazilian and international markets have historically been able to provide
 most of the energy transition investment required. Brazil‘s domestic         ● Investors are comfortable with established clean power
 development banks, historically BNDES but more recently Banco do                technologies such as solar PV and wind. For less established
 Nordeste, have been the primary sources of long-term funding, but lenders
 such as the IDB, World Bank and KfW have also played an important role.
                                                                                 technologies, such as energy storage, the private sector tends to
                                                                                 be more active in the early stages.
Source: BloombergNEF.

43
You can also read