TZWorks Trace Event Log Analysis (tela) Users Guide
←
→
Page content transcription
If your browser does not render page correctly, please read the page content below

TZWorks® Trace Event Log
 Analysis (tela) Users Guide

                                    Abstract
                                    tela is a command-line tool that parses Windows Trace Log
                                    files into CSV type records. Other capabilities: include
                                    generating statistics on a trace logs, creating a subset trace
                                    log, and enumeration of trace log providers. tela runs on
                                    Windows, Linux and Mac OS-X.

Copyright © TZWorks LLC
www.tzworks.com
Contact Info: info@tzworks.com
Document applies to v0.26 of tela
Updated: May 15, 2022
Table of Contents

1     Introduction .......................................................................................................................................... 2
2     Background Information ....................................................................................................................... 2
    2.1      Using the Event Log Viewer in Windows to view the ETL data..................................................... 3
3     How to Use the tela Tool ...................................................................................................................... 3
    3.1      Quick-look Report for a ETL file .................................................................................................... 4
    3.2      Parsing out ETL records ................................................................................................................. 6
    3.3      Searching for Providers ................................................................................................................. 7
    3.4      Mapping Provider/Event ID to PE Resource Data ......................................................................... 7
    3.5      Using Templates to assist tela ...................................................................................................... 8
4     Available Options .................................................................................................................................. 9
5     Common locations for ETL files ........................................................................................................... 10
6     Authentication and the License File.................................................................................................... 11
7     References .......................................................................................................................................... 11

Copyright © TZWorks LLC                                            May 15, 2022                                                                     Page 1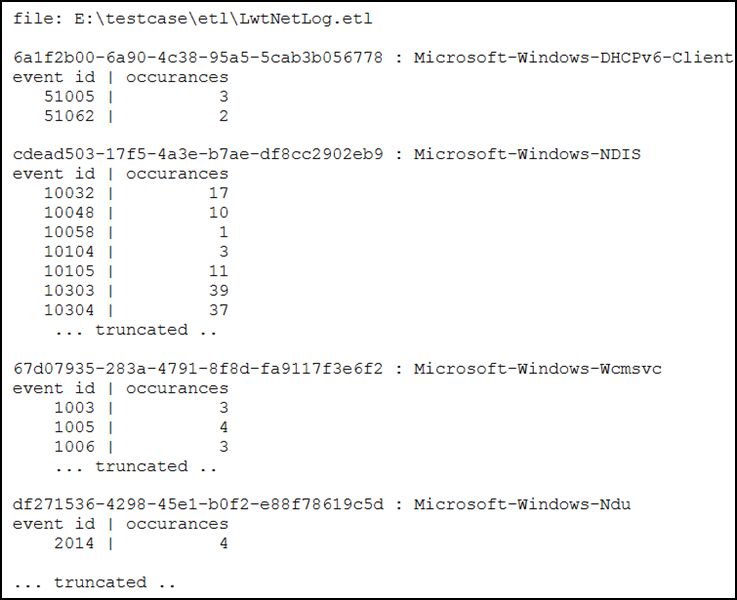
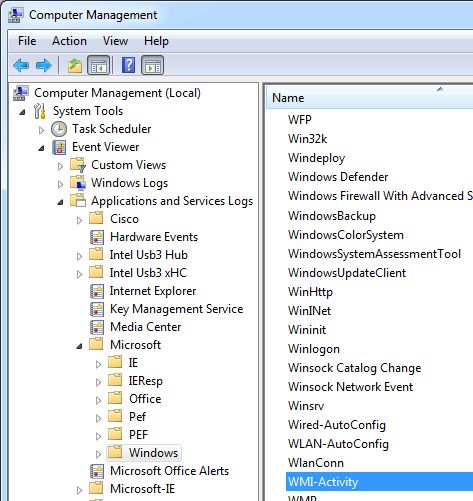
TZWorks® Trace Event Log Analysis
(tela) Users Guide
Copyright © TZWorks LLC
Contact Information: info@tzworks.com

1 Introduction

Event Tracing for Windows or ETW, is a built-in, logging and diagnostic framework available to all. It can
be dynamically enabled and the data it generates can be logged to a file or consumed in real time by
another application. It can be used for performance analysis, general debugging, or in our case, for
forensics purposes.

ETW was first introduced in Window 2000. It started as a modest set of providers and was expanded
with each new version of Windows. With Windows 10, the number of providers grew to over 1000.
Starting with Win10, TraceLogging was added to ETW to allow for event tracing for user-mode
applications and kernel-mode drivers.

2 Background Information

To enable logging in Windows, one can do it a number of ways. An easy way is via the Windows
Computer Management console in the “Applications and Services Logs” of the Event Viewer subsection.
One needs to ensure the “Show Analytic and Debug Logs” is enabled. After that many different apps
and services can have Trace logs enabled. Below is an example of doing it on WMI-Activity.

Copyright © TZWorks LLC                       May 15, 2022                                          Page 2

Once enabled, the system will start populating the Event Trace Log (ETL) file with trace data. The
properties dialog will show where the trace data will be logged and allow one to set other parameters as
well, such as max log size, whether to overwrite older trace data once the max sized is reached,
subscribe to received trace events from another computer, etc.

2.1 Using the Event Log Viewer in Windows to view the ETL data

The Microsoft’s Event Viewer will allow one to view ETL files, with some caveats. On our test system, it
would recognize most, but there were some that it would not. Of the data that was recognized, it was
primarily the header data and not the payload data. To see the details of the payload data in the ETL
there was another tool provided called the Microsoft Message Analyzer. From the online help for the
tool, it “is a new tool for capturing, displaying and analyzing protocol messaging traffic, events and other
system or application messages in network troubleshooting and other diagnostic scenarios… [It] also
enables you to load, aggregate, and analyze data from log and saved trace files.”

These were some of the tools used to design tela, and were a good way to validate the data tela
produced. So our goal was at least to have tela parse the same ETL data that the Microsoft Message
Analyzer did. In all the cases we tested tela was able to parse the header for all the records it
encountered. Keep in mind, our ETL test data is limited. Where tela falls short is parsing the payload
data in the records. More discussion about this is in the section on “Mapping Provider/Event ID to PE
Resource Data”.

3 How to Use the tela Tool

To just parse a single ETL file, one uses the -log option with the argument of the path of the ETL file.
This will generate a single record per line where each field is delimited by a ‘|’ (pipe) character.
Redirecting the output to a file is recommended, since the widths of the records are large. The other

Copyright © TZWorks LLC                       May 15, 2022                                           Page 3
basic option is to enumerate a set of files in a folder and pipe them into tela via standard input. These
options are the first two shown in the menu below.

The next section of includes a number of basic options used to change the formatting of the output or to
filter out files when piping a set of files from standard input. These options are very similar, if not the
same, as other tools in TZWorks.

The last two sections are options used for reversing and/or debugging purposes only, and has been
made available for the analyst to use at their discretion. These options include: (a) gathering statistics
on the ETL file, (b) using an external template file (which is for extensibility and testing purposes), (c)
listing out provider GUIDs in an ETL file, (d) creating a separate ETL file from records extracted from a
specified provider, and (e) using other TZWorks tools to extract pertain data from artifacts to assist in
the analysis of an ETL file.

3.1 Quick-look Report for a ETL file

During the analysis and design tela it was necessary to determine which providers and event ID's were
present in a specific ETL file. This was helpful in going after metadata that was being reversed and that
would only be present for certain combinations of provider/event ID's. For this use-case, the -stats

Copyright © TZWorks LLC                        May 15, 2022                                           Page 4
option was added to the design. Using this option will cause tela to histogram the events by their
respective provider.

Below is a sample output using this option. Various sections are truncated to not take up too much
space in the document, but enough to get the point across as to what the output looks like. If the
provider name for the provider GUID is known by tela, it be outputted as shown below. For each
provider, a set of event ID's are displayed along with the number of occurrences.

Without this option, one would need to wade through many lines (typically 1000's) of output to identify
whether a specific pair of provider to event ID was present. So, even though it was added as an aid in
the development of tela, the option was left in since it can also be useful to the analyst, as a quick look
report.

As a subset of this option there is also the -guids option, which will just list the provider GUID and
associated name, if available. The syntax is the same as the previous command, but substituting
word -stats with -guids.

Copyright © TZWorks LLC                        May 15, 2022                                          Page 5
3.2 Parsing out ETL records

When pulling out the records of an ETL file, one can either use the -log option and explicitly pass in the
path of the file, or use the -pipe option and use standard input. Either way, the record output is the
same, but the second approach will have a small header per file added, so the output is clear which file
is associated with which records.

There are a few things to note about the records contained in an ETL file.

    •   As shown in the previous example, more than one provider can be embedded in an ETL file.
    •   Given that each provider can have their own set of version changes and templates, this means
        that each record from one provider to the next may or may not have the same structure for the
        header. Different structures for the headers means the parser dynamically switches between
        each header type encountered. This makes rendering the output of the data more complex
        since the field from one header may not be in another header. tela does a good job at aligning
        the common fields appropriately. For the differing data, tela uses a single field that is expressed
        in a quasi JSON output to render these unique fields.
    •   Each record in the ETL may or may not have payload data in addition to its header data. The
        payload data varies based on the event ID associated with that record. For any available event
        template data that was available during the design tela, that payload data structure was
        included into tela, and consequently will have the appropriate field names associated with the
        values in the payload as part of the output. If the template data was not available to us, then
        tela will try to figure out which data are strings, values, etc. This latter case, of course, would be
        a guess, and tela, identifies this data with labels prepended with the letters guess_.
    •   If the ETL file uses any type of compression, then tela will not be able to parse it, since no
        decompression logic was added to the tool. Specifically, if you use a tool to copy ETL file off a
        disk in a raw manner (eg. via cluster reads) and the data is using the NTFS compression, tela will
        not be able to parse that data.
    •   The timestamps for ETL records can use more than one format, ranging from FILETIME data
        (which is normal), QPC, or CPU cycle counter. The first is normal and easy to convert to UTC.
        The latter two, require some additional translation and are dependent on other parameters to

Copyright © TZWorks LLC                        May 15, 2022                                           Page 6
convert them to UTC. This is because they are not synchronized to any external time reference.
Therefore to retrieve time stamps that can be synchronized to an external time reference, one
needs to use other parameters such as the frequency of the Performance Counter and CPU
speed. Depending on whether this other data is present dictates whether the output displays
the time in UTC or tick count.
With the limitations discussed above, tela is pretty robust at parsing ETL files, in general.
3.3 Searching for Providers
All the ETL data is based on a specific provider and how that provider wishes to format the data. The
provider data in each record are in terms of GUIDs. To understand what a GUID value translates to, one
can look to the Software registry hive (or use Windows Powershell to enumerate the providers).
Alternatively, tela can pull the data from the registry for you via the -providers option. tela will go off
and spawn cafae to pull the data from the subkey:
[SOFTWARE\Microsoft\Windows\CurrentVersion\WINEVT\Publishers]. Below is an example of doing
this on one of our test systems:
The first column above shows the provider GUID mapped to the provider name in the second column.
The 3rd column is also important, and it is the portable executable (PE) file that contains the resource
that holds the template on how to translate the ETL payload data.
3.4 Mapping Provider/Event ID to PE Resource Data
Each record in the ETL file will have a set of common structure for the header data and set of bytes for
the payload data. To make sense of the payload data, one needs to extract the template that is stored
in the PE resource data associated with the provider and event identifier. This section provides a quick
set of procedures to do just that using tela and other TZWorks tools.
In the previous section, it was discussed how to pull the PE resource associated to a provider GUID or
name. Referring to the output in the previous section, the third column is the critical data that is
needed. If we take one of the resources on the right, such as the one for GroupPolicy [gpsvc.sys], one
Copyright © TZWorks LLC May 15, 2022 Page 7can look at the template data that is present in this resource. This can be done via the -extract_bxml option and passing in the PE resource as an argument. When this is invoked, tela will go off and spawn pescan to pull the WEVT_TEMPLATE data from the specified PE file, and render it like so: Starting with the second line that has a double forward slash is the PE version and which OS it targets. This is important, since different versions may have different provider WEVT_TEMPLATE data. This data is then used to map into which OS the ETL file came from. Then there is a list of records, where a record starts with the provider GUID, then the event ID, and finally the template data when the numbers in this data use the BXML schema. Towards the end of the output there are two other records where there is listed another provider GUID and its template data. This means each PE WEVT_TEMPLATE resource can contain more than 1 provider type data. While the above output is somewhat compact, it is useful to us internally to build templates to allow tela to parse various provider data. Showing it here is primarily for illustrative purposes help the reader understand the process required to parse the payload data in the ETL records. 3.5 Using Templates to assist tela An internal option is exposed that allows for users to point tela to an external template type file, via the syntax -template . The purpose of this option was to allow the tool have parsing extensibility as new providers become of interest. Although this option is functional, the generation of these templates was meant to be done internally until this functionality matures out of the beta phase. This is because the generation of these template files requires one to have good knowledge of the WEVT_TEMPLATE data from the provider. Further, this requires one to understand the output of the raw WEVT_TEMPLATE data, and how to apply that data to parse ETL structures. Copyright © TZWorks LLC May 15, 2022 Page 8
4 Available Options

       Option                                   Description
                 Identify which event log(s) to operate on. The syntax is: -log . To operate one more than one at a time, use: -log " |
                  | ..."
-csvl2t          Outputs the data fields in accordance with the log2timeline format.

                 This option allows one to parse in multiple tracelogs from standard input
-pipe
                 in one session.
-enumdir         Experimental. Used to process files within a folder and/or subfolders.
                 Each file is parsed in sequence. The syntax is -enumdir  -
                 num_subdirs .

                 Filters data passed in via stdin via the -pipe or -enumdir options. The
-filter          syntax is -filter . The wildcard
                 character '*' is restricted to either before the name or after the name.
-quiet           This option is tells the app not to display progress status during a run.

                 This option will remove all white space between the field value and the
-no_whitespace
                 delimiter separator.
                 Used in conjunction with the -csv option to change the CSV separator
-csv_separator   from the default comma to something else. Syntax is -csv_separator "|"
                 to change the CSV separator to the pipe character.
                 Output the date using the specified format. Default behavior is -
                 dateformat "mm/dd/yyyy". This allows more flexibility for a desired
                 format. For example, one can use this to show year first, via
-dateformat      "yyyy/mm/dd" or day first, via "dd/mm/yyyy", or only show 2 digit
                 years, via the "mm/dd/yy". The restriction with this option is the forward
                 slash (/) symbol needs to separate month, day and year and the month is
                 in digit (1-12) form versus abbreviated name form.
                 Output the time using the specified format. Default behavior is -
                 timeformat "hh:mm:ss.xxxxxxxxx" One can adjust the format to
                 microseconds, via "hh:mm:ss.xxxxxx" or millisecs, via "hh:mm:ss.xxx", or
                 no fractional seconds, via "hh:mm:ss". The restrictions with this option is
-timeformat
                 that a colon (:) symbol needs to separate hours, minutes and seconds, a
                 period (.) symbol needs to separate the seconds and fractional seconds,
                 and the repeating symbol 'x' is used to represent number of fractional
                 seconds.
                 Use the specified file that stores BXML templates to parse ETL file. The
-templates
                 syntax is: -templates .

Copyright © TZWorks LLC                   May 15, 2022                                         Page 9
Create a subset ETL file with just the specified GUID (provider) records.
-pullguid
The syntax is: -pullguid -out .
-guids List all the providers (guids) used in the ETL file(s)
List all the providers (guids) and the Event IDs used in the ETL file(s). The
-stats
Event IDs will be listing in terms of occurrence (like a histogram).
Extract the BXML Templates from the portable executable (PE) file. The
-extract_bxml syntax is: -extract_bxml . This option relies on the presence of
pescan to be in the same directory as tela.
Extract the providers and their associate guid and resource file from the
-providers specified Software hive. The syntax is: -providers . This option
relies on the presence of cafae to be in the same directory as tela.
5 Common locations for ETL files
System volume location ETL file
%ProgramData%\Microsoft\Windows\WER\ReportQueue\*\ {guid}-WER-MMDDYYYY-####
%ProgramData%\Microsoft\Windows\wfp\ wfpdiag
%ProgramData%\USOShared\Logs\ NotificationUxBroker,
UpdateSessionOrchestration
%LocalAppData%\Packages\Microsoft.CommsPhone_..\LocalCache\ CallsAppLog, CallsBackgroundTaskLog,
%LocalAppData%\Packages\Microsoft.Messaging_...\LocalCache\ MessagingBackgroundTaskLog
%LocalAppData%\Packages\Microsoft.Windows.Photos_...\LocalState\ PhotosAppTracing
%LocalAppData%\Diagnostics\*\*\ {guid}.Diagnose, {guid}.Repair, {guid}.Verify
%LocalAppData%\ElevatedDiagnostics\*\*\ {guid}.Diagnose.Admin, {guid}.Repair.Admin,
{guid}.Verify.Admin
%LocalAppData%\Microsoft\Office\ OTeleData
%LocalAppData%\Microsoft\OneDrive\logs\Personal\ TraceCurrent, TraceArchive
%LocalAppData%\Microsoft\Windows\Explorer\ ExplorerStartupLog
%LocalAppData%\Temp {guid}.Repair, {guid}.Diagnose, {guid}.Verify
%UserProfile%\Tracing\WPPMedia\ Skype_MediaStack
%systemroot%\Logs\dosvc\ dosvc.YYYYMMDD_xxxxx
%systemroot%\Logs\NetSetup\ service.x
%systemroot%\Logs\SIH\ SIH.YYYYMMDD.xxxxx
%systemroot%\Logs\SystemRestore\ Restore.UI
%systemroot%\Logs\WindowsBackup\ WBEngine.x
%systemroot%\Logs\WindowsUpdate\ WindowsUpdate.YYYYMMDD.xxxxx
%systemroot%\Panther\ setup
%systemroot%\Performance\WinSAT\DataStore\ winsat
%systemroot%\security\logs\ SceSetupLog
%systemroot%\SoftwareDistribution\Download\*\*\ WindowsUpdate.YYYYMMDD.xxxx,
SceSetupLog, LwtNetLog, Wifi,
EtwRTDiagLog, EtwRTEventLog-Application,
EtwRTEventLog-System, ShutdownCKCL,
BootCKCL, SecondaryLogonCKCL, wfpdiag,
KnobsCsp
%systemroot%\System32\LogFiles\WMI\ Wifi, FamilySafetyAOT, LwtNetLog, ..
%systemroot%\System32\LogFiles\WMI\RtBackup\ EtwRTDiagLog, EtwRTEventLog-System,
EtwRTEventLog-Application, EtwRTUBPM,
Copyright © TZWorks LLC May 15, 2022 Page 10EtwRTEventlog-Security,
EtwRTDefenderAuditLogger, EtwRTWFP-
IPsec Diagnostics, EtwRTDiagtrack-Listener,
EtwRTDefenderApiLogger, ...
%systemroot%\System32\NDF\ eventlog
%systemroot%\System32\SleepStudy\ sleepstudy-trace-yyyy-mm-dd-hh-mm-ss,
SleepStudyTraceSession
%systemroot%\System32\WDI\{guid}\{guid}\ snapshot
%systemroot%\System32\WDI\LogFiles\ SecondaryLogonCKCL, ShutdownCKCL,
BootCKCL, ...
%systemroot%\System32\winevt\Logs\ AirSpaceChannel, ...
6 Authentication and the License File
This tool has authentication built into the binary. The primary authentication mechanism is the digital
X509 code signing certificate embedded into the binary (Windows and macOS).
The other mechanism is the runtime authentication, which applies to all the versions of the tools
(Windows, Linux and macOS). The runtime authentication ensures that the tool has a valid license. The
license needs to be in the same directory of the tool for it to authenticate. Furthermore, any
modification to the license, either to its name or contents, will invalidate the license.
7 References
1. EventTracing on MSDN website and related articles - https://msdn.microsoft.com/en-
us/library/windows/desktop/bb968803(v=vs.85).aspx
2. Microsoft Message Analyzer, version 1.4 (build 4.0.8112.0)
3. Microsoft Event Viewer (Windows 7, 8, and 10)
4. Microsoft TraceView Tool (Windows SDK)
Copyright © TZWorks LLC May 15, 2022 Page 11You can also read