UNDERSTANDING RACIAL AND ETHNIC DISPARITIES IN HEALTH OUTCOMES AND UTILITY INSECURITY RESULTING FROM COVID-19 - DAN TREGLIA, PHD, MINA ADDO, MPA ...
←
→
Page content transcription
If your browser does not render page correctly, please read the page content below
UNDERSTANDING RACIAL AND
  ETHNIC DISPARITIES IN HEALTH
OUTCOMES AND UTILITY INSECURITY
   RESULTING FROM COVID-19

  Dan Treglia, PhD, Mina Addo, MPA, Meagan Cusack, MSW, and Dennis Culhane, PhD
                            University of Pennsylvania
UNDERSTANDING RACIAL DISPARITIES IN HEALTH OUTCOMES & UTILITY INSECURITY RESULTING FROM
                                            COVID-19

Table of Contents
Acknowledgements ............................................................................................................................... 4
Executive Summary ............................................................................................................................... 5
Introduction ........................................................................................................................................... 6
   COVID-19 Moratorium Timeline ......................................................................................................... 8
Data Sources.......................................................................................................................................... 9
   Administrative and Census Data Sources ........................................................................................... 9
       Utility Insecurity ............................................................................................................................. 9
       COVID-19 Health Outcomes ........................................................................................................... 9
   Primary Data .................................................................................................................................... 10
Methods .............................................................................................................................................. 10
Results ................................................................................................................................................. 10
   Housing and Utility Insecurity........................................................................................................... 10
       Administrative Data Findings ....................................................................................................... 11
       Survey Findings ............................................................................................................................ 17
       Focus Group Findings ................................................................................................................... 19
   COVID-19 Health Impacts ................................................................................................................ 26
       Administrative Data Findings ....................................................................................................... 26
       Focus Group Findings ................................................................................................................... 34
Conclusion ........................................................................................................................................... 36
   Limitations ....................................................................................................................................... 37
Policy Implications and Recommendations .......................................................................................... 38
References ........................................................................................................................................... 40
Appendix A. Utility Provider Data ........................................................................................................ 41
   Table A1. 2017 Residential Terminations and Reconnections by Energy Provider ............................. 41
   Table A2. 2017 Low-Income Residential Terminations and Reconnections by Energy Provider ......... 41
Appendix B. American Housing Survey Data ........................................................................................ 42
   Table B1. Demographic and Household Characteristics .................................................................... 42
   Table B2. Median Monthly Renter Housing Costs by Race ................................................................ 43
   Table B3. Median Monthly Homeowner Housing Costs by Race ....................................................... 43
   Table B4. Median Monthly Renter Housing Costs by Poverty Level .................................................. 44
   Table B5. Median Monthly Homeowner Housing Costs by Poverty Level.......................................... 44
Appendix C. Regression Analyses of Utility Assistance and Arrears ...................................................... 45

                                                                          Page 1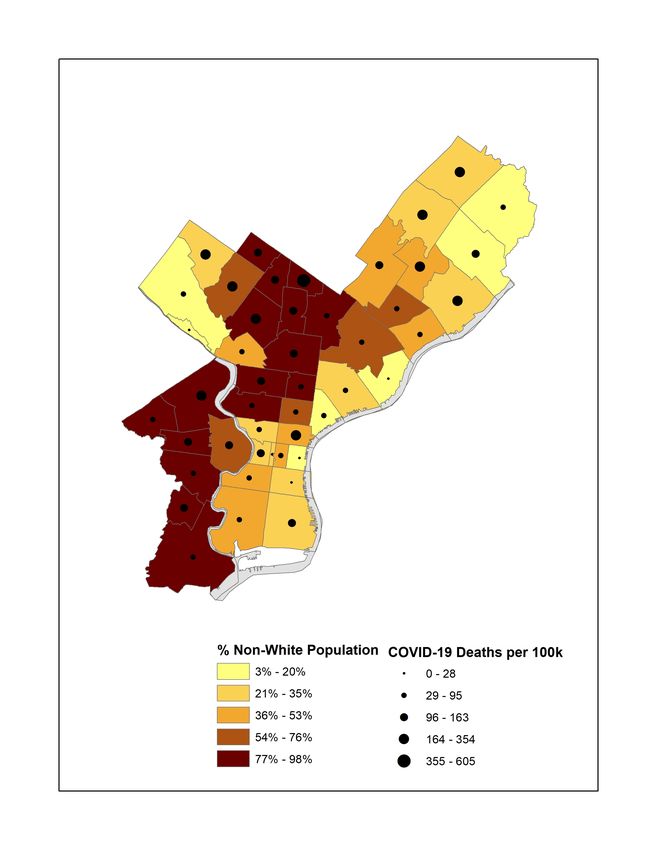
UNDERSTANDING RACIAL DISPARITIES IN HEALTH OUTCOMES & UTILITY INSECURITY RESULTING FROM
                                            COVID-19

   Table C1. Regression Analysis Modeling Effects on Proportion of CAP Customers by Block Group ... 45
   Table C2. Regression Analysis Modeling Effects on Mean Electric Arrears ........................................ 45
   Table C3. Regression Analysis Modeling Effects on Mean Dual Energy and Gas Arrears ................... 45
   Table C4. Regression Analysis Modeling Effects on Proportion of CRP Customers by Zip Code ........ 46
   Table C5. Regression Analysis Modeling Effects on Proportion of TAP Customers by Zip Code ........ 46
Appendix D. Utility Insecurity Survey ................................................................................................... 47
Appendix E. Utility Insecurity Survey Data ........................................................................................... 55
   Table E1. Demographic and Household Characteristics .................................................................... 55
   Table E2. Monthly Housing Costs by Race ........................................................................................ 56
   Table E3. Housing and Utility Insecurity by Race .............................................................................. 57
   Table E4. Concerns about COVID-19 by Race ................................................................................... 58
Appendix F: COVID-19 Health Outcomes ............................................................................................. 60
   Table F1. Pennsylvania Counties with the Largest Number of COVID-19 Cases (September 2020) ... 60
   Table F2. Pennsylvania Counties with the Largest Number of COVID-19 cases (December 2020) ..... 60
   Table F3. Pennsylvania Counties with the Highest Rate of COVID-19 cases per 100,000 People
   (December 2020) ............................................................................................................................. 61
   Table F4. Regression Analysis of COVID-19 Cases per 100,000 People and Share of Non-White
   Residents in Pennsylvania (September 2020) ................................................................................... 61
   Table F5. Regression Analysis of COVID-19 Cases per 100,000 People and Share of Non-White
   Residents, Disaggregated, in Pennsylvania (September 2020) ......................................................... 61
   Table F6. Regression Analysis of COVID-19 Cases per 100,000 People and Share of Non-White
   Residents in Pennsylvania (December 2020) .................................................................................... 61
   Table F7. Regression Analysis of COVID-19 Cases per 100,000 People and Share of Non-White
   Residents, Disaggregated, in Pennsylvania (December 2020)........................................................... 62
   Table F8. Pennsylvania Counties with the Largest Number of COVID-19 Deaths (September 2020) . 62
   Table F9. Pennsylvania Counties with the Largest Number of COVID-19 Deaths (December 2020) .. 62
   Table F10. Pennsylvania Counties with Highest Rates of COVID-19 Deaths per 100,000 People
   (December 2020) ............................................................................................................................. 62
   Table F11. Regression Analysis of COVID-19 Deaths per 100,000 People and Share of Non-White
   Residents in Pennsylvania (September 2020) ................................................................................... 63
   Table F12. Regression Analysis of COVID-19 Deaths per 100,000 People and Share of Non-White
   Residents, Disaggregated, in Pennsylvania (September 2020) ......................................................... 63
   Table F13. Regression Analysis of County-Level COVID-19 Deaths per 100,000 People and Share of
   Non-White Residents in Pennsylvania (December 2020) .................................................................. 63
   Table F14. Regression Analysis of County-Level COVID-19 Deaths per 100,000 People and Share of
   Non-White Residents, Disaggregated, in Pennsylvania (December 2020) ........................................ 64

                                                                      Page 2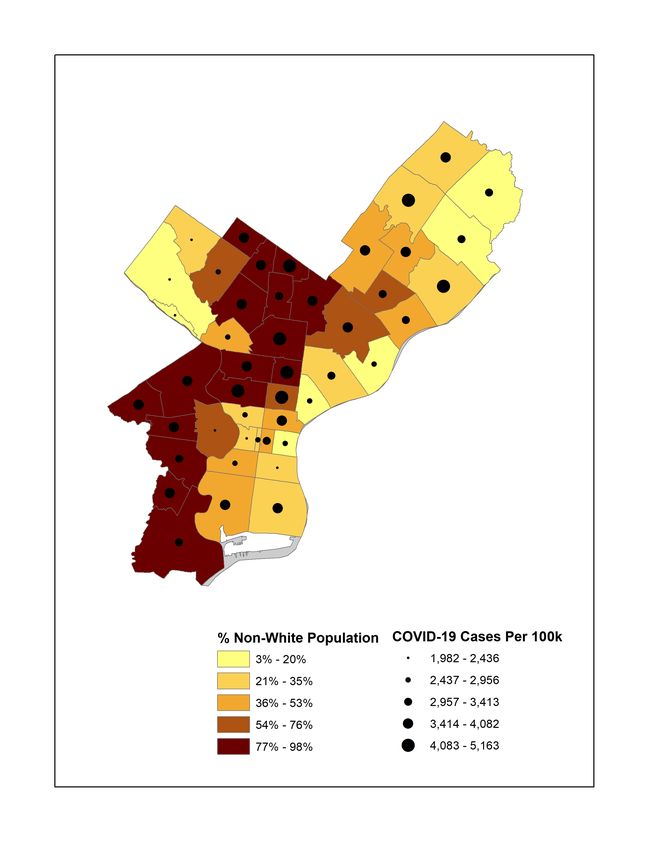
UNDERSTANDING RACIAL DISPARITIES IN HEALTH OUTCOMES & UTILITY INSECURITY RESULTING FROM
                                         COVID-19

Table F15. Regression Analysis of COVID-19 Cases by Zip Code and Share of Non-white Residents in
Pennsylvania (September 2020) ....................................................................................................... 64
Table 16. Regression Analysis of COVID-19 Cases by Zip Code and Share of Non-White Residents in
Pennsylvania (September 2020) ....................................................................................................... 64
Table F17. Top 10 Philadelphia Zip Codes with the Largest Number of COVID-19 Cases (November
2020)................................................................................................................................................ 64
Table F18. Philadelphia Zip Codes with the Largest Number of COVID-19 Cases (December 2020) .. 65
Table F19. Philadelphia Zip Codes with the Highest Rates of COVID-19 Cases per 100,000 People
(November 2020) ............................................................................................................................. 65
Table F20. Philadelphia Zip Codes with the Highest Rates of COVID-19 Cases (December 2020)...... 65
Table F21. Regression Analysis of COVID-19 Deaths per 100,000 People and Share of Non-White
Residents by Philadelphia Zip Code (November 2020)...................................................................... 66
Table F22. Regression Analysis of COVID-19 Cases per 100,000 People and Share of Non-White
Residents, Disaggregated, by Philadelphia Zip Code (November 2020) ............................................ 66
Table F23. Regression Analysis of COVID-19 Cases per 100,000 People and Share of Non-White
Residents by Philadelphia Zip Code (December 2020) ...................................................................... 66
Table F24. Regression Analysis of COVID-19 Cases per 100,000 people and Share of Non-White
Residents, Disaggregated, by Philadelphia Zip Code (December 2020) ............................................ 66
Table F25. Philadelphia Zip Codes with the Largest Number of COVID-19 Deaths (November 2020) 67
Table F26. Philadelphia Zip Codes with the Largest Number of COVID-19 Deaths (December 2020) 67
Table F27. Philadelphia Zip Codes with the Highest Rate of COVID-19 Deaths (November 2020) ..... 67
Table F28. Philadelphia Zip Codes with the Highest Rate of COVID-19 Deaths (December 2020) ..... 68
Table F29. Regression Analysis of COVID-19 Deaths per 100,000 People and Share of Non-White
Residents by Philadelphia Zip Code (November 2020)...................................................................... 68
Table F30. Regression Analysis of COVID-19 Deaths per 100,000 People and Share of Non-White
Residents, Disaggregated, by Philadelphia Zip Code (November 2020) ............................................ 68
Table F31. Regression Analysis of COVID-19 Deaths per 100,000 People and Share of Non-White
Residents by Philadelphia Zip Code (December 2020) ...................................................................... 68
Table F32. Regression Analysis of COVID-19 Deaths per 100,000 people and Share of Non-White
Residents, Disaggregated, by Philadelphia Zip Code (December 2020) ............................................ 69

                                                                       Page 3
UNDERSTANDING RACIAL DISPARITIES IN HEALTH OUTCOMES & UTILITY INSECURITY RESULTING FROM
                                          COVID-19

Acknowledgements
Funding for this work was provided by Community Legal Services and the Pennsylvania Utility
Law Project. Data was provided by Community Legal Services, the Pennsylvania Utility Law
Project, and Great Data.

We appreciate the work of Josie Pickens, Robert Ballenger, Elizabeth Marx, and Madilyn
Keaton in recruiting survey and focus group participants and for their feedback throughout the
drafting of this report. In addition, we are grateful for guidance and input from Kevin
Quisenberry and Pittsburgh-area Resource Navigators.

                                             Page 4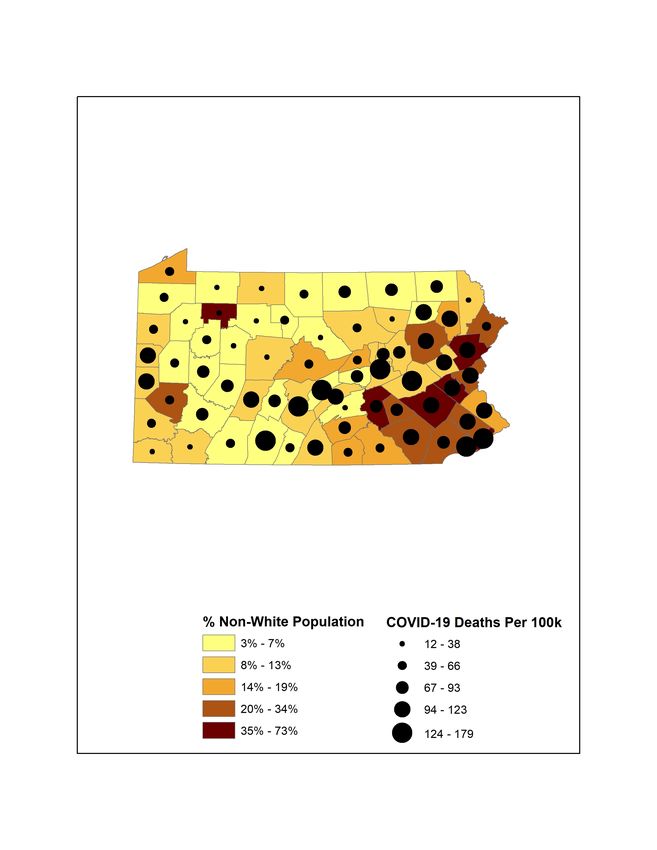
UNDERSTANDING RACIAL DISPARITIES IN HEALTH OUTCOMES & UTILITY INSECURITY RESULTING FROM
                                          COVID-19

Executive Summary
COVID-19 has had devastating effects across broad swaths of life in the United States.
Estimates of more than 27 million documented cases and 543,000 documented deaths likely
undercount its true toll, which has been exacerbated by longstanding social inequalities,
exposing disadvantaged and marginalized populations—particularly Black and Latinx
Americans—to a disproportionate share of COVID-19’s health consequences. The pandemic’s
adverse outcomes aren’t limited to health, having shuttered large portions of the U.S.
economy and putting many Americans out of work and at risk for losing basic necessities like
food and housing.

This study seeks to understand racial and ethnic disparities in both the health consequences of
the pandemic and a particularly under-acknowledged social consequence, utility insecurity in
the Commonwealth of Pennsylvania. We examine these disparities using administrative data
from public health agencies, utility companies, and primary data collected from hundreds of
Pennsylvanians through surveys and focus groups.

We find that a breadth of vulnerabilities faced by all Pennsylvania residents are particularly
acute for racial and ethnic minorities. Low-income, Black, and Latinx residents are more likely
to be rent-burdened and pay more money toward their utility bills than their counterparts.
They are also more likely to experience utility insecurity. Areas with higher concentrations of
minority residents have much higher rates of utility arrears and disconnections as well as much
higher rates of enrollment in utility assistance programs. In addition, roughly three-quarters of
Black and Latinx survey respondents reported falling behind on rent or mortgage payments
since March, and one-third of Black residents reported being either formally or informally
evicted and were the most likely to worry about future evictions and utility shutoffs. We also
found that communities with higher non-white shares of the population were hit hardest by
the coronavirus, especially in the early months. The relationship between virus prevalence and
race became less pronounced as the virus became more ubiquitous through the fall and winter.

These findings have important policy implications. Federal and state governments relief
through moratoria on utility shutoffs should be paired with aggressive outreach to enroll
potentially eligible clients into utility assistance programs and additional financial assistance
for vulnerable households. Broad financial and flexible assistance, like unemployment benefits
and stimulus checks, may also be helpful as households that face utility insecurity often face
other financial struggles. In addition, governments and utility companies alike must do more to
ensure long-term utility affordability and security among low-income households.

                                              Page 5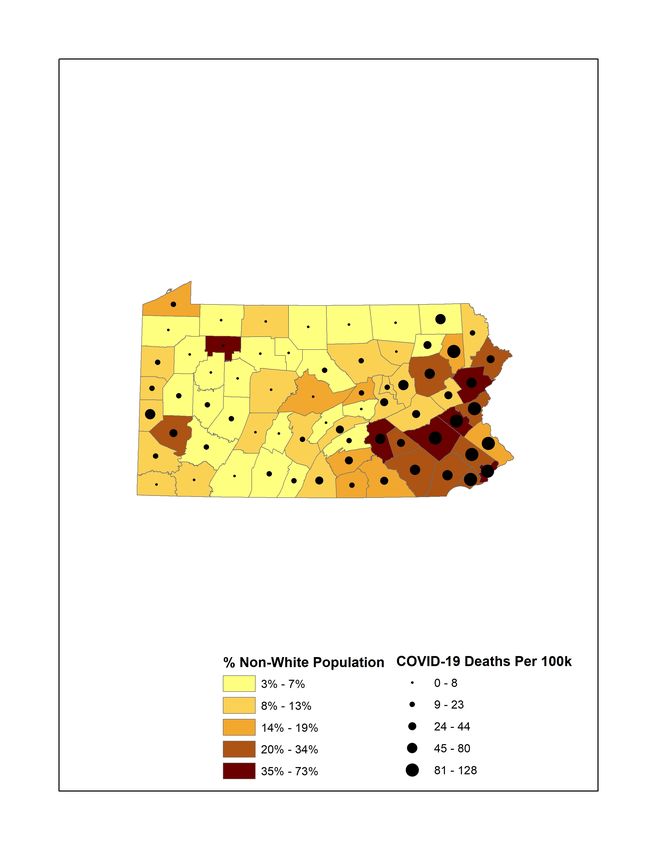
UNDERSTANDING RACIAL DISPARITIES IN HEALTH OUTCOMES & UTILITY INSECURITY RESULTING FROM
                                           COVID-19

Introduction
COVID-19 has had devastating effects across broad swaths of life in the United States. In the
last eight months there have been more than 30 million documented cases and 543,000
documented deaths—both figures are likely to be underestimates.

The coronavirus’s impacts have been exacerbated by longstanding social inequalities, exposing
disadvantaged and marginalized populations to a disproportionate share of COVID-19’s
consequences. Black Americans are 3.5 times more likely, and Latinx Americans are twice as
likely, to die of COVID-19 than their white counterparts (Artiga et al., 2020). In Pennsylvania,
Black Pennsylvanians represent nearly one-third of COVID-19 cases but only 11% of the
Commonwealth’s population (Artiga et al., 2020).

The coronavirus’s impacts have been far-reaching, shuttering large portions of the economy
since the U.S. outbreak began in early 2020. Beginning in mid-March the U.S. experienced 19
straight weeks of more than one million new unemployment claims, each of those surpassing
the previous record of approximately 700,000 claims, set in 1982 (Federal Reserve Bank of St.
Louis, 2020; Zarroli & Schneider, 2020). And though the economy has begun to recover, only
half of the 22 million jobs lost between February and April have returned (Parker et al., 2020).
The U.S Department of Labor estimates that 3.8 million workers lost their job permanently in
September, and more than 2.4 million workers have been out of work for at least 27 weeks,
putting them into the category of “long-term joblessness”(Smialek et al., 2020).

With millions unemployed or underemployed and economic recovery hindered by repeated
case surges, there is justified concern about widespread housing instability. One early estimate
predicted a 40-45% increase in the number of people experiencing homelessness, and
subsequent analyses of rental and mortgage arrears have only increased concerns of a
widespread housing crisis, suggesting that upwards of 44 million U.S. renters owe more than
$21 billion in back rent and could be subject to eviction proceedings (Community Solutions,
2020). Just as the health consequences of COVID-19 have targeted people of color, so will the
eviction crisis. In one recent survey, Black and Latinx households were twice as likely as whites
to say they would be unable to pay their rent in the next month (Parker et al., 2020).

Despite this focus on housing insecurity, there has been relatively little attention on the
millions of Americans who have struggled to pay their utility bills and could face termination of
their heat, water, and electricity. The data on COVID-19’s threat to utility security is sparse but
shows a consistent and concerning narrative. One analysis suggests that electric and gas
arrears alone could exceed $24 billion by the end of 2020, and a Washington Post analysis of
the nation’s largest energy regulators found that utility arrears by September 2020 were four
times higher than they were at the same point in 2019 (Romm, 2020).

As a field of study, utility insecurity is in its nascence, the result of several factors. For one, the
data required to accurately assess and analyze utility trends and vulnerabilities are largely
inaccessible to researchers. Private utility companies are generally reticent to share data and
even government-run utilities have become adept at limiting publicly shared data. Second,

                                                  Page 6
UNDERSTANDING RACIAL DISPARITIES IN HEALTH OUTCOMES & UTILITY INSECURITY RESULTING FROM
                                           COVID-19

utilities are often lumped into the category of housing costs, and data exist either in the
aggregate (combining rent or mortgage with utility payments, as exists in Census data) or the
focus tends to be on rent or mortgage payments that generally constitute the largest share of
total housing cost.

Though the field of inquiry is new, problems of utility insecurity are well-documented. In 2015,
nearly one-third of the United States’ 118 million households had some difficulty paying their
utilities and 17 million American households (14%) had received a utility disconnection notice
(Watt, 2018). This is a problem concentrated among low-income Americans and racial and
ethnic minorities (Sen, 2020). In one study, households earning above $50,000 each year had
utility costs representing 3% of their after-tax wages, while the same figure was 33% of the
income of households making less than $10,000 per year (Hernández, 2013). Urban Black
households pay 54% more of their income toward utilities than the average urban household
(Graff & Carley, 2020). In one survey assessing the utility insecurity and health of nearly 10,000
children, 34% lived in a household that had either moderate or severe utility insecurity (Cook et
al., 2008).

There are several disparate causes of utility insecurity that often combine to produce a
multiplicative disadvantage on already vulnerable households. One of the leading drivers of
utility insecurity is obviously low-income—households with fewer earnings pay a higher share
of their income toward utilities, even holding all other factors equal—but other factors are
rarely equal. Low-income households are more likely to live in housing with inefficient or
malfunctioning heating systems, or inefficient appliances, or with insufficient insulation, all of
which increase energy costs. In some cases, the household may have control over those
systems but lack the capital and expertise to ameliorate malfunctioning or antiquated energy
systems. Low-income households are also least likely to have control over those systems,
which is often relegated to landlords or building superintendents.

The resulting utility insecurity is psychologically and physiologically damaging. In one study of
Detroit households, those who had received a water shutoff notice had, on average, a 2.3 point
increase on a 5-point psychological distress scale, and having had a water supply shutoff that
was subsequently reconnected was associated with a .99 point increase in distress (Gaber et
al., 2020). Energy insecurity is also associated with food insecurity, higher risk of
hospitalization, and poor/fair health (Carley & Konisky, 2020; Graff & Carley, 2020; Hernández,
2013). Those with malfunctioning or inefficient heating systems, or whose heat has been shut
off, are more likely to turn to non-traditional heating sources like ovens or space heaters,
putting them at risk of fire and fire-related injury and death as well as respiratory illnesses like
asthma.

In this report, we examine racial and ethnic disparities in health and utility insecurity caused by
the COVID-19 pandemic in the Commonwealth of Pennsylvania. First, using data from a
variety of sources—including utility arrearages, terminations, and assistance program
participation from utility companies, household characteristics and housing costs from the U.S.
Census Bureau, and housing and utility concerns from surveys and focus groups with

                                                Page 7
UNDERSTANDING RACIAL DISPARITIES IN HEALTH OUTCOMES & UTILITY INSECURITY RESULTING FROM
COVID-19
Pennsylvania residents—we document the pandemic’s differential impacts on utility insecurity.
Second, we examine data from public health agencies, in combination with demographic data
from the U.S. Census Bureau, to assess the differential rates of COVID-19 infection and death
by race and ethnicity. We supplement these with survey and focus group data to understand
how Pennsylvanians perceive and live with health threats from COVID-19 and how the
pandemic has impacted their ability to care for themselves and their communities. Lastly, we
discuss efforts to address COVID-19 challenges and, particularly, threats of utility insecurity in
the wake of the pandemic.
COVID-19 Moratorium Timeline
The below timeline outlines key milestones in how state, city, and private actors in
Pennsylvania responded to address utility insecurity since the onset of the COVID-19 crisis.
These policy actions generally apply to only regulated utilities. While most unregulated utilities
imposed their own voluntary moratoria, they began lifting those moratoria in September 2020.
March 6, 2020: Governor Tom Wolfe issued a proclamation of disaster, which provided the
Public Utility Commission (PUC) the authority to issue a moratorium on the termination of
utilities from publicly regulated utilities.
March 13, 2020: The PUC issued an emergency moratorium prohibiting regulated electric,
natural gas, water, wastewater, telecommunications, and steam utilities from terminating
customers’ service during the COVID-19 pandemic emergency.
August 10, 2020: The PUC issued a letter from Chairman Dutrieuille requesting comments
regarding the moratorium and customer protections for at-risk customers if the PUC lifted the
absolute service termination moratorium.
October 13, 2020: The PUC entered an order lifting the absolute ban on utility service
terminations, allowing terminations to begin November 9, 2020.
December 1, 2020 through March 31, 2021: The annual winter moratorium protected
households at or below 25% of the Federal Poverty Level (FPL) against gas, electric, and heat-
related water service terminations.
March 31, 2021: “Protected customers” (residential customers with income at or below 300% of
the FPL) remained protected from utility terminations if they applied for all available
assistance programs and requested a payment arrangement from their utility provider. Utilities
waived all late charges, reconnection, and deposit fees.
March 31, 2021: All winter and COVID-related utility protections lifted
Page 8UNDERSTANDING RACIAL DISPARITIES IN HEALTH OUTCOMES & UTILITY INSECURITY RESULTING FROM
COVID-19
Data Sources
Administrative and Census Data Sources
We use data from publicly available sources as well as data provided by Community Legal
Services (CLS) and the Pennsylvania Utility Law Project (PULP) obtained through litigation,
requests filed under public Right to Know laws, and other inquiries made directly to public
utility and health officials. Final datasets included:
Utility Insecurity
§ Overdue customers and dollars overdue by utility type.
§ Residential utility terminations and reconnections by electric and gas providers throughout
Pennsylvania, including terminations and reconnections among confirmed low-income customers.
§ Terminations for non-payment and other reasons and reconnections for payment, medical
certificates, and other reasons.
§ Low Income Home Energy Assistance Program (LIHEAP) Energy Assistance Summary (EASUM) for
2019 and 2020, including grants by county and race.
§ Data on enrollment in the Philadelphia Electric Company’s (PECO) Customer Assistance Program
(CAP) and the number of households with arrearages, and the average amount of arrearages
among those households. These data were provided at the Zip Code + 4 geographic level.
§ Data on enrollment in the Philadelphia Gas Company’s (PGW) Customer Responsibility Program
(CRP). These data were provided at the Zip Code geographic level.
§ Data on enrollment in the Philadelphia Water Department’s (PWD) Tiered Assistance Program
(TAP). These data were provided at the Zip Code geographic level.
COVID-19 Health Outcomes
§ Number of cumulative cases and deaths in Pennsylvania, by county, from the Pennsylvania
Department of Public Health.
§ Number of cases in Pennsylvania, by Zip Code, from the Pennsylvania Department of Public Health.
§ Number of cumulative cases and deaths in Philadelphia, by zip code, from the Philadelphia
Department of Public Health.
Given the emphasis on understanding the racial disparities of utility insecurity and COVID-19
health outcomes, we matched these data sources with the most recent U.S. Census Bureau’s
American Community Survey’s 5-year estimates (2014 – 2018). Data provided at the Zip Code
+ 4 geographic level were matched to Census block group by an outside firm, and demographic
data were matched at the block group level. Data obtained by Zip Code were matched to the
Census Bureau’s Zip Code Tabulation Areas (ZCTAs), and county-level utility and health data
were matched to the Census Bureau’s county geographies.
In addition, we examined data from the U.S. Census Bureau’s American Housing Survey (AHS).
AHS data are reflected at the level of the Census Metropolitan Statistical Area (MSA). In the
case of Philadelphia, this includes surrounding counties and Wilmington, Delaware. That the
majority of observations included in this dataset are from Philadelphia provides confidence
that MSA-level statistics largely reflect realities of Philadelphia and Southeastern Pennsylvania
more broadly, though obviously we can be certain of neither the extent to which that is true
Page 9UNDERSTANDING RACIAL DISPARITIES IN HEALTH OUTCOMES & UTILITY INSECURITY RESULTING FROM
COVID-19
nor the degree to which Southeastern Pennsylvania (including Philadelphia) differs from
surrounding areas included in the MSA.
Primary Data
Administrative data provide a coarse and relatively shallow assessment of the finances and
health of Pennsylvania’s households, and we therefore conducted primary data collection in
two forms. We conducted a survey (see Appendix D) with 683 individuals across the state of
Pennsylvania. The survey was conducted via Qualtrics and distributed through CLS, PULP, and
other nonprofits that work with or otherwise have access to populations experiencing financial
or other vulnerabilities. Among other questions, the survey most prominently asked about:
§ Employment and other income sources, before and since the onset of the COVID-19 pandemic;
§ Household finances, with a focus on rent and utilities and how household resources may be shifted
to focus on certain expenses at the expense of others; and
§ Health impacts of COVID-19 for respondents, household members, and their communities.
All respondents received a $10 gift card for their participation.
We also conducted four focus groups to provide greater depth to our understanding of COVID-
19’s impact on Pennsylvania households. Three focus groups were conducted with financially
vulnerable households; two included individuals in Philadelphia and the third included
individuals in Allegheny County. Recruitment for these focus groups was conducted through
CLS, PULP, and other partnering nonprofits, and participants received a $20 gift card. In
addition, we conducted a focus group with Resource Navigators at a Pittsburgh-area nonprofit
focused on preventing eviction and utility disconnection among low-income households. All
focus groups were conducted via the Zoom video conference platform. Audio from the focus
groups was recorded and transcribed, and contemporaneous notes were taken as backup.
While providing important insight into the complex lived experiences of Philadelphia residents,
survey and focus group participants may not be generalizable to the broader Pennsylvania
population.
Methods
For quantitative data, we used descriptive, univariate, and bivariate statistics to assess
variables and relationships between race and ethnicity and other factors of interest and t-tests,
chi-square tests, and multivariate analyses controlling for demographic and geographic
covariates, to assess the statistical significance of those relationships. For qualitative focus
group data, we used thematic analysis to identify common themes. Quantitative statistical
analyses were conducted using Stata and SPSS and qualitative analyses were conducted using
Dedoose version 8.3.35. Maps were created used ArcGIS.
Results
Housing and Utility Insecurity
Page 10UNDERSTANDING RACIAL DISPARITIES IN HEALTH OUTCOMES & UTILITY INSECURITY RESULTING FROM
COVID-19
Administrative Data Findings
Pennsylvania
Past Due Accounts
Data on the number of overdue electric and gas customers—including those not on
agreement, those on agreement, and those considered inactive—remained fairly constant
between January and September 2020, with an average monthly total of over 120,000 past due
electric customers and 80,000 past due gas customers. Data on the number of overdue water
customers showed a slight upward trend between June and September, but the average
monthly total of just under 25,000 overdue customers was smaller among water utility
providers. (See Table 1.)
Between January and September 2020, the majority of past due accounts across all utility
types were not on agreement (74.7% of electric, 69.7% of gas, and 82.3% of water accounts).
However, while those on agreement made up a smaller proportion of past due accounts (18.1%
of electric, 20.1% of gas, and 12.5% of water accounts), these accounts made up a higher
proportion of arrears. On average, customers on agreement made up nearly half (48.8%) of
water arrears, nearly one-third (31.8%) of electric arrears, and over one-quarter (27.9%) of gas
arrears. Average monthly arrears were highest for electric services at over $55 million, then gas
services at over $35 million and then for water services at over $5 million. (See Table 1.)
Table 1: Average Monthly Past Due Accounts and Arrears by Utility Type, January through September 2020
Electric Gas Water
Customer Type Count Past Due Count Past Due Count Past Due
(%) (%) (%) (%) (%) (%)
90,233 $33,838,917 56,014 $21,449,852 20,193 $2,374,987
Not on agreement
(74.7) (61.2) (69.7) (59.9) (82.3) (45.6)
21,897 $17,580,493 16,168 $9,987,512 3,066 $2,542,483
On agreement
(18.1) (31.8) (20.1) (27.9) (12.5) (48.8)
8,641 $3,899,870 8,211 $4,400,795 1,272 $295,700
Inactive
(7.2) (7.0) (10.2) (12.3) (5.2) (5.7)
Total 120,771 $55,319,280 80,393 $35,838,159 24,531 $5,213,170
Utility Terminations
In 2017, termination rates ranged from 2.3% to 6.1% across electric providers, with an average
of 4.3%. Data suggest that roughly three-quarters or more of terminations were restored, with
an average of 78.9%, across all providers. Termination rates across gas providers were slightly
lower, ranging from 2.4% to 5.8%, with an average of 3.6%. However, fewer overall gas
terminations were restored: only 68.3% were reconnected, more than 10 percentage points
less than electricity reconnections. Moreover, there was greater variation by provider, ranging
from only slightly more than half (54.8%) to more than four in five (86.1%) terminations.
However, it is important to note that many residents move following a termination, which is
not captured in these data. (See Appendix A, Table A1.)
In 2017, termination rates were higher among customers deemed by utility providers to be
low-income customers, though it is worth noting that these assessments of income status by
utility providers are imperfect and unregulated, and come with their own limitations. Using this
Page 11UNDERSTANDING RACIAL DISPARITIES IN HEALTH OUTCOMES & UTILITY INSECURITY RESULTING FROM
COVID-19
metric, electricity terminations impacted more than one in ten low-income customers across
all but one provider, ranging from 8.9% to 18.3%, with an average of 14.7%. The reconnection
rate was also slightly lower: 73.8% among low-income customers compared to 78.9% among
all customers. Gas terminations also impacted more than one in ten low-income customers, on
average, ranging from 3.1% to 17.7%, with an average of 11.2%. The reconnection rate was also
lower among low-income customers, with only 63.6% of terminations being restored among
low-income customers compared to 68.3% among all customers. (See Appendix A, Table A2.)
Data from 2020 suggest that while moratoriums halted terminations for non-payment of utility
bills across electric, gas, and water providers in April, other types of terminations continued.
Reconnections for payments, medical certificates, and other reasons accounted for a portion
of terminations.
LIHEAP Energy Assistance
Between September 2019 and August 2020, LIHEAP Energy Assistance grants went to slightly
less than 3% of all households across the state (n=136,630). This figure represented a slightly
higher proportion of renters than homeowners (47.6% vs. 43%). Black residents had three
times greater odds of receiving LIHEAP assistance than white residents (Odd Ratio [OR]: 3.2;
95% Confidence Interval [CI]: 3.1-3.3). On average, Black residents also received slightly more
assistance ($367 vs. $359).
Assistance varied by county, ranging from less than 1% to nearly 12% of all households.
Compared to white residents, Black residents had greater odds of receiving LIHEAP assistance
in twice as many counties (45 counties vs. 22 counties). These odds were highest in Allegheny
(OR: 9.1; 95% CI: 8.7-9.5), Delaware (OR: 8.9; 95% CI: 8.3-9.5), Chester (OR: 8.7; 95% CI: 7.7-
9.7), Montgomery (OR: 7.6; 95% CI: 6.9-8.3), and Erie (OR: 5.9; 95% CI: 5.4-6.4) counties. Note
that given the timeframe included the Coronavirus Aid, Relief, and Economic Security (CARES)
Act Crisis Recovery Program, which ran from May through August 2020, these data may not
represent a typical year.
Philadelphia
American Housing Survey
Black and Latinx residents of the Philadelphia metropolitan area are 2.5 times as likely to live
below the FPL than their white counterparts. Additionally, only about half of Black and Latinx
residents are homeowners compared with over three-quarters of white residents. (See
Appendix B, Table B1.)
Black and Latinx renters pay a higher share of their income toward total housing costs than
white renters (roughly one-third, on average, verses 29%), though Black and Latinx renters pay
less in housing in absolute dollar terms (roughly $911 among Black and $954 among Latinx
renters, on average, versus $1,230 among white renters). Moreover, while white renters have
higher median rents, Black and Latinx renters generally have higher total utility costs (roughly
$127 among Black and $142 among Latinx renters, on average, versus $125 among white
renters). (See Appendix B, Table B2.)
Page 12UNDERSTANDING RACIAL DISPARITIES IN HEALTH OUTCOMES & UTILITY INSECURITY RESULTING FROM
COVID-19
Similarly, Black homeowners pay more of their income toward total housing costs than Latinx
and white homeowners (over 23%, on average, versus 19% and 20%, respectively), though
they pay less in absolute dollar terms (roughly $881, on average, versus $1,164 among Latinx
renters and $1,508 among white renters). Black homeowners also pay a higher share of their
income toward utilities than both white and Latinx homeowners, while white homeowners pay
significantly more in real estate taxes than either minority group. (See Appendix B, Table B3.)
Renters and homeowners living below the FPL pay a significant portion of their income to
housing costs—over 60% for those living at between 50 and 99% of the FPL. Though rent is
typically higher than monthly mortgage payments for those living below the FPL, homeowners
across all levels of poverty pay more for total utilities each month—typically double—than
renters, possibly due to differences in housing characteristics. (See Appendix B, Tables B4 and
B5.)
Philadelphia Electric Company (PECO)
Between September 2019 and August 2020, PECO averaged 165,751 confirmed low-income
customers each month. During this period, on average, over two-thirds (68.5%) of low-income
customers received assistance through the utility’s Customer Assistance Program (CAP).
The number of PECO CAP customers increased steadily between December 2019 and
September 2020, across both electric, gas, and dual service customers. Across all services, the
total amount of past due accounts and the total amount past due increased between
December 2019 and June 2020 and then dropped slightly through September. (See Table 2.)
Table 2: PECO CAP Customers and Arrears
Total Electric Service Gas Service Dual Service
Month
Count Past Due ($) Count Past Due ($) Count Past Due ($) Count Past Due ($)
Dec 2019 111,878 15,049,364 92,737 11,302,376 329 175,096 18,812 3,571,891
Mar 2020 113,589 21,939,751 94,150 16,076,234 305 142,999 19,134 5,720,518
Jun 2020 114,338 22,321,576 94,635 16,348,948 292 132,879 19,411 5,839,748
Sept 2020 115,384 21,540,412 95,356 16,050,704 280 114,691 19,748 5,375,018
When controlling for median household income, geographies with a higher proportion of Black
and housing burdened residents had higher utilization rates of CAP assistance, while
geographies with a higher proportion of white residents and renters were negatively correlated
with this outcome. Similarly, geographies with a higher proportion of Black and housing
burdened residents had more arrears than those with a higher proportion of white residents
and renters. Characteristics of geographies with higher gas and dual service arrears differed
from those with higher electric service arrears. In these areas, a higher proportion of housing
burdened residents was positively correlated with higher gas and dual services arrears, while a
higher proportion of white and Latinx residents was negatively correlated with gas and dual
services arrears. (See Appendix C, Tables C1 through C3.)
Page 13UNDERSTANDING RACIAL DISPARITIES IN HEALTH OUTCOMES & UTILITY INSECURITY RESULTING FROM
COVID-19
Map 1 demonstrates that areas with a higher density of CAP customers are those with a higher
density of Black and Latinx residents. Similarly, Map 2 shows that the areas of greatest
electrical arrearages are also those with a higher density of Black and Latinx residents.
Map 1. Density of Average CAP Customers and Race by Block Group
Page 14UNDERSTANDING RACIAL DISPARITIES IN HEALTH OUTCOMES & UTILITY INSECURITY RESULTING FROM
COVID-19
Map 2. Density of Average CAP Customers, Electrical Arrears, and Race by Block Group
Philadelphia Gas Works (PGW)
In May 2020, PGW had 125,911 confirmed low-income customers, making up over one-quarter
(26.6%) of all customers. Two in five (42.9%) low-income customers received Customer
Responsibility Program (CRP) assistance. Geographies with a higher proportion of residents of
Black race and Latinx ethnicity had more PGW customers receiving CRP assistance, as did
areas with a higher proportion of renters. This remained true after controlling for median
household income and proportion of housing burdened households. (See Appendix C, Table
C4.)
Map 3 highlights that Zip Codes with a greater prevalence of CRP customers are also those
with a higher density of Black and Latinx residents.
Page 15UNDERSTANDING RACIAL DISPARITIES IN HEALTH OUTCOMES & UTILITY INSECURITY RESULTING FROM
COVID-19
Map 3. Density of CRP Accounts and Race by Zip Code
Philadelphia Water Department (PWD)
In 2020, PWD served 478,905 customers. Just over 3% received aid through the Tiered
Assistance Program (TAP). Geographies with a higher proportion of residents of Black race and
Latinx ethnicity had higher rates of TAP assistance, holding constant median household
income, proportion of housing burdened households, and proportion of renters. (See Table
C5.) Note that TAP is more heavily utilized by owners than renters, which likely has an impact
on our findings.
Map 4 demonstrates that Zip Codes with more TAP customers have the highest
concentrations of density of Black and Latinx residents.
Page 16UNDERSTANDING RACIAL DISPARITIES IN HEALTH OUTCOMES & UTILITY INSECURITY RESULTING FROM
COVID-19
Map 4. Density of TAP Accounts and Race by Zip Code
Survey Findings
Demographics and Household Characteristics
Slightly more women completed the survey than men, particularly among Latinx respondents.
White respondents reported higher overall levels of education and income and were more
likely to report household income from one or more jobs, investments, and Social Security or
other retirement than both Black and Latinx respondents. (See Appendix E, Table E1.)
Black respondents were more likely to rent their homes than white and Latinx respondents and
Latinx respondents were most likely to report current severe housing instability, staying with
family or friends or in a hotel or motel than either Black or white respondents. White
respondents were more likely to be homeowners than either minority group. (See Appendix E,
Table E1.)
Page 17UNDERSTANDING RACIAL DISPARITIES IN HEALTH OUTCOMES & UTILITY INSECURITY RESULTING FROM
COVID-19
Monthly Housing Costs
Over half of white respondents reported paying $749 or less in monthly rent or mortgage
payments, a significantly higher proportion than either Black or Latinx respondents. However,
they were also significantly more likely to report paying the most—more than $2,000—for
monthly rent or mortgage payments than either minority group. (See Appendix E, Table E2.)
White respondents were more likely to report paying gas, deliverable fuel, and wastewater
charges than both Black and Latinx respondents, while higher proportions of Black and Latinx
respondents reported responsibility for paying electric and water charges. Among respondents
responsible for paying these utilities, Black respondents reported paying significantly more for
electricity and gas than either white or Latinx respondents. White respondents reported paying
more for deliverable fuel, water, and wastewater than either minority group. (See Appendix E,
Table E2.)
Housing and Utility Insecurity
Despite recent moratoriums on evictions, more than three in ten Black respondents reported
being evicted or forced to move since March 2020, a much higher proportion than either white
or Latinx respondents. More than half of those forced to leave stated that their eviction was
court-ordered. Roughly three-quarters of Black and Latinx respondents reported falling behind
on rent or mortgage payments since March and a slightly smaller proportion of each reported
falling behind on utility payments. Fewer (about half) white respondents also reported falling
behind on both rent or mortgage and utility payments. When asked about concern over future
evictions and utility shutoffs, Black respondents reported significantly more concern than
either white or Latinx respondents. Black respondents were also the least likely to report that
they felt their home was a safe and healthy place to spend a lot of time during the pandemic.
(See Appendix E, Table E3).
Black respondents were much less likely than white and Latinx respondents to report “rarely or
never” delaying required payments for some necessary expenses in order to pay for others.
Among those who reported delaying payments, one in five Black respondents indicated that
they delayed payment of utility bills in order to pay other necessary expenses “most or all of
the time,” more than twice the rate of white and Latinx respondents. (See Appendix E, Table
E3.)
Among all respondents, between one-quarter and half reported receiving assistance for rental
support, loan forbearance, utility shutoff prevention, and food assistance during the pandemic
across all racial groups. Latinx respondents reported receiving rental support and loan
forbearance at significantly higher rates than either Black or white respondents. Budget billing
and CAP were the most utilized utility assistance programs. Differences in utility assistance
utilization were typically not statistically significant across racial groups except for LIHEAP,
which was more frequently used by Black respondents. (See Appendix E, Table E3.)
Page 18UNDERSTANDING RACIAL DISPARITIES IN HEALTH OUTCOMES & UTILITY INSECURITY RESULTING FROM
COVID-19
Concerns about COVID-19
The household impacts of COVID-19 differed markedly by race. Over 40% of both Black and
white respondents reported transitioning to a remote work environment, while slightly more
than one-quarter of Latinx respondents reported the same. More white respondents reported
continuing to work on-site than either minority group. In addition, about half of Black
respondents reported a job loss—20 percentage points more than either white or Latinx
respondents. Across all groups, about two in five reported reduced work hours and one in five
reported seeking additional work. (See Appendix E, Table E4.)
Despite economic hardships, between one-quarter and two-thirds of all respondents reported
an increase in their utility bills. Significantly more Black respondents reported increases in
electricity and gas bills compared to both white and Latinx respondents. Significantly more
Black and white respondents reported increases in water bills. Fewer Latinx respondents
reported utility bill increases across all categories. (See Appendix E, Table E4.)
When asked about factors that had caused their household concern during the pandemic,
nearly half of respondents across all groups reported concern about paying the rent or
mortgage (49.4%) and paying utility bills (46.5%). Additionally, over two-thirds reported
concerns over job loss (38.7%), reduced work hours (38.9%), and childcare (34.0%). There were
significant differences across racial groups: Black respondents were most likely to endorse
concern over job loss, paying off debts, and transportation; white respondents were most likely
to endorse concern over reduced work hours; and Latinx respondents were most likely to
endorse concern over paying the rent or mortgage and mental health issues. Black and white
respondents more frequently indicated that childcare, education, and/or remote learning was a
concern than Latinx respondents. Finally, when asked which of these factors was their primary
concern, all racial groups indicated that job loss and household members getting COVID-19
were one of their top three concerns. Black respondents also reported paying the rent or
mortgage and medical issues other than COVID-19 as primary concerns, while white
respondents reported childcare and Latinx respondents reported mental health issues as
primary concerns. (See Appendix E, Table E4.)
Focus Group Findings
Focus group findings are consistent with patterns observed in the quantitative data: the
COVID-19 pandemic has revealed and amplified long-standing financial and material hardships
for many low-income Pennsylvanians. Against this backdrop, this section summarizes
challenges encountered by focus group participants and resource navigators’ clients, forcing
many people to make difficult decisions about which bills to prioritize and where to make
sacrifices. Our findings also offer insights into experiences with public assistance programs,
seeking to understand helpful programs as well as ongoing need.
Financial Hardship
Low wages compared to the cost of living meant that participants were financially vulnerable
long before the COVID-19 pandemic hit. One Pittsburgh-area navigator estimated that as
Page 19UNDERSTANDING RACIAL DISPARITIES IN HEALTH OUTCOMES & UTILITY INSECURITY RESULTING FROM
COVID-19
many as one-fifth of the agency’s clients earn less than $10 per hour, making it difficult for
families to save money or have any wiggle room in their budgets under normal circumstances.
Workers cope by working long hours to make ends meet.
“Clients are working 50 to 60 hours a week making an average of eight to nine and a
half bucks. A $12 [an hour] gig is a good gig for a lot of our clients. And when you math
that out, if you’re working with someone who needs rehousing or their car crapped out
and now they can’t get to their job, they are on shoe strings.”
Community members reported facing further financial strains stemming from job loss, reduced
earnings, and an inability to work. Single mothers of young children faced a specific challenge:
conflict between the need for childcare and ability to work outside the home. Those with
school age children described helping with remote schooling during the day, when they would
otherwise be working.
“Most of the time, my kids went to school Monday to Friday, that wasn't childcare, but
it was in a way. So, when they went to school, I would go to work. So now that they're
out of school and they're going on remote, I have to stay at home with them and I have
to help them with schoolwork and everything. So I'm not able to go to work, and pick
up shifts or anything because of that. I don't have anybody else to watch them. And
then everybody [childcare centers] is kind of scared to take them anyway, everybody's
scared to catch COVID. So, it’s harder for me to make money. So, I had to apply for
unemployment benefits.”
Low income workers faced worsening financial circumstances as the pandemic stretched on.
Workers who initially kept their jobs were being laid off. As one Philadelphia participant
described:
“I work with a lot of workers at the airport for Philadelphia. They laid off 250 people
two weeks ago [in late September]. So, they were working through the pandemic until
this moment. Now that the moratorium is about to end, they’re actually in worse shape
than they were several months ago.”
Others who were initially furloughed were learning that they wouldn’t get their jobs back.
Some workers saw their hours dramatically reduced, but they didn’t qualify for unemployment
insurance because they were still working. Participants across focus groups expressed a
general sense of fear and uncertainty about their jobs at the time of their participation and in
the future.
“Those who were able to keep their jobs, or even part-time keep their jobs, have been
super concerned because I think most of the folks I work with were just trying to figure
out when the next shoe is going to drop. Things have been changing so quickly.”
As employment became more challenging, workers reached the time limit on unemployment
benefits, the expanded federal benefit ended, and other temporary relief programs closed.
Workers were not sure where or how to find jobs in this new environment. Many were also
Page 20UNDERSTANDING RACIAL DISPARITIES IN HEALTH OUTCOMES & UTILITY INSECURITY RESULTING FROM
COVID-19
grappling with whether they could risk their own health, and the safety of those in their
household, by working outside the home.
For those who became sick with COVID-19, lack of paid sick leave meant they faced the
additional burden of lost wages. This could quickly escalate into a serious financial challenge
when more than one member of a household was affected.
“I have had a few clients who have been sick themselves. One of my clients was
working at a grocery store and when she got sick, she wasn’t allowed to work for a
certain number of weeks. So, she was in a position where her husband got exposed and
then she couldn’t go into work again. So largely it’s just people not being able to work
and get their normal income. And that just snowballs into a lot of bills not getting
paid.”
Basic Needs
Utilities
Participants across all three focus groups had difficulty affording utilities; gas and electric bills
were most commonly cited. Internet was challenging among households with school-age
children and for people who were working from home. Internet was also an important resource
for staying connected to family and community members, particularly among those with
health conditions.
“It's literally the only way for me to continue to make income. Also, it's the only way I
have to really have interaction with folks because it's not safe for me to go. So yeah, for
me, Internet. And then I know a lot of folks with kids because that's the only way their
kids are getting any school, the internet, which has been a hit or miss on having laptops
and having availability, much less also getting the internet access.”
Internet was also critical for connecting clients to resources. Pre-COVID, community members
could visit social service agencies or local libraries in-person to seek help, but following the
onset of the pandemic, many agencies were no longer open, operating with limited hours and
staff, or required appointments to access resources. Yet, Internet access was often critical to
even learning about relief program requirements. Some Pittsburgh area navigators adapted
and started to visit clients in their home to assist with applications, relying on personal phones
or tablets to access online materials.
“I’ve talked to quite a few people who are at a loss as to how to get paperwork back
and forth. They’re not comfortable enough with say a cell phone to sign something or
take a picture and upload it.”
“I have a lot of residents like that. And what I do is I put on my mask and go to the
house. I’ve downloaded all types of info on my phone, any kind of application I may
need.”
Focus group participants mentioned water bills less often, possibly because some lived in
apartments where water was included in the rent. In Philadelphia, public water utilities are
more common and water bills are linked to the property owner, but private water companies
Page 21You can also read