UNWTO/WTCF City Tourism Performance Research - Report for Case Study "Sapporo" - Amazon ...
←
→
Page content transcription
If your browser does not render page correctly, please read the page content below
UNWTO/WTCF City Tourism Performance
                Research

      Report for Case Study “Sapporo”

                                        © City of Sapporo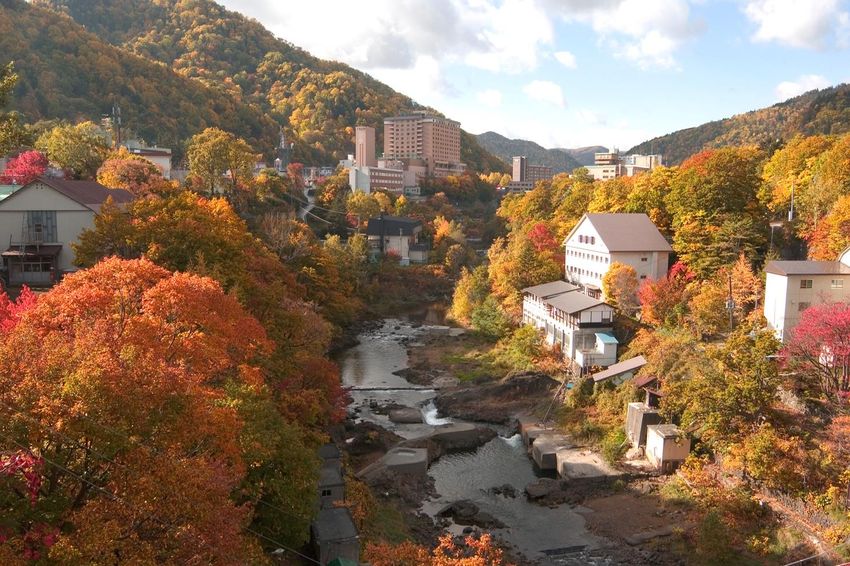
Contents

Background..........................................................................................................................3
1 Introduction to Sapporo – The City ...................................................................................4
1.1 Transport infrastructure..................................................................................................9
1.2 Tourism enterprises .....................................................................................................13
1.3 Key attractions .............................................................................................................17
1.4 Tourism trend ...............................................................................................................21
2 Sapporo: Tourism Performance Research Survey Findings ...........................................26
3 Destination Management ................................................................................................27
3.1 Destination growth strategy .........................................................................................27
3.2 Visitor satisfaction ........................................................................................................39
4 Technology and new business model .............................................................................43
4.1 Peer economy ..............................................................................................................43
4.2 Smart city .....................................................................................................................47
4.3 Internet connectedness................................................................................................51
4.4 Open Data ...................................................................................................................52
4.5 Government services ...................................................................................................52
4.6 Public Transport ...........................................................................................................53
5 Best practice examples of Sapporo ................................................................................55
5.1 Sapporo Snow Festival ................................................................................................55
5.2 Sapporo Autumn Fest ..................................................................................................59
5.3 Publishing of “50 things to do in Sapporo” ...................................................................62
5.4 Promotion of in-city round trip based on big data analysis ...........................................65
5.5 Development of “Satsu-chika” app based on the multi real-time service .....................67
Reference ..........................................................................................................................71

                                                                 2
Background

As part of the UNWTO-WTCF City Tourism Performance Research Survey, an instrument
for collecting data that allows evaluating city tourism performance globally was collected
through interviews conducted in the City of Sapporo.

The research includes five key performance areas: Destination Management, Economic
Perspective, Social and Cultural, Environmental Perspective and Technology & New
Business Models.

Based on basic research about existing data and research and consultation with the city of
Sapporo and Sapporo Tourism Association, two key performance indicators were identified
for this research –Destination Management and Technology & New Business Models.

All the data under each criterion were collected from official data sources including reports
published by the city government. In addition, on-site interviews were conducted with the
Tourism and Economic Bureau, the General Affairs Bureau, the City Development Policy
Planning Bureau and the Transportation Bureau of the Sapporo City Government as well as
with the Sapporo Electronic and Industries Cultivation Foundation and Sapporo Tourism
Association.

This report is based on the findings from the survey conducted in July 2017 by Prof. Yusuke
Ishiguro, Center for Advanced Tourism Studies, Hokkaido University, collaborated by JTB
Tourism Research and Consulting.

                                             3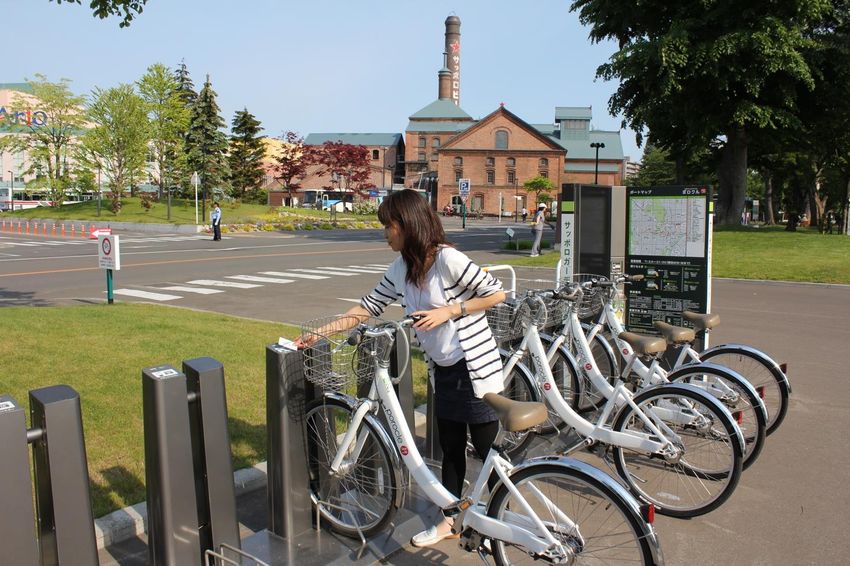
1 Introduction to Sapporo – The City

Sapporo is the capital city of the Hokkaido prefecture, as well as the country's fifth most
populous municipality, with a population of 1.96 million within the area of 1,121.26 km².
Founded as a base of Hokkaido Development Commissioner in 1869 with the aim of
cultivating the Ezo land where the Ainu traditionally had resided. Since the municipal system
was introduced in 1922, the City of Sapporo has expanded its area and population through
repeated mergers with neighboring towns and villages. In 1970, the population exceeded
one million and in 1972, Sapporo was awarded with the status of Government Ordinance
                                                             1
City by order of the Cabinet of Japan after cities such as       after Yokohama, Nagoya, Kyoto,
Osaka, Kobe and Kitakyushu.

The city is located in one of the snowiest places on earth with an annual snowfall of about 6
m. The mountainous surrounding of the city, the long and snowy winter, the high quality of
snow and the easy accessibility through the international airport make the city a well-known
international ski destination. There are 5 ski resorts with a total of 7 million annual skier
arrivals and the regional Okadama Airport and the international New Chitose Airport make
Sapporo the gateway to the area famous for its world class powder skiing among ski
enthusiast.

On the other hand, the Jozankei Onsen area located 30 km from the city center, is one of the
most famous hot spring destinations in the country. It is also part of the Shikotsu-Toya
National Park and the active volcanic landscape and the caldera lakes which attract both
domestic and international visitors there.

Thus, Sapporo as a destination consists of two main areas: urban area around Sapporo
terminal station and Jozankei Onsen in the southern part of the city.

1
  Japanese cities with over 500,000 population are granted a special status under Article
252, Section 19 of the Local Autonomy Law of Japan and include the delegation of many of
the functions normally performed by prefectural governments. In 2017, 20 cities have been
awarded with this special status, and generally “major cities” refer to 21 cities including
these and Tokyo Metropolis which consists of 23 specified districts.

                                              4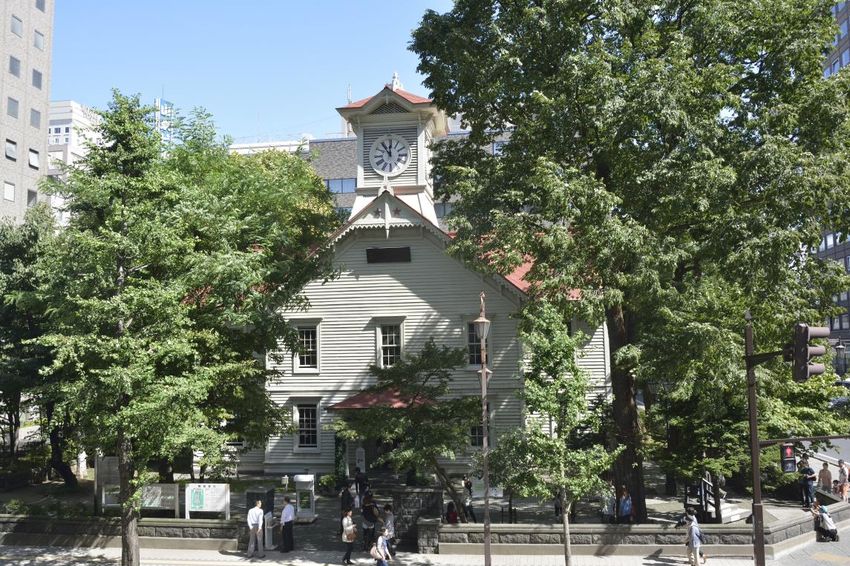
Figure 1.1 City area of Sapporo

Source: Prepared by author based on Sapporo Tourism Association (2016)

                                                       5
Figure 1.2 Around Sapporo station

Source: City of Sapporo

Figure 1.3 Jozankei Onsen

Source: City of Sapporo

                                    6
Apart from the national park around Jozankei Onsen area, its vast areas of urban parks are
also one of the features of Sapporo. Besides Moerenuma Park which is recognized as a
tourist attraction already, the city is rich in green spaces. Being a 2 million plus city, it is
ranked 3rd place in urban park surface area per capita among all ordinance-designated
cities in Japan (see Table 1.1).

Table 1.1 Ranking on urban park area per capita, 2015 (m²)
 City                         Urban parks1                               Population              Surface area

                              Number          Surface area               2015 (million)          per capita (m²)

  1     Kobe                         1,619                   2,635,830                    1.54                     17.1

  2     Osaka                          465                   1,143,220                    0.72                     15.9

  3     Sapporo                      2,725                   2,438,150                    1.95                     12.5

  4     Kitakyushu                   1,702                   1,170,280                    0.96                     12.2

  5     Sendai                       1,665                   1,315,360                    1.08                     12.2

  6     Niigata                      1,369                    804,540                     0.81                      9.9

  7     Kumamoto                       971                    684,380                     0.74                      9.2

  8     Chiba                        1,060                    890,800                     0.97                      9.2

  9     Fukuoka                      1,665                   1,282,600                    1.54                      8.3

 10     Sakai                        1,167                    698,260                     0.84                      8.3

 11     Hamamatsu                      557                    638,550                     0.80                      8.0

 12     Hiroshima                    1,119                    885,600                     1.19                      7.4

 13     Nagoya                       1,449                   1,585,090                    2.30                      6.9

 14     Shizuoka                       490                    421,070                     0.70                      6.0

 15     Saitama                        927                    640,930                     1.26                      5.1

 16     Yokohama                     2,652                   1,806,580                    3.72                      4.9

 17     Kyoto                          908                    639,180                     1.48                      4.3

 18     Sagamihara                     604                    297,970                     0.72                      4.1

 19     Kawasaki                     1,109                    563,280                     1.48                      3.8

 20     Osaka                          988                    950,850                     2.69                      3.5

 21     Tokyo2                       4,238                   2,764,020                    9.33                      3.0
1) It includes prefectural park.
2) The data is only about 23 special wards.
Source: Parks & Open Space Association of Japan (2016)

                                                         7
In addition to this, there are many universities and research institutions with extensive
greenery, and its rural landscape that is not normally seen in a 2-million city attracts both
locals and tourists.
Figure 1.3 Moerenuma Park

Source: City of Sapporo

Figure 1.4 Hokkaido University in autumn

Source: Hokkaido University

                                             8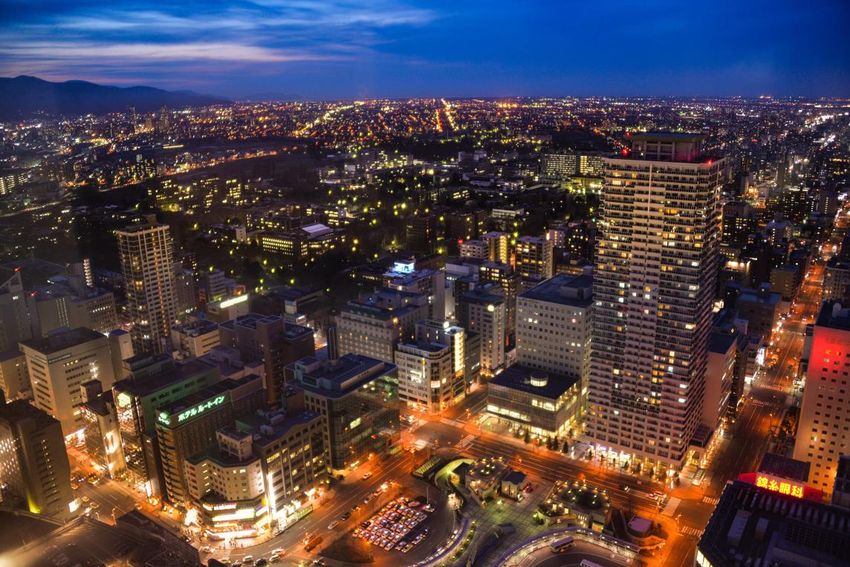
Due to the abundant and diversified resources as described above and adequate
infrastructure, Sapporo has successfully bid to host the 1972 Winter Olympics, the first
Winter Olympics in Asia. Inside the city, visitors are able to encounter lots of sports facilities
as the legacy of the 1972 Olympics such as Hokkaido Makomanai Park Outdoor Stadium
where the opening ceremony was held and the Okurayama jumping stadium used for 90m
ski jump. The city is now planning to run as candidate city for 2026 again.

Figure 1.5 Okurayama Ski Jumping Stadium

Source: City of Sapporo

1.1 Transport infrastructure

Its highly-developed transport infrastructure is one of the city’s competitive advantages as a
destination. The number of daily users of the Sapporo terminal station exceeds 95,000, and
approximately 900 trains arrive at the station every day. In 2030, Hokkaido Shinkansen
Bullet Train will be extended to Sapporo, and will increase accessibility from Tokyo by
reducing the travel time to just 5 hours.

                                               9
The subway system of the city which consists of three lines with 49 stations provides
accessible and efficient transportation service to both citizens and travelers to travel
throughout the city. The streetcar (tram), which is also considered a landmark feature of this
most advanced, compact and environmental friendly city, circulates downtown and is an
additional convenient travel option. Surprisingly, the tram and numerous buses running in
the city are offering high quality and reliable service throughout the year, even in the cold
winter season with 6 m of snowfall.

Furthermore, Sapporo is well connected via its two existing airports, Okadama and New
Chitose. The former is located in the northeastern part of the city, and it is only for domestic
flights. The latter, New Chitose Airport in Chitose City, around 50km south of Sapporo, is
known as the gateway to the north of Japan due to its capacity. A daily average of 177
domestic and 16 international flights make this airport the 6th busiest in Japan.

Comparing these two airports, New Chitose is better known both in Japan and abroad.
However, according to the history of both airports, Okadama is older as it started to provide
service in 1962. The New Chitose Airport began operating 1988, 20 years later.

As Okadama has only 5 routes including 3 for destinations of Hokkaido, the capacity as an
airport is totally different from the New Chitose. The following figures indicate that the
number of landings at Okadama is 7,734 in 2015, while the number of New Chitose reached
almost 70,000 and more than 20 million passengers used for both domestic and
international flights of this airport. In addition, although New Chitose has recently expanded
its usage records in recent years, both the number of passengers and landings at Okadama
Airport are on a downward trend.
Especially after the All Nippon Airlines withdrew from this airport in 2010, this trend has been
pronounced. As a result, the City of Sapporo is promoting the use of Okadama which has
relatively high accessibility, intends to coexist both through the functional differentiation:
Okadama for the propeller aircraft, and New Chitose for the jet aircraft.

                                              10
Figure 1.6 International destinations from New Chitose Airport as June 2017
Source: Prepared by author based on Hokkaido Government (2017)
Figure 1.7 Number of landings at Okadama and New Chitose, 2006-2015
70,000 64,531
60,000
48,843
50,000
Number of landings
40,000
Domestic, New Chitose
30,000 International, New Chitose
Domestic, Okadama
20,000
9,997
7,732
10,000
2,792
5,779
0
2006 2007 2008 2009 2010 2011 2012 2013 2014 2015
Landings (year)
Source: Ministry of Land, Infrastructure, Transport and Tourism (2016)
11Figure 1.8 Number of passengers at Okadama and New Chitose, 2006-2015
0 .7 5
0 .8 0
0 .7 9 20.00 18.35
17.64
0 .8 0
0 .9 5
15.00
0 .8 4
Number of passengers (million)
1 .0 8
1 .2 8 Domestica, New Chitose
10.00
1 .5 5 International, New Chitose
2 .1 1 Domestic, Okadama
5.00
2.11
0.75
0.18
0.00 0.38
2006 2007 2008 2009 2010 2011 2012 2013 2014 2015
Passengers (year)
Source: Ministry of Land, Infrastructure, Transport and Tourism (2016)
Figure 1.9 Streetcar (tram)
Source: City of Sapporo
121.2 Tourism enterprises
Sapporo City has a total 11,405 establishments of tourism related enterprises. The food and
beverage sector accounts for the majority with 9,777 establishments, and almost half of
these establishments are accumulated in Susukino, which is one of the most popular and
well-known entertainment districts in Japan. Furthermore, between Odori Park and
Susukino, Tanukikoji shopping arcade with a Japanese-like atmosphere attracts tourists
with lots of small restaurants and sundries. All of these spots located on the south side of
Sapporo station, and the tourism consumption concentrates in this area.
Table 1.2 Number of establishments of tourism related enterprises, 2014
City Number of Establishments 2014
Accommodation 391
Hotel and ryokan 225
Other 166
Food and beverage 9,777
Restaurant 9,166
Take-away / catering 611
Transport 1048
Railway 530
Road 43
Air transportation 475
Travel agency 12
Entertainment 177
Total 11,405
Source: City of Sapporo (2016a)
13Figure 1.10 Susukino entertainment district
Source: City of Sapporo
Figure 1.11 Tanukikoji Shopping Arcade
Source: City of Sapporo
14About the accommodation sector, as described in the next chapter, the demand from foreign
visitors has been growing in last 4 years, and many hotels are able to maintain high
occupancy rates, especially in summer season. Based on the increased demand, the
number of accommodations in the city is slightly rising, and the number of rooms and beds
are also increasing in response.
However, in the Jozankei Onsen area which is recognized as a hub for tourist, the number
accommodation facilities have declined slightly over recent years due to a decrease trend in
group travelers. Based on this understanding, the City of Sapporo intends to further develop
activity programs which aim at encouraging visitors to enjoy the abundant outdoor
recreational opportunities.
ns Figure 1.12 Trends in occupancy rate at the city area
100.00
90.00
80.00
70.00
60.00
(%)
50.00
40.00
International hotels
30.00
Other accommodations
20.00
10.00
0.00
APR
APR
APR
APR
APR
JAN
JAN
JAN
JAN
JAN
JUL
JUL
JUL
JUL
JUL
OCT
OCT
OCT
OCT
OCT
2011 2012 2013 2014 2015
Occupancy rate (month)
Note: This table does not include public-administrated accommodation facilities.
Source: City of Sapporo (2016b)
15Figure 1.13 Trend in number of accommodation facilities, 2011-2015
25
24
22 180 169 169
161 159 161
22 160
22 140
120
Number of facilities
100 City area
Jozankei Onsen
80
60
40 25 24 22 22 22
20
0
2011 2012 2013 2014 2015
(year)
Note: The annual data is based on Japanese fiscal year (April to March)
Source: City of Sapporo (2016b)
Figure 1.14 Trend in number of beds, 2011-2015
9097
8639
50,000
8324
43,635
8429 45,000 41,247 41,981 41,826 41,821
8429 40,000
35,000
Number of beds
30,000
City area
25,000
Jozankei Onsen
20,000
15,000
9,097 8,639 8,324 8,429 8,429
10,000
5,000
0
2011 2012 2013 2014 2015
(year)
Note: The annual data is based on Japanese fiscal year (April to March)
Source: City of Sapporo (2016b)
161.3 Key attractions
The City of Sapporo has a variety of tourism resources and it is further diversifying its
tourism product portfolio. The following attractions are the most mentioned in tourist
guidebook and thus the most representative for the destination:
- Sapporo Clock Tower, the most important cultural heritage and a symbol of the city,
originally built as a military drill hall of the Sapporo Agricultural College.
- Former Hokkaido Government Office, an American-neo- baroque-style structure with
red bricks, constructed in 1888.
- Sapporo TV Tower, standing at the east end of the Odori park, the center of the town
overlooking this town.
- Jozankei Onsen, a 150-years historical hot spring destination located southern part of
the center.
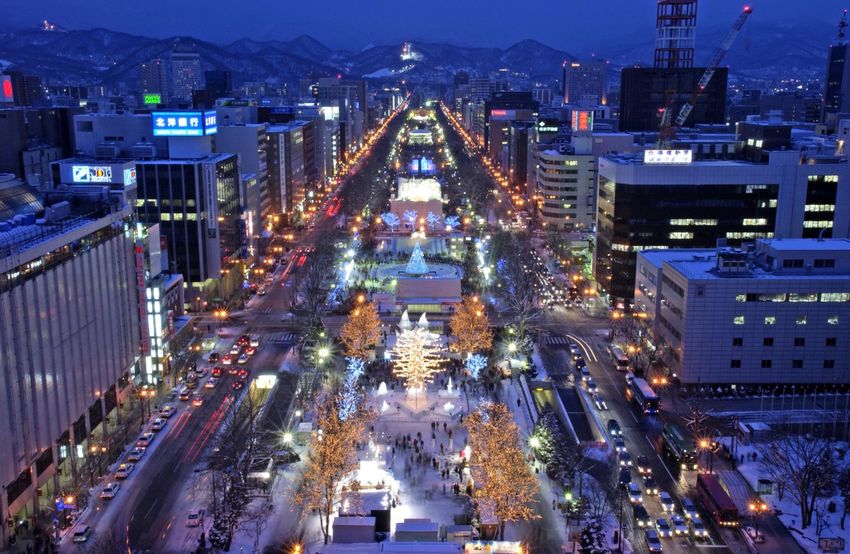
- Odori Park, cutting across the city center, offers the opportunity to enjoy seasonal event
such as summer beer garden and snow festival.
- Hitsujigaoka Observation Hill, the representative tourist spot of the city located on the
top of the hill at a vast green area where national agricultural testing sites accumulated
and known as statues of Clark, museums of the Sapporo Snow festival, restaurants and
souvenir shops.
- Hokkaido University, the first institution for Agricultural Studies in Japan, located in the
center of the city with rich greenery campus.
- Underground walkway, a 1.5 km-underground passageway is distinctive feature and
response to the city’s climate and utilized as a varied space such as shopping malls and
art galleries.
As mentioned above, the rich greenery is also one of the attractions of this city. People
forget to be in a 2-million city when visiting parks and green space as follows:
- Moerenuma Park, its basic design handled by Isamu Noguchi, a worldwide sculptor,
and is intended to be the base of the “Circular Greenbelt Concept” of Sapporo.
- Mt. Moiwa, 531m-high mountain for a spot to enjoy stunning view of the city, especially
at night.
- Mt. Maruyama, located in the western suburbs of Sapporo on the dome-shaped
Maruyama hill, and the virgin oak forest extending on an area of 60,000 m² attracts
17visitors.
In addition, including venues as the legacy of 1972 Olympic, the city has lots of sports
facilities:
- Okurayama Ski Jump Stadium, one of the emblematic sites of the legacy of 1972
Olympic game.
- Ski resorts, a popular tourist attraction in the winter season located only less than 60
minutes from the center.
- Sapporo Dome, all-weather stadium that accommodates up to 53,738 people and is
home to two Professional sports teams, Hokkaido Nippon-Ham Fighters and
Consadole Sapporo.
Events play and important role in Sapporo's destination management. The main events held
in the Odori Park in the center of the city are as follows:
- Sapporo Snow Festival, one of the biggest festivals in Japan that gathers more than 2.6
million people for two weeks and consists of numerous snow monuments.
- YOSAKOI Soran Festival, a dancing event originally from Kochi Prefecture, and it has
developed into a major international event in which over 30,000 dancers from all over
the world participate.
- Sapporo Summer Festival, which allows enjoying the short summer and became
popular for its big beer garden in recent years.
- Sapporo Autumn Fest, event with a relatively short history that saw its first edition in
2008 and is known for its focus on the harvest season and the great variety of locally
produced food from all parts of Hokkaido.
- The Sapporo White Illumination is the first illumination event in Japan started in 1981,
and one of Japan's three major illuminations, with some 520,000 light bulbs.
Last but not least the gastronomy itself is an attraction. Sapporo is known for its food,
especially in Japan, and one of the most popular gastronomic destinations. It is the sacred
place of sushi and ramen which both became Japan's most famous dishes internationally,
and other dishes that are well-known for its high quality of ingredients such as dairy products,
vegetables and seafood. The following dish and places are particularly notable:
- Sapporo ramen, a local food of this city, loved by foodies all over the world and
18becoming an iconic Japanese dish abroad.
- Jingisukan (mutton BBQ), a popular local dish named after the great Mongolian ruler
Genghis Khan.
- Beer, known the city name as a beer’s name, Sapporo is the birthplace of beer in Japan,
and visitors can learn about the process of its production in a museum and brewery
tours.
- Sweets, Hokkaido is known for many manufacturers of high-quality sweets, and their
flagship stores are accumulated in Sapporo.
- Shiroi Koibito Park, a theme park run by Ishiya, a local chocolate company. It is a family
spot featuring samples & exhibits of chocolate & cookies, plus a train ride & garden
area.
- Susukino, the best entertainment district in Hokkaido with lots of bar, restaurants and
shops.
- Central Wholesale Market, defined as a “refrigerator of Hokkaido” where the freshest
produce and fishes are caught every day, and its retail market is very popular for
tourists to find best crab.
Figure 1.15 Sapporo Clock Tower
Source: City of Sapporo
19Figure 1.16 Sapporo Beer Museum
Source: City of Sapporo
Figure 1.17 Shiroi Koibito Park
Source: City of Sapporo
201.4 Tourism trend
According to the latest survey on Tourism Consumption of the City of Sapporo in 2011,
tourism is estimated to bring EUR 2.84 billion on only direct consumption of visitors. 2
Furthermore, tourism generates 3.8% of GDP and 4.1 % of total employment of the city.
In 2015, the city received total of 13.6 million visitors including day trippers and overnight
guests. There is no big change in this proportion within the 5 years since 2011. Considering
the position of Sapporo in tourism of Hokkaido, it is the most important destination in this
prefecture with 10% of the 136.3 million visitors in all the 179 municipalities. Furthermore, in
terms of the number of overnight visitor, Sapporo’s contribution to Hokkaido tourism is much
bigger: It is estimated that 24.5% of all overnight visitors in Hokkaido stay in Sapporo.
Figure 1.18 Number of visitors to Sapporo, 2011-2015 (million)
6 .0 0
5 .8 4
5 .9 6 15.00 13.58
13.47 13.39
14.00 13.03
5 .9 6 13.00 11.98
6 .1 0 12.00
11.00
Number of visitors (million)
10.00
9.00
7.20 7.50 7.43 7.49
8.00
7.00 5.98
6.00
5.00 6.00 5.84 5.96 5.96 6.10
4.00
Total
3.00
Day trip
2.00 Overnight
1.00
0.00
2011 2012 2013 2014 2015
Visitors (year)
Source: City of Sapporo (2016b)
2
Calculated 1 EUR=130 JPY.
21The next figure explains the monthly change of visitors to Sapporo in recent years. In the
first half of 2011, it is clear that the Great East Japan Earthquake affects the declining
tourism demand for Sapporo. However, recovering in the next year, it returns to the "usual
trend": the visitors in summer exceed 1.7 million, and fell to below 0.7 million in winter. Thus,
June which is known as the beginning of flower season is the start of the high season in
Hokkaido and Sapporo, and ends in September when summer vacation is over. As
described later, such fundamental features determine the starting point of the tourism policy
of Sapporo, as for instance the holding of mega events.
Figure 1.19 Number of visitors to Sapporo by month, 2011-2015 (million)
2.00
1.80
1.60
Number of people (million)
1.40
1.20
1.00
0.80
0.60
0.40
0.20
0.00
APR
APR
APR
APR
APR
JAN
JAN
JAN
JAN
JAN
JUL
JUL
JUL
JUL
JUL
OCT
OCT
OCT
OCT
OCT
2011 2012 2013 2014 2015
Visitors (month)
Source: Hokkaido Government (2016)
As shown in the next figure, the number of overnight visitors from abroad has seen a steady
increase compared to a slight decline in the number of domestic overnight visitors. In 2011,
the annual peak of domestic overnight visitors exceeds 700,000, and the difference between
the foreign and domestic is more than 680,000, however, both numbers are at almost same
level in December 2015. The presence of the inbound market is underpinning the low
season of the domestic while the volume of domestic visitors still exceeds inbound in total.
22Figure 1.20 Number of overnight visitors by month and origin, 2011-2015 (million)
0.80
0.70
Number of people (million)
0.60
0.50
0.40
0.30
Domestic overnight visitors
0.20
Foreign overnight visitors
0.10
0.00
JAN
JAN
JAN
JAN
JAN
APR
APR
APR
APR
APR
OCT
OCT
OCT
OCT
OCT
JUL
JUL
JUL
JUL
JUL
2011 2012 2013 2014 2015
Overnight visitors (month)
Source: Hokkaido Government (2016)
Underlined by the next figure, the significance of international tourists for the tourism sector
in Sapporo is increasing. In December 2015, the percentage of foreign visitors in total
overnight visitors reached 49.7%, it means that the inbound market accounts for
approximately half of all the market of the hotel industry in Sapporo. Also, the monthly trend
of foreigners is very interesting. The graph shows clearly two peaks for the months of
December and January.
As explained before, the tourism trend in Sapporo seems to be stable in the last 5 years at
first glance; however, the data for visitors by nationality shows that a drastic change has
occurred.
Promotion of inbound tourism is becoming the most important objective of the national
tourism policy. Nevertheless, Sapporo has already achieved the inbound market to be of big
significance and have the same presence as the domestic market. It is clear that the
inbound market is not the target which the city “should” focus on, is absolutely the “must”
market today.
23Figure 1.21 Percentage of foreign visitors in overnight visitors, 2011-2015 (%)
50.0
45.0
Share of inbound market (%)
40.0
35.0
30.0
25.0
20.0
15.0
10.0
5.0
0.0
APR
APR
APR
APR
APR
JAN
JAN
JAN
JAN
JAN
JUL
JUL
JUL
JUL
JUL
OCT
OCT
OCT
OCT
OCT
2011 2012 2013 2014 2015
Percentage (month)
Source: Hokkaido Government (2016)
Looking at the structure of the inbound market of Sapporo which is rapidly growing, it is
found that four main East Asian markets (China, Taiwan Province of China, Rep. of Korea,
and Hong Kong, China) China stand for 75% of the total. As it is the case for other Japanese
destinations as well, Sapporo depends on the East Asian market on the inbound tourism.
Due to its very rapid and steady growth, China ranks first since 2015. Meanwhile, demand
from South East Asia has also increased in recent years, and the City of Sapporo pays more
attention to this emerging markets.
On the other hand, Sapporo is relatively weak in the non-Asian markets which are more
matured. Even the United States of America, the largest of the non-Asian markets, the share
remains at only 2.3%. From the standpoint of not only diversifying the market but also
promoting the variety of Sapporo City's attraction, the approach to these markets will
become increasingly important from now on.
24Figure 1.22 Number of foreign overnight visitors by nationality, fiscal year 2016 (%)
Other
USA 2.3% 7.5%
Singapore China
3.9% 24.2%
Malaysia
4.1%
Thailand
7.1%
Hong Kong,
China Taiwan Pr. of China
10.1% 21.5%
Rep. of Korea
19.3%
Note: The annual data is based on Japanese fiscal year (April to March)
Source: City of Sapporo (2016b)
Figure 1.23 Number of foreign overnight visitors by nationality, fiscal year 2016 (%)
600,000
550,000 China
506,272
Taiwan Province of China
500,000 Rep. of Korea
450,000 Hong Kong, China 450,727
Thailand
400,000
Number of visitors
350,000 403,122
300,000
250,000 212,445
200,000
150,000
100,000 148,902
50,000
0
2011 2012 2013 2014 2015
Visitors (year)
Note: The annual data is based on Japanese fiscal year (April to March).
Source: City of Sapporo (2016b)
252 Sapporo: Tourism Performance Research Survey Findings
For this research, the five key performance areas are set: destination management,
economic perspective, social and cultural perspective, environmental perspective, and
technology & new business models. In case of Sapporo, destination management and
technology & new business were selected due to following reasons:
- Destination management is currently the most attention-getting area in what regards
tourism in Japan.
- The strategy to control the seasonal fluctuations of tourism flown should be evaluated
and shared through this research.
- Although the Sapporo Tourism Association is not registered as a Japanese style DMO
yet, its multifaceted business development and a high ratio of own financial resource
might be helpful for other domestic and foreign DMOs.
- Sapporo has introduced several initiatives related to sustainable tourism by
technological innovation such as compact city, and smart city initiatives, and the
declaration of Eco capital.
- In the New Industrial Structure Vision compiled by the Ministry of Economy, Trade and
Industry (METI), Sapporo is defined as an advanced case about community
development through information communication technology.
- Considering the need to show the wide range and diversity of Japanese tourism cities'
efforts worldwide in this research, it is very important to differentiate from case study
about Tokyo.
263 Destination Management
Destination management is one of the most noteworthy areas in tourism policy of each city
of Japan today and Sapporo meets almost all criteria established for this. Although it does
not have the specific policy which matches the criteria about sustainable tourism, the City of
Sapporo promotes sustainable community development based on related and superior
policies such as the Environmental Basic Plan, Declaration for Eco Capital and Smart City
Initiative.
3.1 Destination growth strategy
Table 3.1 Performance criteria on destination growth strategy
Performance criteria Yes / no
Existence of a DMO at the destination Yes
Clear vision and governance structure for destination in place Yes
Sustainable tourism policy and regulations within the overall development strategy of the city No
Differentiation of the destination (USP and/or UEP) Yes
Public and private sectors commitment/ involvement Yes
Collaboration with the stakeholders within and across sectors Yes
Regular update of the strategy & action plan Yes
Performance measurement tools in place Yes
Destination management organization and related entities
The next figure shows a comprehensive framework of destination management of Sapporo.
At the national level, Japan Tourism Agency is implementing various tourism policies
through the Hokkaido District Transport Bureau. Japan National Tourism Organization
focuses on promotional activities through overseas offices, travel exhibitions and websites.
At the prefectural level, the Bureau of Tourism of the Hokkaido Government is in charge of
policy making, and at the same time, it operates public private partnership project through
Hokkaido Tourism Organization, the DMO of the prefecture of Hokkaido.
27At the city level, the entity, which manages the biggest budget, is the Tourism & MICE
Promotion Department of the city. It is in charge of policy making as an administrative
department, and promotional activities, tourism resource development and MICE promotion
are also among its responsibilities.
Figure 3.1 Destination management structure
Although the budget is smaller in comparison to the budget allocated for tourism by the City
of Sapporo, the role of the Sapporo Tourism Association (STA) is extremely important in
destination management of Sapporo. STA is the only organization which both the public and
28private sector are committed to. The City of Sapporo provides EUR 0.49 million as a subsidy
to support events coordinated by STA, and private enterprises pay a membership fee. In
addition, the City of Sapporo and Hokkaido government pay a contract fee to the Hokkaido
Sapporo Tourist Information Center Management Council, which is governed by STA, for
outsourcing the management of the main tourist information center located in the terminal
station. As a result, the management of the tourist information center involves four entities
that differ in character and administrative level, and STA is a core player.
Figure 3.2 Sapporo tourist information center
Source: Prepared by author
Furthermore, the management of the official tourist website “Yokoso Sapporo” has been
shifted from the city administration to STA since April 2017. The operation of the website
means that the STA manages one-stop shop of both on-line and on-site.
STA itself has gained EUR 2.33 million in the fiscal year 2016 from entrance fees,
merchandising sales and tenant fees, in Hitsujigaoka Observation Hill which is the most
popular tourist spot of the city. Thus, STA operates its own business to secure the fiscal
stability, business strategy and its continuity. Though STA indirectly receives some amount
29of financial assistance from the City through committee of events and Hokkaido Sapporo
Tourist Information Center Management Council, the direct subsidy to the body of the
association is only 15.6% in 2016 which is low compared to similar entities in other cities
such as Tokyo, Nagoya Osaka and Kyoto where it exceeds 60%. The existence of such kind
of association is very common in Japan; however, STA is unique due to its financial
structure.
Figure 3.3 Yokoso Sapporo website (www.sapporo.travel)
Source: www.sapporo.travel as 5th November
In what MICE is concerned, the department supports promotional activities and coordination
through the Sapporo International Communication Plaza. Sapporo International
Communication Plaza is extra-departmental body of the city. The Mayor of the city is at the
same time chairman of this body and the majority of the budget is covered by subsidies from
the city budget. In that sense, it is one of the important organizations responsible for the
30implementation of the policy on destination management. The annual budget is around EUR
2.5 million and is spent on promotion for international exchange and support for foreign
residents; however, around 80% of the project expenses are dedicated to MICE promotion.
The City itself also has a volunteer guide system with approximately 200 official guides. The
beginning of this system was the training system for volunteer guide started in 1986, and
from 1994, the City has maintained it and provided free guiding service at tourist information
centers.
About the volunteer guide, the Sapporo Chamber of Commerce and Industry as a private
sector association operates the system as well, and it implements measures to improve
hospitality service of its member enterprises. Particularly, its volunteer guide system in
particular is a key in considering Sapporo's destination management. As mentioned above,
Sapporo has a remarkable multilayered attractiveness as a city destination, and the
existence of guides is indispensable in order to connect its resource to customer
satisfaction.
Sapporo Chamber of Commerce and Industry conducts the certification of the city guides
once a year, and it has developed a system to manage the pool of guides for guiding
services. Currently, it offers two types of guiding: services corresponding to requests from
travel agents and free guidance at each tourist spot in the city. As can be seen from the
figure below, the results of the guided tour are also almost flat while the number of tourists to
Sapporo is sluggish. According to the organization, they intend to develop a nighttime
guiding service and to improve the guiding in foreign languages.
Sapporo is not only a 2-million-city, but it is the administrative capital of Hokkaido. In that
sense, it is pointed out that Sapporo’s specific feature in relation to destination management
is its multilayered framework not only in the horizontal direction with public and private
sectors in the city, but also in the vertical direction with the country and the prefecture. In
such a complicated structural framework, STA plays an extremely important function. It can
be said that it is an example of multilayered and multifaceted destination management
scheme, and it is totally different from DMO scheme by integration and concentration shown
in various countries around the world. Although the Sapporo Tourism Association (STA) has
not applied to become a “Japanese style DMO”, a new innovative concept promoted
31nationwide as a national policy by Japan Tourism Agency (JTA), it has proven that it covers
the function of a DMO to a great extent.
Figure 3.4 Trend in volunteer guide service, 2013-2016
sp o ts
100,000 92,421 500
90,000 82,927
79,689 80,060
80,000 400
Number of visitors
Number of guides
70,000
60,000 300
50,000
177
40,000 160 200
145 148
30,000
20,000 100
Number of visitors guided at tourist
10,000 spots
0 0
2013
2014
2015
2016
(year)
Source: Interview with Sapporo Chamber of Commerce and Industry
Superior visions of the destination management policy
The City of Sapporo indicates its destination management policy in the “Sapporo Tourism
City Development Plan” formulated in 2014 and the plan is positioned under the two political
visions: The Strategic Vision for City Development and the Industrial Development Vision.
The goal of the Strategic Vision for City Development is to improve the attractiveness, vitality,
and the quality of life, and the conceptual image which it aims to realize, was defined in the
Vision: “the world admired city which creates Hokkaido’s future” and “the symbiotic city with
diversity and spiritual richness”. Based on this, the vision includes 8 basic strategies and 25
concrete policies.
32Tourism is one of the most frequently appearing keywords in this vision, and its significance
and the role it plays in city development are mainly mentioned as follows:
- Tourism as a driving force to lead the industry advancement by utilizing local resources
and to enhance competitiveness as a city.
- Sapporo must create new forms of city tourism with a variety of resources and
maximize its economic impact.
- Tourism links local industry and creative industry through tourism.
- Sapporo is able to enhance the collaboration with other municipalities in Hokkaido.
- Tourism is a core of city promotion.
- Improvement of public transportation is important from the destination competitiveness
as well as city development.
- Integration and sophistication of urban functions contribute to tourism.
- Promotion of agro-tourism is effective for conservation of agricultural land.
On the other hand, the Industrial Development Vision focuses on the more economic
perspective of tourism in Sapporo and tourism is clearly emphasized as one of the priority
areas with food, environment (energy), health and welfare/medical, and information
technology and creative industry.
In addition, the following are identified as the basic strategies of tourism area.
- Basic Policy 1:
Development of more local and more unique tourism resources
- Basic Policy 2:
Promotion by utilizing various media; improvement of facilities and services for foreign
visitors.
- Basic Policy 3:
MICE promotion by utilizing the rich tourism resources and its urban function.
In addition, as the umbrella strategy of it, the city has formulated a concept of destination
management. This 10-year plan from fiscal year 2013-2022 shows the goal of destination
management: the collaborative tourism development by public private academic
partnership.
33Figure 3.5 Framework of destination management related policies and strategies
January, 2000 October, 2013
Long-term Comprehensive Plan Strategic Vision for City Development (-2022)
March, 2011 January, 2017
Industrial Development Vision (revised)
Industrial Development Vision
(-2022)
January, 2012
City Promotion Strategy
March, 2014
Global Strategic Plan (-2022)
March, 2014
Sapporo Tourism City Development Plan (-2022)
March, 2015
Initiative for Tourism Development of Jozankei Area (-2024)
April, 2015
Comprehensive Strategy on MICE Promotion
(-2019)
2000 2011 2012 2013 2014 2015 2016 2017
According to this plan, the City concludes the current situation of tourism in Sapporo as
following:
- Due to the declining population in Hokkaido, the intra-prefectural tourism market will
shrink more and more, and it is necessary to develop new market.
- Since the growth of the inbound market in the future is expected to come mainly from
34East Asia, the city will collaborate with JTA and Hokkaido Government for effective
promotional activities.
- On the other hand, to avoid economic and political risks, the target market must be
diversified and defines that Europe, USA, Australia and Russia will be the next target.
- The MICE segment is vital to make the tourism sector more stable and competitive, and
in order to catch up other advanced cities, the city will enforce the political support for
hosting MICE events and improving venues.
- The organization of events is an effective means to expand the economic effect of
tourism and it is important to increase awareness of events other than Sapporo Snow
Festival and YOSAKOI Soran Festival in Tokyo, Osaka and Nagoya, so that the city will
be recognized as an all-year-around event destination.
- Increasing the number of direct international flight and improving accessibility to/from
Sapporo within Hokkaido will enable the city to enhance the function as a hub.
- In order to increase the economic effect of tourism, it is necessary to expand the
number of visitors and extend the duration of stay in the city.
- At the same time, it is necessary for citizens themselves to discover tourism resources
and promote its attractiveness for maintaining domestic demand.
- For the efficient and continuous growth as a destination, improvement of satisfaction
level and repeat visitation rate are indispensable.
- Contribution by citizens to the diversification of tourism resources leads to responding
to the demand from visitors and it will strengthen the competitiveness as a destination.
Based on this understanding, the City of Sapporo developed the basic policy of destination
management as “finding Sapporo style tourism”.
The Sapporo Style is defined as three basic principles and includes:
- Locals become key actors by discovering, learning and enjoying Sapporo.
- More information leads to more emotion of visitors.
- Providing visitors opportunities to touch the tips to enjoy Sapporo.
Destination Marketing and Positioning
Considering the consolidated and challenging seasonality pattern, the events and festivals
have an extremely important role in Sapporo’s development strategy. It is a very common
35approach to hold a short-period event to increase the number of tourist in a specific season,
however, in the case of Sapporo, the city trys to fill the calendar with events throughout the
year. The existence of Odori Park, created by the grid-like urban plan that imitated Kyoto,
and its size of the economy as a 2-million-city, enable Sapporo to follow such strategy.
Table 3.2 Event calendar of Sapporo
Number of visitors
Event name Jan. Feb. Mar. Apr. May June July Aug. Sep. Oct. Nov. Dec. 2016 (million)
1
Sapporo Ramen Show 0.1
Sapporo Lilac Festival 0.7
YOSAKOI Soran Festival 2.1
Sapporo Flower Festa NA
2
Sapporo City Jazz 0.2
Sapporo Summer Festival 2.0
Sapporo Autumn Fest 2.2
Sapporo Chrysanthemum Festival NA
Sapporo White Illumination NA
3
German Christmas Market in Sapporo 1.4
Sapporo Snow Festival 2.6
1) Nippon Ramen Association (2016)
2) Data for 2017
3) Data for 2015. City of Sapporo (2017c)
Note: The table contains only events held in Odori Park and its surrounding area.
Source: City of Sapporo (2016b)
From a marketing perspective, the scale and constancy of the events are extremely
important. The fact that the events are always being held in the city center connects them to
the city’s entertainment and dynamics. This image is being transmitted as city image to the
markets by media and the visitors act as multipliers in word of mouth promotion and by doing
so continue to evoke travel demand. At the same time, the fact that the citizens maintain the
initiatives and ownership of events, it leads to create the image of rich urban life. As
mentioned before, the concept of destination management is “finding Sapporo style tourism”
and the key function of the events is not attracting many tourists, but creating the image of a
livable city with abundant attractions shaping the appeal of the city life and urban
characteristics in Sapporo as a 2-million city, the national park and the hot spring area
coexist. All stakeholders involved in destination management consider the civic life is the
greatest attraction in the destination’s marketing and positioning.
36In recent years, Sapporo promotes its night-time appearance as a new tourist attraction;
however, it does not mean exclusively create an attraction for tourists. The citizen
themselves enjoy the "light of the town" on a daily basis, and they just open a part of it to
tourists. The source of attractions which leads to Sapporo's competitiveness as a
destination is created inside the civil life, not by short-term campaign or mega events aimed
at attracting lots of tourist.
Figure 3.6 Framework of destination management related policies and strategies
Source: City of Sapporo
Public Private Academic Partnership
Sapporo is the main city of Hokkaido, and many headquarters of enterprises are located in
this city. Since they run the business from Sapporo as retailers, industrial manufacturers or
as financial service or banking providers, they are strongly rooted in the region. They
emphasize on their local spirit and character and in that sense, are very committed and
actively collaborate with public sector entities, in particular in recent years. For example,
“porocle”, a cycle sharing system in Sapporo which will be explained more I ndetail in a later
chapter, has been operating since 2008 as a corporate social responsibility project by
37Docon Co., Ltd, a general construction consultant company based in Sapporo. Also, the
North Pacific Bank, LTD. and Sea and Nissenren S-CORT Co. Ltd, a local credit card
company, have been participating in the development of city guide map for foreign individual
travelers (FIT) through the Society for Promotion of Creative Tourism from 2015.
Also known as one of the 7 former imperial universities established by Meiji government,
Hokkaido University exerts a certain presence in policy making, and other universities and
public and private institutions do as well. The existence of Academia greatly contributes to
the innovation of Sapporo as a tourist city.
For example, a consortium composed of private sector entities and universities is actively
involved in the ICT utilization project, described in the next chapter about technology & new
business model. In addition, the Society for Promotion of Creative Tourism is also a unique
public private academic initiative in Sapporo. It has been founded with the objective of
providing research and allows individual collaborators such as students, professors, officers
of the municipal administration and employees of various private enterprises to contribute
and join the Society as a researcher. This approach enables participants to engage to
tourism policy of the city from academic perspective, and leads to development of landmark
and strategic tourist spots and new business model in the city.
383.2 Visitor satisfaction
In Sapporo, a survey on tourist satisfaction is conducted on an annual basis. The city adopts
two different methods for each market: on-line research for Japanese tourist a face-to-face
interview for foreign tourists. The questionnaire includes following subjects:
- Basic demographic data including annual income
- Experience of visit to Hokkaido and Sapporo
- Duration of stay
- Destinations and route
- Number of group
- Purpose of visit
- Arrangement of travel
- Expenditure
- Information source
- Satisfaction level
- Transportation
- Intention for repeat visits
- Awareness level for events
- Destination image of Sapporo
Table 3.3 Performance Criteria on visitor satisfaction
Performance criteria Yes / no
Repeat visitation (within 5 years) / recommendation Yes
Analysis of the visitor satisfaction with different elements of destination Yes
Analysis of the visitor satisfaction with their overall experience at the destination Yes
Repeat visitation
According to the survey, the repeat visitation rate of foreign visitors has grown in those five
years. The rate, which was only 30% in 2012, increased by more than 10 points in 5 years,
to 41% in 2016. The reason for the small decrease in the share in 2016 seems to be
attributable to the increase of tourists from Republic of Korea. In this year, lots of low cost
39careers (LCC) began to operate direct flight to New Chitose airport and expanded a
relatively young segment which consists of travelers that had not visited Hokkaido yet due to
the travel cost.
On the other hand, more than 70% of domestic tourists have visited Sapporo more than one
time. As many Japanese companies have branch offices in Sapporo, the demand of
business travel is relatively high and it leads to high repeat visitation rate. In addition,
Hokkaido’s certain share in school educational trip for a few decades, contributes to this
number.
Figure 3.7 Repeat visitation rate of foreign tourists 2012-2016
100.0
1st-time visitors / repeat visitors (%)
90.0
33.6%
80.0 39.8% 40.6% 41.6%
47.6%
70.0
60.0
50.0
40.0
66.3%
30.0 60.2% 59.3% 58.4%
52.4%
20.0
10.0 Repeat visitors
1st-time visitors
0.0
2012 2013 2014 2015 2016
(year)
Source: City of Sapporo (2016b)
Visitors satisfaction
The City of Sapporo’s surveys on satisfaction consists of different subjects by international
and domestic tourists. The result is utilized as a reference for deciding on priorities of the
tourism policy for the next fiscal year.
The next figure explains the trend of satisfaction of international tourists. Comparing the
percentage of Wi-Fi to other subjects, it is very clear that the Wi-Fi service cannot satisfy the
demand. It seems that the City needs to improve the quality of Wi-Fi connection, as the
satisfaction level has been increased in recent years. Except the Wi-Fi, the satisfaction level
of all the subjects reach almost 95 %.
40Figure 3.8 Repeat visitation rate on domestic tourists 2012-2016
100.0
1st-time visitors / repeat visitors (%)
90.0
80.0
70.0
68.8% 68.4% 67.3% 70.4% 67.9%
60.0
50.0
40.0
30.0
20.0
31.2% 31.6% 32.7% 29.6% 32.1%
10.0 Repeat visitors
1st-time visitors
0.0
2012 2013 2014 2015 2016
(year)
Source: City of Sapporo (2016b)
Contrary to foreign international tourists, the satisfaction level of domestic tourists tends to
decline slightly. Except for accessibility, the rate exceeds for 80% and it remains in relatively
high standards, however such kind of data shows the necessity of continuous efforts for
destination management. As mentioned before, not only the City of Sapporo, but also other
related entities collaborate on the management. The STA started to enhance the official
website and the Sapporo Chamber of Commerce and Industry continues to elevate the
service quality of private sector.
Table 3.4 Visitors satisfaction in international tourists, 2012-2016 (%)
Subject 2012 2013 2014 2015 2016
Wi-Fi NA NA 78.8 63.7 65.8
Sapporo Snow Festival 96.5 94.4 95.5 95.3 96.1
Hospitality NA NA NA 96.0 97.5
Tourist information 90.7 94.0 95.8 93.3 94.5
Overall 96.1 94.2 96.6 97.1 98.0
Note: Satisfaction level is defined as the total percentage of people who chose 1 or 2 on a five-point scale.
Source: City of Sapporo (2016b)
41Table 3.5 Visitors satisfaction in domestic tourists, 2012-2016 (%)
Subject 2012 2013 2014 2015 2016
Tourist information 86.8 88.1 90.6 86.4 81.7
Hospitality 87.6 89.0 90.8 86.9 81.7
Accessibility 84.4 82.3 85.5 83.5 79.6
Jozankei Onsen 93.8 95.8 93.9 89.0 89.3
Overall 91.4 92.5 92.5 89.1 85.6
Note: Satisfaction level is defined as the total percentage of people who chose 1 or 2 on a five-point scale.
Source: City of Sapporo (2016b)
424 Technology and new business model
Already back in the 1950s, at the beginning of the computer era, lots of companies doing
business in data processing services, storage servers and software development have
successfully established in Sapporo. Nowadays Sapporo is the ICT (Information and
Communication Technology) cluster in the eastern part of Japan apart from Tokyo. In
addition, the reputation and self-image as an environmentally conscious and advanced city
has paved the way for the introduction of the smart city concept and ICT based city
management. Sapporo is one of the most technology-savvy cities, and this given framework
conditions contribute to the smart destination management of the city.
In addition, it is also a great advantage of Sapporo that the global enterprises in the
information-related fields are positively committed to community development, such as
Crypton Future Media, INC. which is known for “Hatsune Miku”, a humanoid persona voiced
by a singing synthesizer.
4.1 Peer economy
3
As the declaration of “Eco Capital Sapporo” in 2008 indicated already, the city had
implemented various measures and strategies to mitigate the environmental impact of urban
city life for many years. Furthermore, as the population decreases and the economic scale
shrinks, the improvement of productivity and the efficiency of civil life is the most important
issue for Sapporo. From this perspective, the promotion of the peer-to-peer economy is
essential component on policy of all areas.
However, among the criteria of this survey, Sapporo has not been evaluated efficiently due
to the regulations by the government. For example, car sharing services such as Uber have
expanded globally; however, they still provide limited services in only some areas or are
restricted to participation in pilot projects in Japan. Although Sapporo City is very active in
promoting the peer-to-peer economy, it is still in the initial stage on the national level. It
seems difficult to measure the performance based on common indicators on a global level.
3
City of Sapporo (2008)
43Table 4.2 Performance Criteria on Peer Economy
Performance criteria Value Year Source
Number of shared accommodations 1,263 2017 AirLABO1
Existence of car and bike sharing platform NA Yes
Number of shared bicycles per capita 0.0002 2017 porocle
Number of shared vehicles per capita 0.0002 2017 Times24 Co., Ltd.
Existence of Car-pooling NA
th
1) The number based on AirLABO(http://airlabo.jp/)as to 6 November.
Shared accommodation is currently the hottest topic in the tourism industry in Japan. For
many years, national regulations did not allow to provide accommodation service in general
housing facilities, however some conditions have been relaxed by the amendment of the law
in 2017. As well as it is the case in other famous destinations, the number of available
accommodation of that kind tends to increase in recent years in Sapporo. It reaches 1,263 in
November 2017 and it is expected to grow.
On the other hand, the significance of shared car and vehicle services are still very limited.
Although the City of Sapporo has played a leading role in this area due to the designation as
a special regulatory zone for car sharing by the Ministry of Internal Affairs and
Communications in 2005, only 360 cars are being provided through providers today.
As far as shared bicycle services are concerned, a private company runs this business in
Sapporo. Docon Co., Ltd, a general construction consultant company, started this activity in
2011. The project has initially taken off as a corporate social responsibility (CSR) project
after a pilot phase and discussion for two years. Named “porocle”, it is a commercial activity
run by the company, and at the same time, it has a character of a public, private and
academic partnership from the beginning. The bicycle ports were set in public spaces such
as public roads, in proximity to the city hall and the tourist information center. In addition,
university students are still involved in the operation as for instance ticket sales, promotional
activities and the maintenance of the bicycles.
Although the business is facing some limitations due to the climate conditions which lead to
snow covered roads from December to April, the number of users has steadily grown. In
44You can also read