UPDATES OF 'AW3D30' ALOS GLOBAL DIGITAL SURFACE MODEL WITH OTHER OPEN ACCESS DATASETS
←
→
Page content transcription
If your browser does not render page correctly, please read the page content below
The International Archives of the Photogrammetry, Remote Sensing and Spatial Information Sciences, Volume XLIII-B4-2020, 2020
                                                 XXIV ISPRS Congress (2020 edition)

              UPDATES OF ‘AW3D30’ ALOS GLOBAL DIGITAL SURFACE MODEL
                        WITH OTHER OPEN ACCESS DATASETS

                      Junichi Takaku 1, *, Takeo Tadono 2, Masanori Doutsu 1, Fumi Ohgushi 1, and Hiroki Kai 1
1
  Remote Sensing Technology Center of Japan, Tokyu REIT Toranomon BLDG 3F, 3-17-1 Minato-ku Tokyo, Japan –
                                 (takaku, fumi_og, dotsu_masanori)@restec.or.jp
 2
   Earth Observation Research Center, Japan Aerospace Exploration Agency, 2-1-1 Sengen, Tsukuba, Ibaraki, Japan -
                                              tadono.takeo@jaxa.jp

                                                     Commission IV, WG IV/3

KEY WORDS: Three-Line, Stereoscopic, Satellite, Optical, High resolution, DEM/DTM

ABSTRACT:

In 2016 we first completed the global data processing of digital surface models (DSMs) by using the whole archives of stereo
imageries derived from the Panchromatic Remote sensing Instrument for Stereo Mapping (PRISM) onboard the Advanced Land
Observing Satellite (ALOS). The dataset was freely released to the public in 30 m grid spacing as the ‘ALOS World 3D - 30m
(AW3D30)’, which was generated from its original version processed in 5 m or 2.5 m grid spacing. The dataset has been updated
since then to improve the absolute/relative height accuracies with additional calibrations. However the most significant update that
should be applied for improving the data usability is the filling of void areas, which correspond to approx. 10% of global coverage,
mostly due to cloud covers. In this paper we introduce the updates of AW3D30 filling the voids with other open-access DSMs such
as Shuttle Radar Topography Mission (SRTM) Digital Elevation Model (DEM), Advanced Spaceborne Thermal Emission and
Reflection Radiometer Global DEM (ASTER GDEM), ArcticDEM, etc., through inter-comparisons among these datasets.

                     1. INTRODUCTION                                 rainforest areas and the snow/ice on the polar areas respectively,
                                                                     as well as in some parts of northern Africa due to the large
The elevation map of terrain is fundamental data for many            desert. We decided to generate the void-fill version of the
geoscience applications e.g., ortho-photo processing,                AW3D30 by using the other open-access digital elevation
infrastructure design, disaster monitoring, environment              models (DEMs) through inter-comparisons among these
monitoring, natural resources survey, and so on. In 2016 we          different datasets. The process includes some quality updates
first completed the global data processing of digital surface        with detecting / filtering of noise in the original data. In this
models (DSMs) by using the whole archives of stereo imageries        paper we report on the details of the void-filling process for the
derived from the Panchromatic Remote sensing Instrument for          AW3D30.
Stereo Mapping (PRISM) onboard the Advanced Land
Observing Satellite (ALOS) (Takaku et al., 2016). The software                       2. INPUT DEM DATASETS
was exclusively developed for the full-automatic operation of
mass data processing based on a traditional optical                  The Shuttle Radar Topography Mission (SRTM) DEM 1 arc-
photogrammetry. The dataset was named ‘ALOS World 3D                 sec version 3 (SRTM-1 ver.3) (Rodriguez et al., 2006) was
(AW3D)’, and has 5 m or 2.5 m grid spacing utilizing the             mainly used in the void-filling. The SRTM DEM was generated
optical triplet stereo imageries in 2.5 m resolution while its       from the interferometric processing of C-band radar onboard
accuracy was confirmed at 5 m (rms) in vertical and also 5 m         the space shuttle in 2000, covering land areas between N60°
(rms) in horizontal. Its low resolution version of 1 arc-sec         and S56° with 1 arc-sec grid spacing. The original SRTM DEM
(approx. 30 m on the equator) grid spacing (i.e., AW3D30) was        also includes some void areas especially in steep mountainous
then generated from the original version and was freely released     region; they were filled with Advanced Spaceborne Thermal
to the public (Tadono et al., 2016). The dataset has been            Emission and Reflection Radiometer Global DEM Version 2
updated since then to improve the absolute/relative height           (ASTER GDEM ver.2) (Tachikawa et al., 2011) and Global
accuracies with additional calibrations (Takaku et al., 2017,        Multi-resolution Terrain Elevation Data 2010 (GMTED 2010)
Takaku et al., 2018). However the most significant update that       in the SRTM-1 ver.3.
should be applied for improving usability of the data is the         The Geospatial Information Authority of Japan (GSI) 10 m
filling of void areas, which correspond to approx. 10 % of           mesh DEM (GSI10m) (Tachikawa et al., 2011) was used only
global land coverage, mostly due to cloud or snow/ice covers in      in Japan instead of the SRTM. The GSI10m is digital terrain
source PRISM imageries. Figure 1 shows the global coverage of        models (DTMs) in 0.4 arc-sec (approx. 10 m) grid spacing
the AW3D30 which consists of total 24,430 1°x1° tiles. The           derived from contour lines of 1/25,000 maps created by the
void areas are mainly distributed in the equator zone and high-      traditional aerial photogrammetry, covering whole land areas in
latitude zones due to the heavy cloud coverage on the tropical       Japan.

* Corresponding author

                                                This contribution has been peer-reviewed.
                  https://doi.org/10.5194/isprs-archives-XLIII-B4-2020-183-2020 | © Authors 2020. CC BY 4.0 License.              183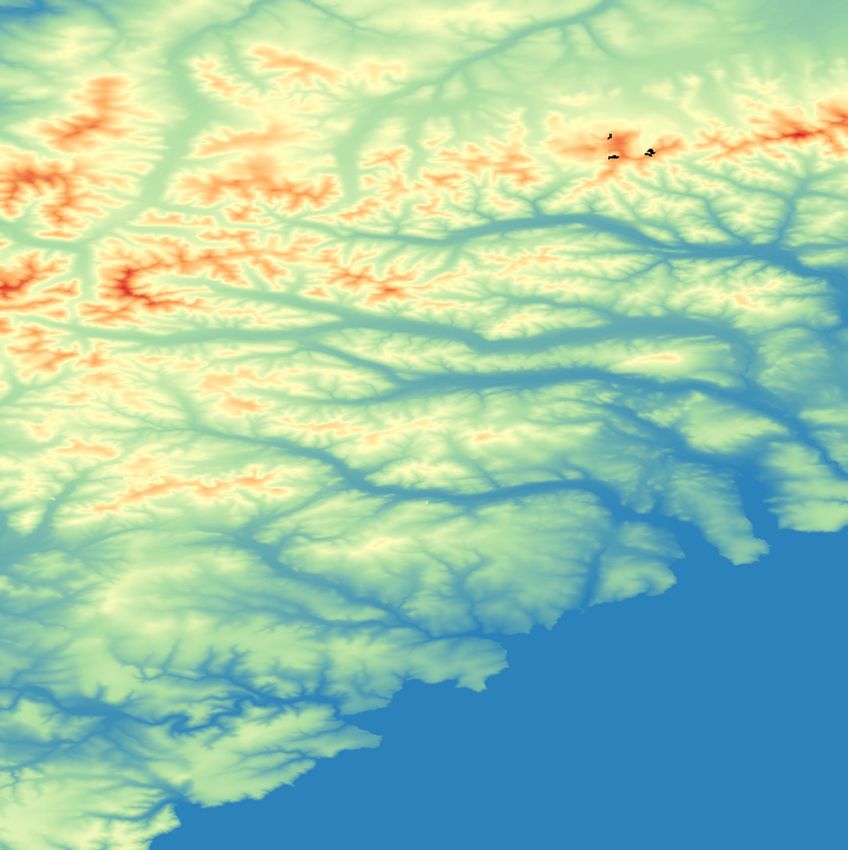
The International Archives of the Photogrammetry, Remote Sensing and Spatial Information Sciences, Volume XLIII-B4-2020, 2020
XXIV ISPRS Congress (2020 edition)
Figure 1. Global coverage of the original AW3D30. Black areas correspond to the voids.
The ArcticDEM (Porter et al., 2018) was used for filling the used two 1°x1° tile areas for the comparison: N65W018 in
voids in areas north of N60° and in some other areas of northern Iceland and N78W069 in Greenland. Both tiles include various
high latitudes i.e., Alaska Peninsula, Aleutian Islands and types of terrain in a height range of approx. 0 ~ 1700 m, while
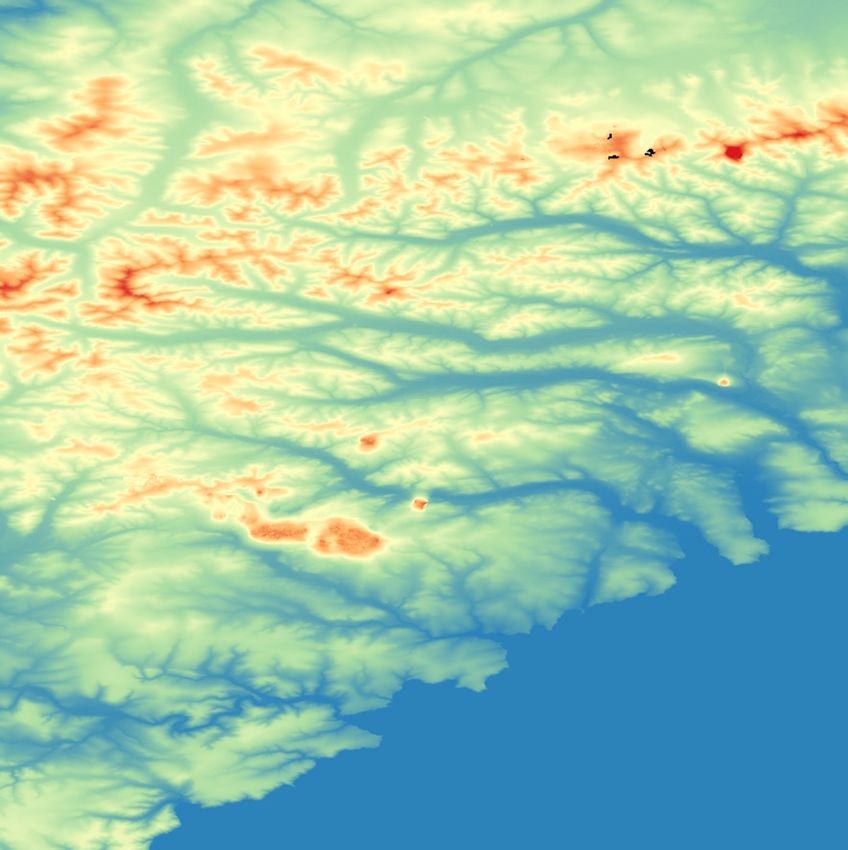
Kamchatka Peninsula. The data were derived from in-track and the southern half of N78W069 is covered by large ice-sheets.
cross-track optical stereo imageries of high-resolution (~ 0.5 m) Figure 2 and 3 show the comparisons of height maps in shaded-
commercial satellites i.e., WorldView series and GeoEye-1. relief with void masks among the AW3D30, the GDEM ver.3,
The dataset covers all land area north of 60°N; however it also the ArcticDEM ver.3 and the TDX 90m DEM for the tiles of
includes some void areas. We used the both of the version 2 N65W018 and N78W069 respectively. In the tile of N65W018
mosaic, which has the grid spacing of 5 m, and the latest there are void areas in both of the AW3D30 and the ArcticDEM
version 3 mosaic, which has the grid spacing of 2 m, for the ver.3, whereas there are no voids in other two datasets.
void-filling after their inter-comparison with other datasets. In the inter-comparison the ArcticDEM and the TDX 90m
The ASTER GDEM ver.3 (NASA et al., 2019), which was DEM are down-sampled and up-sampled respectively into 1
released in 2019 with some quality updates from the GDEM arc-sec geodetic latitude-longitude frame of AW3D30, while
ver.2, was used in the north polar areas and in some other low- the GDEM is resampled into the same frame compensating the
middle latitudes where the quality of SRTM-1 ver.3 was shift of half pixels derived from the difference of grid
relatively low. The data were generated from the along-track definitions between the GDEM and the AW3D30. The WGS84
optical stereo imageries of 15 m resolution, covering land areas ellipsoidal heights of the ArcticDEM and the TDX 90m DEM
between N83° and S83° with 1 arc-sec grid spacing. are converted to EGM96 orthometric heights of other two
The TerraSAR-X add-on for Digital Elevation Measurement datasets. The relative height difference from the AW3D30 is
(TanDEM-X) 90m DEM (Wessel et al., 2018) was used calculated in each of other three datasets.
especially in north polar areas as well. The data were generated Figure 4 and 5 show the height difference images and their
from the interferometric processing of X-band bistatic radar histograms of 1 m interval respectively in the two tile areas,
onboard the twin satellites flying in close formation, covering while Table 1 and 2 show their statistics. In both tiles there are
all global land areas from pole to pole. It has the grid spacing of negative average errors for all compared DSMs, which mean
3 arc-secs (approx. 90 m on the equator) as the low-resolution that the heights of AW3D30 are higher than others. They are -
version of the original data which has 0.4 arc-sec grid spacing. 23 m to -7 m in the GDEM ver.3, and are -3 m to -2 m in other
In south of 56°S including Antarctica we have a plan to use two datasets. From Fig. 4 it is confirmed that there are some
Reference Elevation Model of Antarctica (REMA) DSM large error segments in the GDEM ver.3 especially at the
(Howat et al., 2019) as well as the TanDEM-X 90m DEM and southern parts of both tiles. In the tile of N65W018 the errors
the ASTER GDEM for filling the large void areas, though the mostly exceed -100 m and cause the standard deviation of 39 m
data are still in our preliminary validation. in Table 1. In the tile of N78W069 the errors in the southern
Other than the existing DEM datasets mentioned above we part are positive with some systematic patterns that may be
optionally generated additional DSMs from PRISM imageries derived from some processing noise, e.g., filtering of original
that have over 30 % cloud covers for the void-filling while the artifacts. This is reflected to the standard deviation of 14 m in
original AW3D was generated only from the imageries that Table 2 as well. In the TDX 90m DEM systematic errors along
have less than 30 % cloud covers. with original terrain are observed in Fig. 4; these are considered
to be derived from the difference of the grid spacing and are
3. DEM INTER-COMPARISON reflected to the difference of standard deviations between 9 m
and 4 m in Table 1 and 2 respectively because the tile
The inter-comparison among different datasets was performed N65W018 includes steeper terrain. In the tile of N78W069 the
for north polar areas where any of the ArcticDEM, the GDEM negative errors of TDX 90m DEM in the southern part are
ver.3, or the TanDEM-X (TDX) 90m DEM is available. We relatively larger than the ones of ArcticDEM ver.3, and are
This contribution has been peer-reviewed.
https://doi.org/10.5194/isprs-archives-XLIII-B4-2020-183-2020 | © Authors 2020. CC BY 4.0 License. 184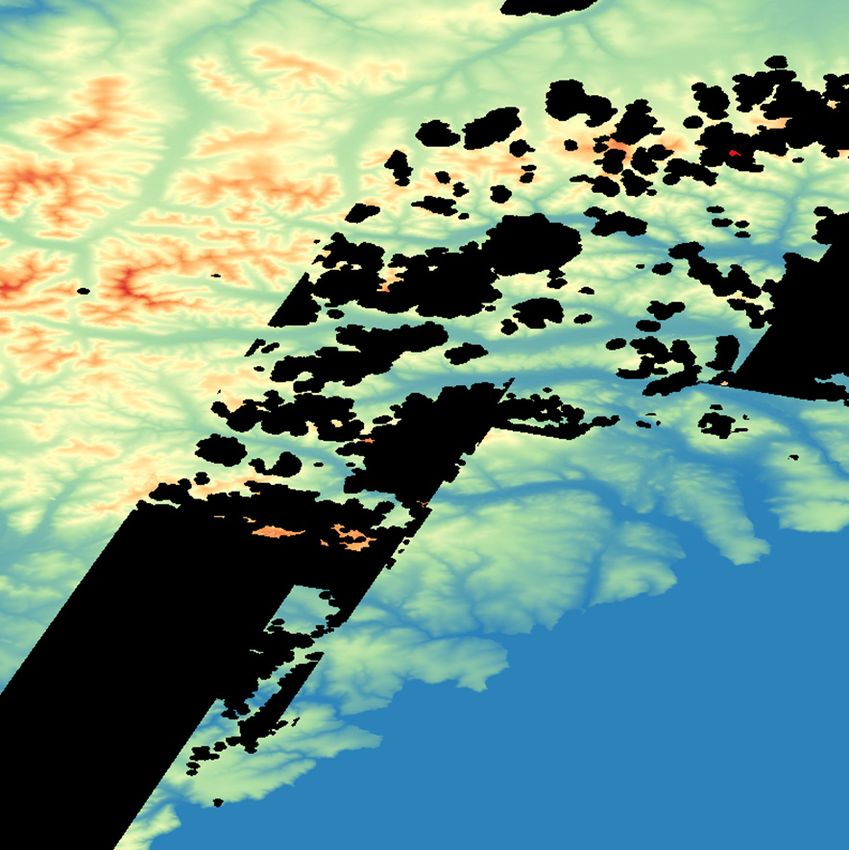
The International Archives of the Photogrammetry, Remote Sensing and Spatial Information Sciences, Volume XLIII-B4-2020, 2020
XXIV ISPRS Congress (2020 edition)
(a) (b)
‐30m +/‐0m +30m : voids
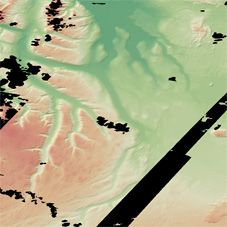
Figure 4. Height differences from AW3D30.
Top: N65W018, Bottom: N78W069, Left to right: ASTER
GDEM ver.3, ArcticDEM ver.3, TDX 90m DEM.
25 40
GDEMv3
ArcticDEMv3
(a) 35
GDEMv3
ArcticDEMv3
(b)
20
(c) (d) TDX90mDEM
30
TDX90mDEM
count (x 100000)
count (x 100000)
: voids 15 25
0m height 1200m
20
Figure 2. Comparison of DSMs in N65W018. 10
15
(a) AW3D30, (b) ASTER GDEM ver.3, 5
10
(c) ArcticDEM ver.3, (d) TDX 90m DEM. 5
0 0
‐40 ‐30 ‐20 ‐10 0 10 20 30 40 ‐40 ‐30 ‐20 ‐10 0 10 20 30 40
Height difference from AW3D30 in meters Height difference from AW3D30 in meters
Figure 5. Histograms of height differences from
AW3D30. (a) N65W018, (b) N78W069
datasets No. of grids ave.[m] std.dev. [m] max.[m] min.[m]
ASTER GDEM v3 11650333 -23.04 39.40 198 -825
ArcticDEM v3 11490632 -1.64 4.90 249 -809
TDX 90m DEM 11650333 -1.94 9.05 213 -808
Table 1. Statistics of height differences in N65W018.
(a) (b)
datasets No. of grids ave.[m] std.dev. [m] max.[m] min.[m]
ASTER GDEM v3 12960000 -6.52 14.32 294 -460
ArcticDEM v3 12960000 -1.52 3.24 257 -455
TDX 90m DEM 12960000 -2.92 4.35 253 -456
Table 2. Statistics of height differences in N78W069.
which the standard deviations are approx. 5 m and 3 m in the
two tile areas, though there are some void areas.
As the result we decided to use the ArcticDEM ver.3 as the first
priority for the void-filling in north polar areas. The ArcticDEM
ver. 2 is used as the second priority in areas where the ver. 3 is
(c) (d) void. For the third priority we use the ASTER GDEM ver.3,
0m height 1400m while the TDX 90m DEM is used as the fourth, considering the
Figure 3. Comparison of DSMs in N78W069. consistency of the original grid spacing and of the error trends
(a) AW3D30, (b) ASTER GDEM ver.3, on the ice-sheets, though it includes large error segments in
(c) ArcticDEM ver.3, (d) TDX 90m DEM. some areas; they are manually checked and are excluded in the
void-filling process.
reflected to the two peaks (-1 m and -6 m) of the histogram in 4. SEA MASK CORRECTION
Fig. 5 (b). The difference of errors may possibly be caused by
the temporal changes among the acquisitions of source data in The sea areas in the AW3D are originally masked by using the
the compared DSMs on the large ice-sheets. The penetration of existing global water-body-data in public domain i.e., SRTM
X-band radar signal on the ice-sheets may be another possible Water Body Data (SWBD) (NASA/NGA, 2003) or Global Self-
cause of the difference (Abdullahi et al., 2019). The ArcticDEM consistent, Hierarchical, High-resolution Shoreline Database
ver.3 has smallest relative height errors from the AW3D30, (GSHHS) (Wessel et al., 1996). However we found some
This contribution has been peer-reviewed.
https://doi.org/10.5194/isprs-archives-XLIII-B4-2020-183-2020 | © Authors 2020. CC BY 4.0 License. 185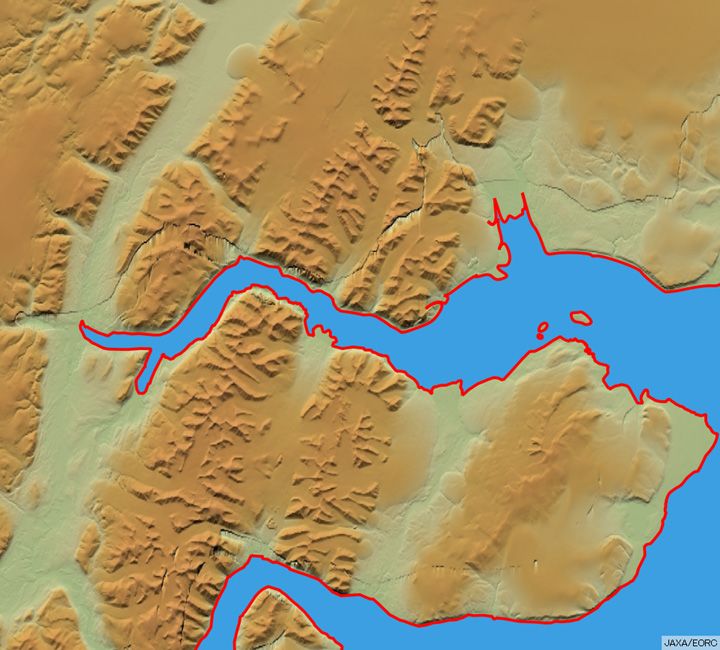
The International Archives of the Photogrammetry, Remote Sensing and Spatial Information Sciences, Volume XLIII-B4-2020, 2020
                                               XXIV ISPRS Congress (2020 edition)

                                                                                                AW3D 5m/2.5m
                                                                              OSM                 Original
                                                                            Coast lines
                                                                               GSI                                             EGM96
                                                                                              Sea mask correction
                                                                            Coast lines                                         Geoid

                                                                                              Void‐filling with DSF
                                                                            SRTM‐1 v3

                                                                                             Filtering in arctic areas   Exclude wrong DEM
                                                                            ArcticDEM
   Figure 6. AW3D30 N80W016-021. Left: original, Right:                       v2/v3
     sea masks corrected. Red lines and blue areas depict                                          Auto/Man              NG
                                                                              ASTER                  QC 1
         OSM coastlines and sea masks respectively.                          GDEM v3

                                                                             TDX 90m          Void‐filling with IDW
                                                                               DEM                                        Manual correction
                                                                             Additional            Auto/Man              NG
                                                                            PRISM DSM                QC 2

                                                                             GSI10m         Reduction of grid spacing
                                                                              DEM

                                                                                                     AW3D30
                                                                                                    Void‐filled

                                                                             Figure 8. Processing flow of the AW3D void-filling.

       Artifact due to    Remaining artifact
       lack of masks       after void filling                        ArcticDEM under an assumption that the ArcticDEM has better
                                                                     qualities than the AW3D30 in the areas adjacent to its
                                                                     cloud/snow masks. Namely, the valid data grids that satisfy
       Figure 7. Comparison of AW3D30 DSMs for tile                  following conditions are regarded as errors due to lack of masks
      N61E161. Left to right: the original, the void-filled          and are replaced with ArcticDEM:
      without the filtering, and the one with the filtering.
      Top: whole tile areas, Bottom: Zoom in an artifact.              a)        ArcticDEM is valid
                                                                       b)        Minimum grid distance from the void grids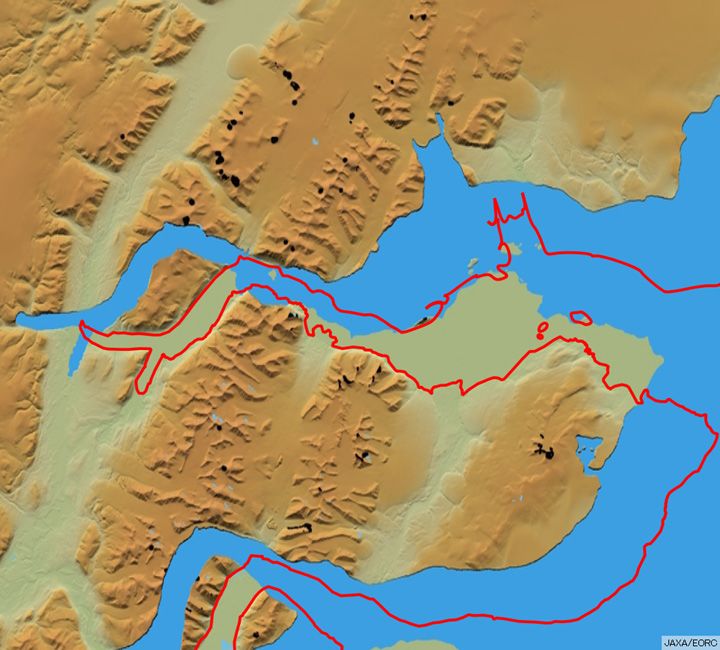
The International Archives of the Photogrammetry, Remote Sensing and Spatial Information Sciences, Volume XLIII-B4-2020, 2020
XXIV ISPRS Congress (2020 edition)
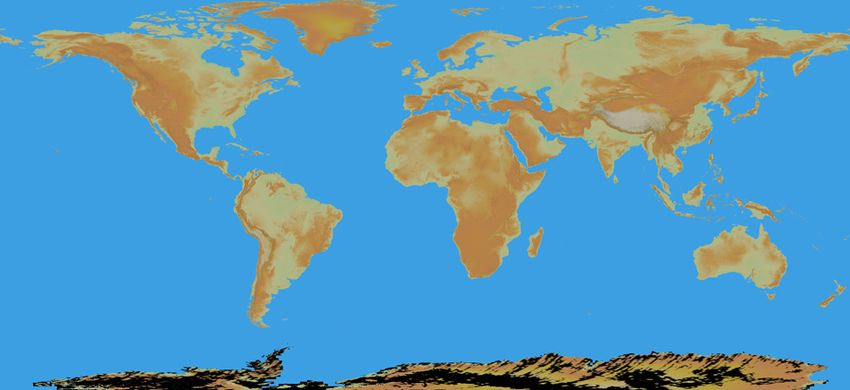
Figure 9. Global coverage of the AW3D30 void-filled version 3.1.
Black areas indicate remaining voids after the filling process. The voids in Antarctica has not been filled as of Mar. 2020.
Source No. of grids %
6. RESULTS AW3D30 original 135,089,227,573 89.930
SRTM-1 v3 14,758,326,308 9.825
The updates for the void-filling of AW3D30 have been ArcticDEM v3 178,191,652 0.119
executed in stages year by year since the first release in 2016 ArcticDEM v2 18,831,796 0.013
with the improvements of the height accuracy of the original GDEM v3 121,497,575 0.081
TDX 90m DEM 38,638,832 0.026
data. In March 2017 the first update (ver. 1.1) was completed
PRISM DSM (add.) 3,615,270 0.002
between N60° and S60° by filling the voids with the SRTM-1 GSI10m (Japan) 5,298,107 0.004
ver.3 and the GSI10m. In March 2018 the second update (ver. IDW 2,970,655 0.002
2.1) was completed by replacing the heights under land-water total 150,216,597,768 100
masks between N60° and S60° with the SRTM-1 ver.3 and the Table 3. Proportion of source data in the AW3D30
GSI10m as well, because we detected large amount of errors in ver. 3.1 between N60° and S60° (low-middle latitudes)
these data that were interpolated from their surrounding valid
heights. In March 2019 the third update (ver. 2.2) was
completed with filling the voids in north of 60°N with the
Source No. of grids %
ArcticDEM ver.2 and the ASTER GDEM ver.2. In March 2020
AW3D30 original 16,244,112,293 75.476
the latest update (ver. 3.1) was completed by filling or re-filling ArcticDEM v3 4,934,024,291 22.925
the voids between 90°N and 60°S with the ArcticDEM ver.3, ArcticDEM v2 122,249,088 0.568
the ASTER GDEM ver.3, and the TDX 90m DEM. GDEM v3 184,645,773 0.858
Figure 9 shows the global coverage of the AW3D30 void-filled TDX 90m DEM 36,921,800 0.172
ver. 3.1, which the all voids except for Antarctica are filled with PRISM DSM (add.) 3,908 0.000
external open-access DEMs. The index flags that indicate IDW 231,584 0.001
source datasets used in the void-filling were stored in the total 21,522,188,737 100
ancillary mask files of AW3D30 data products. Table 3 and 4 Table 4. Proportion of source data in the AW3D30
show the proportions of source data in the AW3D30 ver. 3.1 ver. 3.1 between N90° and N60° (arctic latitudes)
between N60° and S60° (low-middle latitudes) and between
N90° and N60° (arctic latitudes), respectively. In low-middle
latitudes the voids of approx. 10.1 % in original AW3D30 all was used with the rate of 0.9 % in some areas mainly in
land areas were mostly filled with SRTM-1 ver.3 with the rate Fennoscandian Peninsula where relatively large voids are
of 9.8 %. The ArcticDEM was used in limited void-areas remaining in both of the AW3D30 and the ArcticDEM. The
around N60° i.e., Alaska Peninsula, Aleutian Islands and TDX 90m DEM was used in a few areas where the GDEM
Kamchatka Peninsula with the rate of 0.1 %. The GDEM ver.3 ver.3 includes large blunders.
was used for voids in high steep mountainous areas where the The perspective absolute height accuracies of the AW3D30 ver.
quality of SRTM-1 ver.3 was not enough i.e., a few tiles in 3.1 were validated with Ice, Cloud, and land Elevation Satellite
Himalaya and Patagonia, while the TDX 90m DEM was used (ICESat) data for each of source DEM datasets. The absolute
for a few tiles in Sahara desert. In arctic latitudes the voids of height accuracy of the global spaceborne light-detection-and-
approx. 24.5 % in original AW3D30 all land areas were mostly ranging (LiDAR) data is less than one meter for the points
filled with ArcticDEM ver.3 with the rate of 22.9 %, while a selected in optimal conditions (Duong et al., 2009). We used the
few void areas in both of the AW3D30 and the ArcticDEM ICESat data products GLA14 in the validation (Zwally et al.
ver.3 were filled with the ArcticDEM ver.2. The GDEM ver.3 2012). In the calculation of the height difference the 1 arc-sec
This contribution has been peer-reviewed.
https://doi.org/10.5194/isprs-archives-XLIII-B4-2020-183-2020 | © Authors 2020. CC BY 4.0 License. 187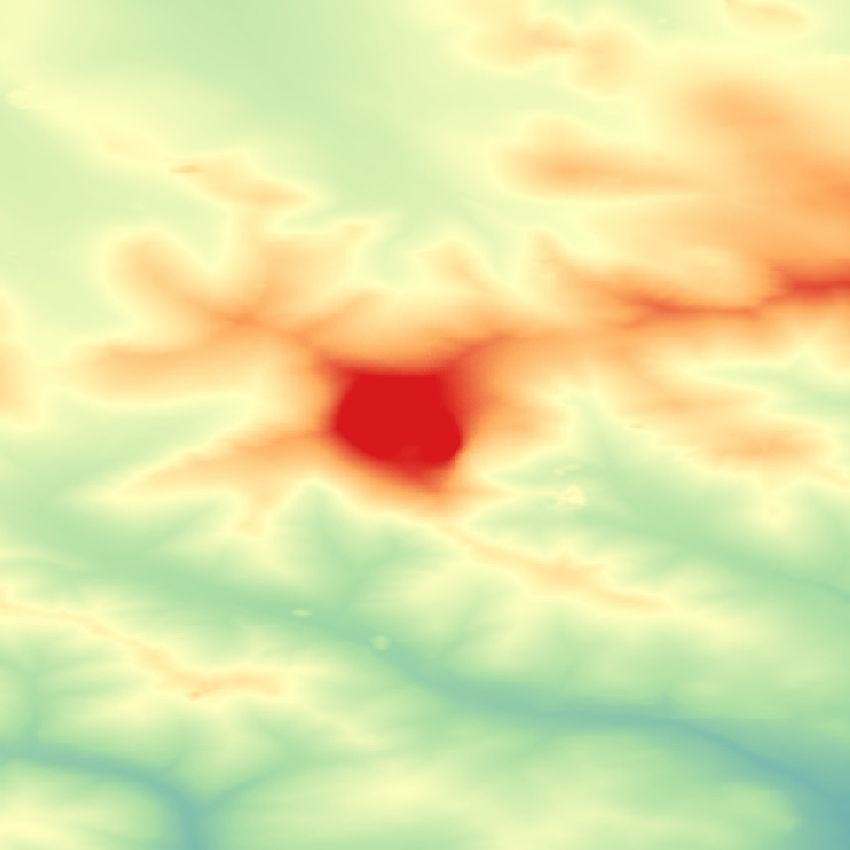
The International Archives of the Photogrammetry, Remote Sensing and Spatial Information Sciences, Volume XLIII-B4-2020, 2020
                                               XXIV ISPRS Congress (2020 edition)

                          N60-S60 (low-middle latitudes)                   N90-N60 (arctic latitudes)               N90-S60 (whole except for Antarctica)
      Source
                  no. of samples     ave.   std.dev.      rms    no. of samples   ave.      std.dev.    rms     no. of samples    ave.    std.dev.     rms
  AW3D30 orginal   170,542,794      0.04      3.27       3.27     45,666,473      0.52        2.92      2.97     216,209,267      0.14      3.21      3.21
    SRTM-1 v3       15,321,801      -0.49     5.04        5.06          -           -           -         -       15,321,801     -0.49      5.04       5.06
   ArcticDEM v2        9,471        -4.37     6.97        8.23      269,323      -1.16        5.97      6.08       278,794       -1.27      6.03       6.16
   ArcticDEM v3      101,628        -2.21     6.11        6.50    19,333,051     -1.30        3.11      3.38     19,434,679      -1.31      3.14       3.40
     GDEM v3          20,414        -0.94    13.23       13.27      305,281      -4.39        8.77      9.81       325,695       -4.17      9.15      10.06
  TDX 90m DEM         81,476        -1.39     2.64        2.99       82,815      -0.71        7.37      7.40       164,291       -1.05      5.56       5.66
 PRISM DSM (add.)      1,114        -1.59     9.23        9.37          -           -           -         -          1,114       -1.59      9.23      9.37
  GSI10m (Japan)       3,268        -2.00     6.06        6.39          -           -           -         -          3,268       -2.00      6.06       6.39
        IDW            7,329       -10.22    18.76       21.36        157        -0.42        9.18      9.19        7,486       -10.02     18.66      21.18

                  Table 5. Statistics of height errors from ICESat GLA14 in AW3D30 void-filled ver. 3.1 (in meters).

(30m) grid data of the AW3D30 under the ICESat’s footprint of                   Antarctica, which corresponds to the composition of these two
70 m in diameter is averaged, while the averaged samples                        latitude ranges, follow their results.
where the standard deviation in the averaging heights exceed 5
m are omitted because the samples in the steep/rough terrain                                               7. CONCLUSION
may have less reliability (Huber et al., 2009). After the
comparison the samples, where the heights of ICESat were                        The updates of AW3D30 global DSM datasets with other open
higher in more than 100 m, are associated with outliers due to                  access datasets were presented. The voids in original dataset
the cloud reflections or saturated waveforms in ICESat data and                 except for Antarctica, which correspond to approx. 10 % of
are excluded from the results (Carabajal et al. 2006).                          global land coverage mostly due to cloud or snow/ice covers,
Table 5 shows the statistics of height errors from ICESat                       were filled with existing open access DEM datasets that were
GLA14 for each of source DEM data in the AW3D30 void-                           prioritized through inter-comparisons among them. The
filled ver. 3.1 at the latitudes between N60° and S60° (low-                    perspective absolute accuracies of the void filled datasets were
middle latitudes), between N90° and N60° (arctic latitudes), and                validated for each of source datasets with the ICESat global
their composite. Note that the results do not mean the                          point cloud reference. The result showed that the accuracies of
comparison among the accuracies of datasets because the                         void-filled areas are almost consistent with the areas of
numbers as well as the areas of samples are different among                     AW3D30 original dataset except for some limited areas in
them.                                                                           extreme terrain.
In low-middle latitudes the rms values for both of the AW3D30                   For future work we have a plan to fill the remaining voids in
original and the TDX 90 m DEM are approx. 3 m, and are                          Antarctica to complete the void-free global DSM datasets until
enough consistent with their specification accuracy of 5 m (rms)                March 2021 by using the REMA DSM, as well as the TDX 90m
and below 10 m (absolute, LE90) respectively in their original                  DEM and the ASTER GDEM. Moreover, we will continue to
datasets. The rms value for the SRTM-1 ver.3, which was used                    update the datasets for better quality/accuracy with applying
to fill almost voids in this latitude range, is approx. 5 m and                 upcoming new datasets including the DSM generated from the
consistent with the specification accuracy of the AW3D original.                cross-track stereo imageries of the ALOS-3, a follow-on
The rms values of ArcticDEM two versions are approx. 7~8 m;                     satellite of optical sensors onboard the ALOS (Takaku et al.,
these relatively large values may be derived from their limited                 2019).
distributions in mountainous Islands and Peninsulas around the
Bering Sea. The GDEM ver.3 also has large rms of 13 m                                                          REFERENCES
possibly due to its limited distribution at very high steep
mountains in addition to its original accuracy. The additional                  Abdullahi, S., Wessel, B., Huber, M., Wendleder, A., Roth, A.,
PRISM DSM has large rms value of 9 m as well; the quality of                    Kuenzer, C., 2019. Estimating Penetration-Related X-Band
source imageries which have over 30 % cloud covers, as well as                  InSAR Elevation Bias: A Study over the Greenland Ice Sheet.
less stacking scenes, may be the cause. The IDW interpolation                   Remote Sens. 2019, 11, 2903. doi.org/10.3390/rs11242903.
area has largest errors of 21 m in rms. One possible cause is that
the interpolation lost details in some steep terrain though all the             Carabajal, C., Harding, D., 2006. SRTM C-band and ICESat
results were manually inspected.                                                laser altimetry elevation comparisons as a function of tree cover
In arctic latitudes the rms value of AW3D30 original is almost                  and relief. Photogrammetry Engineering and Remote Sensing,
the same as the one in the low-middle latitudes, while the one                  72(3), pp. 287–298.
of ArcticDEM ver.3, which was used to fill almost voids in this
arctic range especially on large ice-sheets in Greenland, is                    Duong, H., Lindenbergh, R., Pfeifer, N., Vosselman, G., 2009.
approx. 3 m and is better than the one in the low-middle                        ICESat Full-Waveform Altimetry Compared to Airborne Laser
latitudes. The rms value of the TDX 90m DEM is approx. 7 m                      Scanning Altimetry Over The Netherlands. IEEE Transaction
and is more than twice as large as the one in low-middle                        on Geoscience and Remote Sensing, 47(10), pp. 3365-3378.
latitudes because the samples in arctic latitudes are distributed
in relatively steep terrain, whereas in low-middle latitudes they               Grohman, G., Kroenung, G., Strebeck, J., 2006. Filling SRTM
are distributed mostly in the flat desert. The rms value of the                 voids: The delta surface fill method. Photogrammetric
GDEM ver.3 is approx. 10 m where the obvious large blunders                     Engineering and Remote Sensing, 72 (3), pp. 213-216.
were manually excluded in the filling process. The rms of the
IDW is 9 m; however it is not enough reliable due to relatively                 Howat, I. M., Porter, C., Smith, B. E., Noh, M.-J., Morin, P.,
very small number of samples. The global statistics except for                  2019. The Reference Elevation Model of Antarctica. The
                                                                                Cryosphere, 13, pp. 665-674.

                                                 This contribution has been peer-reviewed.
                   https://doi.org/10.5194/isprs-archives-XLIII-B4-2020-183-2020 | © Authors 2020. CC BY 4.0 License.                                     188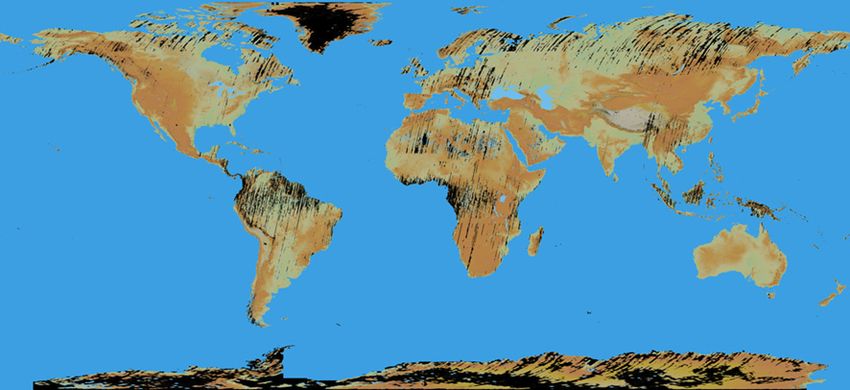
The International Archives of the Photogrammetry, Remote Sensing and Spatial Information Sciences, Volume XLIII-B4-2020, 2020
                                               XXIV ISPRS Congress (2020 edition)

Huber, M., Wessel, B., Kosmann, D., Felbier, A., Schwieger, V.,      Tadono, T., Nagai, H., Ishida, H., Oda, F., Naito, S., Minakawa,
Habermeyer, M., Wendleder, A., Roth, A., 2009. Ensuring              K., Iwamoto, H., 2016. Initial Validation of the 30 m-mesh
globally the TanDEM-X height accuracy: Analysis of the               Global Digital Surface Model Generated by ALOS PRISM. Int.
reference data sets ICESat, SRTM and KGPS-Tracks. Proc.              Arch. Photogramm. Remote Sens. Spatial Inf. Sci, XLI-B4,
IEEE IGARSS 2009, Vol. II, pp.769-772.                               pp.157-162.

NASA/METI/AIST/Japan Spacesystems, U.S./Japan ASTER                  Takaku, J., Tadono T., Tsutsui, K., Ichikawa, M., 2016.
Science Team, 2019. ASTER Global Digital Elevation Model             Validation of ‘AW3D’ Global DSM Generated from ALOS
V003. NASA EOSDIS Land Processes DAAC. doi.org/10.5067               PRISM. ISPRS Ann. Photogramm. Remote Sens. Spatial Inf.
/ASTER/ASTGTM.003. (2019).                                           Sci., III-4, pp. 25-31.

NASA/NGA, 2003. “SRTM Water Body Data Product Specific               Takaku, J., and Tadono, T., 2017. Quality updates of ‘AW3D’
Guidance”. http://dds.cr.usgs.gov/srtm/version2_1/SWBD/SWB           global DSM generated from ALOS PRISM. Proc. IEEE
D_Documentation/SWDB_Product_Specific_Guidance.pdf. (20              IGARSS 2017, pp. 5666-5669.
Mar. 2014).
                                                                     Takaku, J., Tadono, T., Tsutsui, K., Ichikawa, M., 2018.
OpenStreetMap contributors, Planet dump 2019. https://planet.        Quality Improvements of ‘AW3D’ Global DSM Derived from
osm.org, https://www.openstreetmap.org.                              ALOS PRISM. Proc. IEEE IGARSS 2018, pp. 1612-1615.

Porter, C., Morin, P., Howat, I., Noh, M.-J., Bates, B., Peterman,   Takaku, J., Tadono, T., Ohgushi, F., Doutsu, M., 2019. High
K., Keesey, S., Schlenk, M., Gardiner, J., Tomko, K., Willis, M.,    resolution DSM generation from ALOS-3 stereo imageries.
Kelleher, C., Cloutier, M., Husby, E., Foga, S., Nakamura, H.,       Proc. IEEE IGARSS2019, pp. 1144-1147.
Platson, M., Wethington, M., Jr., Williamson, C., Bauer, G.,
Enos, J., Arnold, G., Kramer, W., Becker, P., Doshi, A.,             Wessel, B., Huber, M., Wohlfart, C., Marschalk, U., Kosmann,
D’Souza, C., Cummens, P., Laurier, F., Bojesen, M., 2018.            D., Roth, A., 2018. Accuracy Assessment of the Global
ArcticDEM.       doi.org/10.7910/DVN/OHHUKH,              Harvard    TanDEM-X Digital Elevation Model with GPS Data. ISPRS
Dataverse, V1, (15 Jan. 2020).                                       Journal of Photogrammetry and Remote Sensing. Vol. 139, pp.
                                                                     171-182.
Rodriguez, E., Morris, C. S., Belz, J. E., 2006. A Global
Assessment of the SRTM Performance. Photogrammetric                  Wessel, P., Smith, W. H. F., 1996. A Global Self-consistent,
Engineering and Remote Sensing, 72(3), pp.249-260.                   Hierarchical, High-resolution Shoreline Database. Journal of
                                                                     Geophysical Research, 101(B4), pp. 8741-8743.
Tachikawa, T., Hato, M., Kaku, M., Iwasaki, A., 2011.
Characteristics of ASTER GDEM version 2. Proc. IEEE                  Zwally, H., Schutz, R., Hancock, D., Dimarzio, J., 2012.
IGARSS 2011, pp. 3657-3660.                                          GLAS/ICEsat L2 Global Land Surface Altimetry Data (HDF5).
                                                                     Version 33. NASA DAAC at the National Snow and Ice Data
                                                                     Center, Boulder, CO, USA.

                                               This contribution has been peer-reviewed.
                 https://doi.org/10.5194/isprs-archives-XLIII-B4-2020-183-2020 | © Authors 2020. CC BY 4.0 License.              189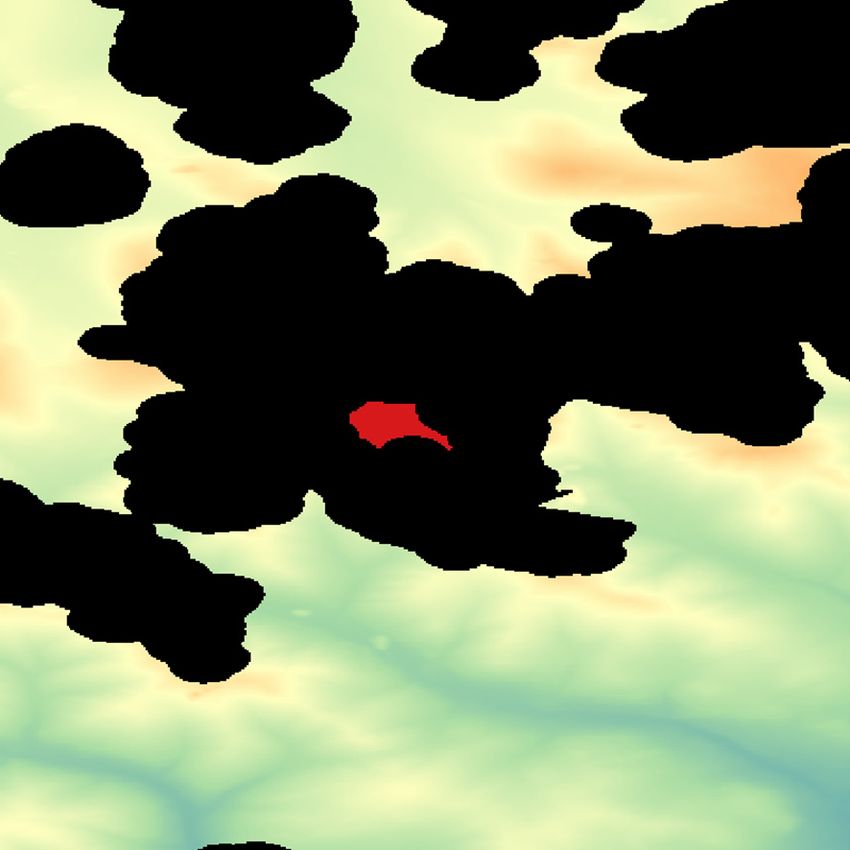
You can also read