Use of signals of positive and negative selection to distinguish cancer genes and passenger genes - eLife
←
→
Page content transcription
If your browser does not render page correctly, please read the page content below
RESEARCH ARTICLE

                                    Use of signals of positive and negative
                                    selection to distinguish cancer genes and
                                    passenger genes
                                    László Bányai1, Maria Trexler1, Krisztina Kerekes1, Orsolya Csuka2,
                                    László Patthy1*
                                    1
                                        Institute of Enzymology, Research Centre for Natural Sciences, Budapest, Hungary;
                                    2
                                        Department of Pathogenetics, National Institute of Oncology, Budapest, Hungary

                                    Abstract A major goal of cancer genomics is to identify all genes that play critical roles in
                                    carcinogenesis. Most approaches focused on genes positively selected for mutations that drive
                                    carcinogenesis and neglected the role of negative selection. Some studies have actually concluded
                                    that negative selection has no role in cancer evolution. We have re-examined the role of negative
                                    selection in tumor evolution through the analysis of the patterns of somatic mutations affecting the
                                    coding sequences of human genes. Our analyses have confirmed that tumor suppressor genes are
                                    positively selected for inactivating mutations, oncogenes, however, were found to display signals of
                                    both negative selection for inactivating mutations and positive selection for activating mutations.
                                    Significantly, we have identified numerous human genes that show signs of strong negative
                                    selection during tumor evolution, suggesting that their functional integrity is essential for the
                                    growth and survival of tumor cells.

                                    Introduction
*For correspondence:
                                    Genetic, epigenetic, transcriptomic, and proteomic changes driving
patthy.laszlo@ttk.mta.hu            carcinogenesis
                                    In the last two decades, the rapid advance in genomics, epigenomics, transcriptomics, and proteo-
Competing interests: The
                                    mics permitted an insight into the molecular basis of carcinogenesis. These studies have confirmed
authors declare that no
                                    that tumors evolve from normal tissues by acquiring a series of genetic, epigenetic, transcriptomic,
competing interests exist.
                                    and proteomic changes with concomitant alterations in the control of the proliferation, survival, and
Funding: See page 33                spread of affected cells.
Received: 03 June 2020                 The genes that play key roles in carcinogenesis are usually assigned to two major categories:
Accepted: 10 January 2021           proto-oncogenes that have the potential to promote carcinogenesis when activated or overex-
Published: 11 January 2021          pressed and tumor suppressor genes (TSGs) that promote carcinogenesis when inactivated or
                                    repressed.
Reviewing editor: Eduardo
Eyras, Australian National
                                       Several alternative mechanisms can modify the structure or expression of a gene in a way that
University, Australia               promotes carcinogenesis. These include subtle genetic changes (single nucleotide substitutions,
                                    short indels), major genetic events (deletion, amplification, translocation and fusion of genes to other
   Copyright Bányai et al. This
                                    genetic elements), as well as epigenetic changes affecting the expression of cancer genes. These
article is distributed under the
                                    mechanisms are not mutually exclusive: there are many examples illustrating the point that multiple
terms of the Creative Commons
Attribution License, which          types of the above mechanisms may convert the wild-type form of a cancer gene to a driver gene.
permits unrestricted use and           Exomic studies of common solid tumors revealed that usually several cancer genes harbor subtle
redistribution provided that the    somatic mutations (point mutations, short deletions, and insertions) in their translated regions but
original author and source are      malignancy-driving subtle mutations can also occur in all genetic elements outside the coding
credited.                           region, namely in enhancer, silencer, insulator, and promoter regions as well as in 5’- and 3’-

Bányai et al. eLife 2021;10:e59629. DOI: https://doi.org/10.7554/eLife.59629                                                        1 of 76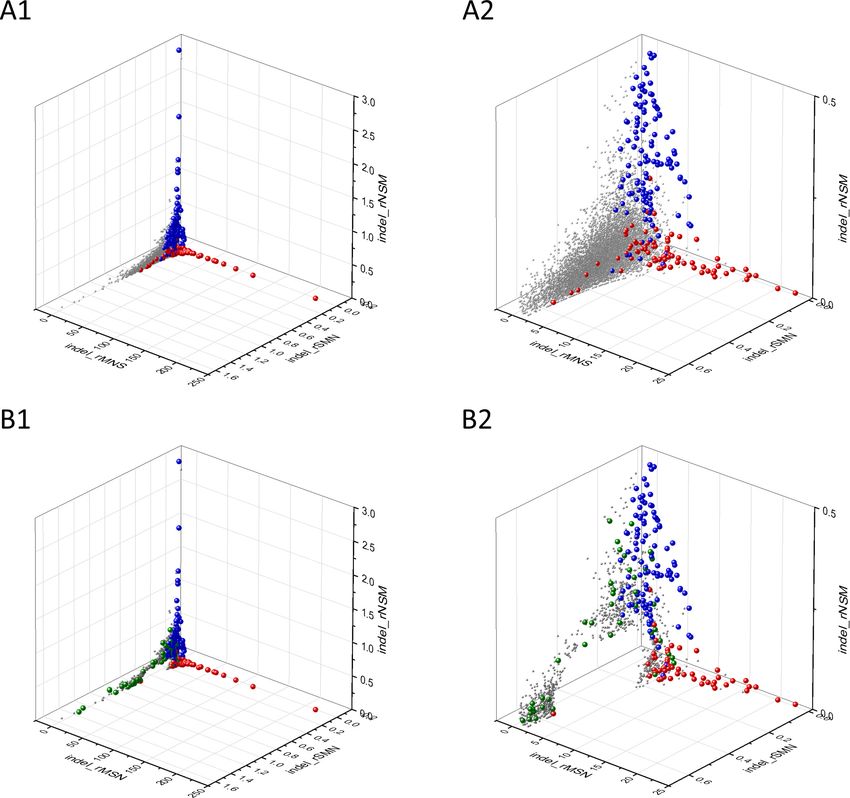
Research article                                                                                                  Cancer Biology

                                    eLife digest The DNA in the cells of the human body is usually copied correctly when a cell
                                    divides. However, errors (mutations) are sometimes introduced during the copying process.
                                    Although the majority of mutations have no major impact on cells, many mutations are harmful: they
                                    decrease the ability of cells to survive. There are, however, mutations that can lead to cells dividing
                                    more frequently or gaining the ability to spread, which can lead to cancer. These mutations are
                                    known as ‘driver mutations’ because they drive the growth of tumors. Since such ‘driver mutations’
                                    provide a growth advantage to tumor cells, they are subject to positive selection, this is, their
                                    frequency in the tumor increases over time. Because of their selective advantage, driver mutations
                                    accumulate at significantly higher rates than the neutral ‘passenger mutations’ that do not play a
                                    role in tumor growth.
                                        Genes that carry driver mutations are called driver genes, while genes that carry only passenger
                                    mutations are known as passenger genes. Certain genes, however, do not fit into either category.
                                    For example, some genes that are essential for tumor growth must get rid of harmful mutations to
                                    maintain activity. Mutations of such ‘tumor essential genes’ are thus subject to ‘negative’ or
                                    ‘purifying selection’.
                                        A major goal of cancer research is to identify genes that play critical roles in tumor growth.
                                    Earlier studies have identified numerous driver genes positively selected for driver mutations,
                                    exploiting the fact that driver genes show significantly higher mutation rates than passenger genes.
                                    Identification of tumor essential genes, however, is inherently more difficult since the paucity of
                                    mutations of negatively selected genes hinders the analysis of the mutation data. The failure to
                                    provide convincing evidence for negative selection in tumors has led to suggestions that it has no
                                    role in cancer evolution.
                                        Bányai et al. used a novel approach to address the question of whether negative selection occurs
                                    in cancer. Based on characteristic differences in the patterns of mutations in cancer they
                                    distinguished clusters of passenger genes, driver genes and tumor essential genes. The group of
                                    tumor essential genes includes genes that serve to satisfy the increased demand of rapidly dividing
                                    tumor cells for nutrients’ and genes that are essential for cell migration and metastasis (the spread
                                    of cancer cells to other areas of the body).
                                        The tumor essential genes that Bányai et al. identified may prove to be valuable targets for
                                    cancer therapy, illustrating the importance of genome sequencing in cancer research. Identification
                                    of additional tumor essential genes is, however, hindered by the fact that they are likely to have low
                                    levels of mutations, which can exclude them from meaningful analyses. Progress with genomic
                                    sequencing of tumors is expected to overcome this limitation and help identify additional genes that
                                    are essential for cancer growth.

                                    untranslated regions. Intron or splice site mutations that alter the splicing pattern of cancer genes
                                    can also drive carcinogenesis (Diederichs et al., 2016). A recent study has presented a comprehen-
                                    sive analysis of driver point mutations in non-coding regions across 2658 cancer genomes
                                    (Rheinbay et al., 2020). A noteworthy example of how subtle mutations in regulatory regions may
                                    activate proto-oncogenes is the telomerase reverse transcriptase gene TERT that encodes the cata-
                                    lytic subunit of telomerase. Recurrent somatic mutations in melanoma and other cancers in the TERT
                                    promoter cause tumor-specific increase of TERT expression, resulting in the immortalization of the
                                    tumor cell (Heidenreich et al., 2014).
                                        In addition to subtle mutations, tumors also accumulate major chromosomal changes (Li et al.,
                                    2020). Most solid tumors display widespread changes in chromosome number, as well as chromo-
                                    somal deletions and translocations (Lengauer et al., 1998). Homozygous deletions of a few genes
                                    frequently drive carcinogenesis and the target gene involved in such deletions is always a TSG
                                    (Cheng et al., 2017). Somatic copy-number alterations, amplifications of cancer genes are also wide-
                                    spread in various types of cancers. Amplifications usually contain an oncogene (OG) whose protein
                                    product is abnormally active simply because the tumor cell contains 10–100 copies of the gene per
                                    cell, compared with the two copies present in normal cells (Beroukhim et al., 2010; Verhaak et al.,
                                    2019). Chromosomal translocations may also convert wild-type forms of TSGs into forms that drive

Bányai et al. eLife 2021;10:e59629. DOI: https://doi.org/10.7554/eLife.59629                                                       2 of 76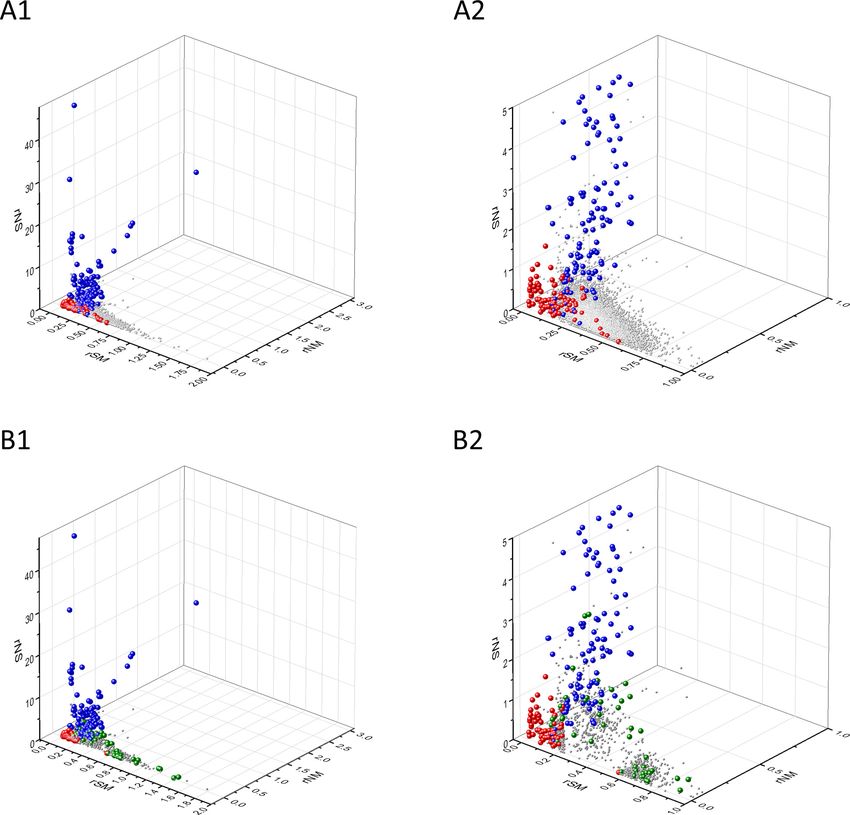
Research article                                                                                                   Cancer Biology

                                    carcinogenesis if the translocation inactivates the genes by truncation or by separating them from
                                    their promoter. Similarly, translocations may activate proto-oncogenes by changing their regulatory
                                    properties (Haller et al., 2019).
                                        Epigenetic mechanisms such as DNA methylation and histone modifications may also alter the
                                    activity of cancer genes. It is now widely accepted that genetic and epigenetic changes go hand in
                                    hand in carcinogenesis: numerous genes involved in shaping the epigenome are mutated in common
                                    human cancers, and epigenetic changes affect many genes carrying driver mutations (Yang and Yu,
                                    2013; Chen et al., 2017b; Di Domenico et al., 2017; Roussel and Stripay, 2018; Chatterjee et al.,
                                    2018). For example, promoter hypermethylation events may promote carcinogenesis if they lead to
                                    silencing of TSGs; the tumor-driving role of promoter methylation is obvious in the case of TSGs that
                                    are frequently inactivated by mutations in cancer (Pfeifer, 2018). Conversely, there is now ample evi-
                                    dence that promoter hypomethylation can promote carcinogenesis if it leads to increased expression
                                    of proto-oncogenes (Van Tongelen et al., 2017).
                                        Non-coding RNAs (ncRNAs) also play key roles in carcinogenesis (Slack and Chinnaiyan, 2019).
                                    An explosion of studies has shown that – based on complementary base pairing – ncRNAs may func-
                                    tion as OGs (by inhibiting the activity of TSGs), or as tumor suppressors (by inhibiting the activity of
                                    OGs or tumor essential genes [TEGs]).
                                        Alterations in the splicing of primary transcripts of protein-coding genes also contribute to carci-
                                    nogenesis. Recent studies on cancer genomes have revealed that recurrent somatic mutations of
                                    genes encoding RNA splicing factors (e.g. SF3B1, U2AF1, SRSF2, ZRSR2) lead to altered splice site
                                    preferences, resulting in cancer-specific mis-splicing of genes. In the case of proto-oncogenes,
                                    changes in the splicing pattern may generate active oncoproteins, whereas abnormal splicing of
                                    TSGs is likely to generate inactive forms of the tumor suppressor protein (Dvinge et al., 2016).
                                        There is now convincing evidence that dysregulation of processes responsible for proteostasis
                                    also contributes to the development and progression of numerous cancer types (Mofers et al.,
                                    2017; Chen et al., 2017c; Voutsadakis, 2017). Recent studies on tumor tissues have revealed that
                                    genetic alterations and abnormal expression of various components of the protein homeostasis
                                    pathways (e.g. FBXW7, VHL) contribute to progression of human cancers by excessive degradation
                                    of tumor-suppressor molecules or through impaired disposal of oncogenic proteins (Ge et al., 2018;
                                    Bernassola et al., 2019).

                                    Hallmarks of cancer and the function of genes involved in
                                    carcinogenesis
                                    Hanahan and Weinberg have defined a set of hallmarks of cancer that allow the categorization of
                                    cancer genes with respect to their role in carcinogenesis (Hanahan and Weinberg, 2011). These
                                    hallmarks describe the biological capabilities usually acquired during the evolution of tumor cells:
                                    these include sustained proliferative signaling, evasion of growth suppressors, evasion of cell death,
                                    acquisition of replicative immortality, acquisition of capability to induce angiogenesis and activation
                                    of invasion and metastasis. Underlying all these hallmarks are defects in genome maintenance that
                                    help the acquisition of the above capabilities. Additional emerging hallmarks of potential generality
                                    have been suggested to include tumor promoting inflammation, evasion of immune destruction and
                                    reprogramming of energy metabolism in order to most effectively support neoplastic proliferation
                                    (Hanahan and Weinberg, 2011).
                                       Figure 1 summarizes our current view of the cellular processes that play key roles in tumor evolu-
                                    tion to emphasize their contribution to the various major hallmarks of cancer. Changes in the mainte-
                                    nance of the genome, epigenome, transcriptome, and proteome occupy a central position because
                                    they increase the chance that various constituents of other cellular pathways will experience altera-
                                    tions that favor the acquisition of capabilities that permit the proliferation, survival, and metastasis
                                    of tumor cells.

                                    Chronology of tumor evolution: initiation and progression
                                    In the first phase of carcinogenesis, a cell may acquire a mutation that permits it to proliferate abnor-
                                    mally, and in the next phase, other mutations allow the expansion of cell number and this process of
                                    mutations (and associated epigenetic, transcriptomic and proteomic alterations) continues, thus gen-
                                    erating a primary tumor that can eventually metastasize to distant organs. Recent studies on the

Bányai et al. eLife 2021;10:e59629. DOI: https://doi.org/10.7554/eLife.59629                                                         3 of 76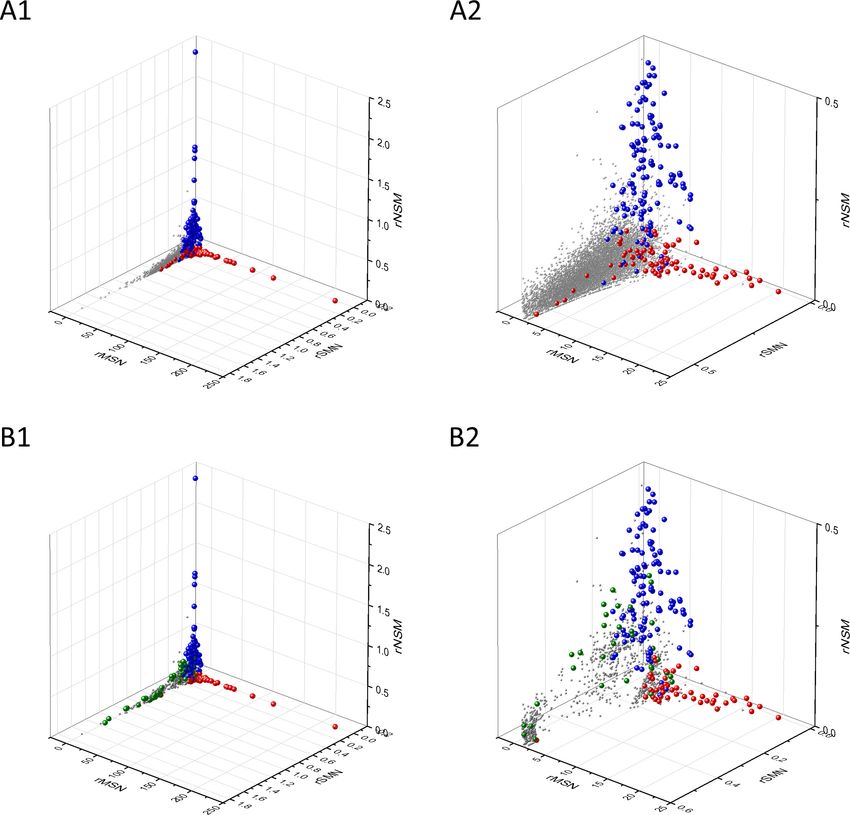
Research article                                                                                                              Cancer Biology

Figure 1. Changes of key cellular processes contributing to carcinogenesis. The central circle refers to processes involved in the maintenance of the
integrity of the genome, epigenome, transcriptome, and proteome: defects in these processes increase the chance that genes and proteins of other
cellular pathways (represented by segments of the outer circle) will suffer alterations that favor the acquisition of capabilities that permit the
proliferation, survival, and metastasis of tumor cells.

                                     chronology and genomic landscape of the events that drive carcinogenesis suggest that complex
                                     structural changes of the genome occur early, whereas point mutations occur in later disease phases
                                     (Maura et al., 2019; Voronina et al., 2020).
                                        According to current estimates, the number of cancer driving mutations needed for the full devel-
                                     opment of cancer ranges from two-eight depending on cancer type (Vogelstein and Kinzler, 2015;
                                     Anandakrishnan et al., 2019). A recent integrative analysis of 2658 whole-cancer genomes and their
                                     matching normal tissues across 38 tumor types revealed that, on average, cancer genomes contain
                                     four to five driver mutations (Campbell et al., 2020).
                                        Although the temporal order of the mutations affecting genes of key pathways differs among
                                     cancer types, it appears that a common feature is that mutations of genes that regulate apoptosis
                                     occur in the early phases of tumor progression, whereas mutations of genes involved in invasion
                                     pathways occur only in the last stages of carcinogenesis (Gerstung et al., 2011). It has been sug-
                                     gested that the reason why the loss of apoptotic control is a critical step for initiating cancer is that
                                     the larger the surviving cell population, the higher the number of cells at risk of acquiring additional
                                     mutations.

Bányai et al. eLife 2021;10:e59629. DOI: https://doi.org/10.7554/eLife.59629                                                                    4 of 76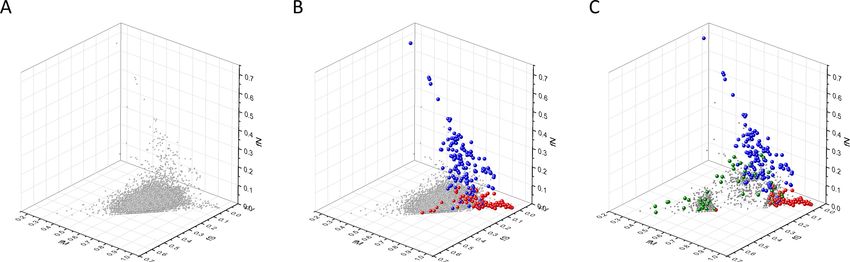
Research article                                                                                                   Cancer Biology

                                        Analyses of the mutation landscapes and evolutionary trajectories of various tumor tissues have
                                    identified BRAF, KRAS, TP53, RB, or APC as the key genes whose mutation is most likely to initiate
                                    carcinogenesis, permitting the cell to divide abnormally (Vogelstein and Kinzler, 2015). In the case
                                    of ovarian cancers, TP53 mutation is believed to be the earliest tumorigenic driver event, with pres-
                                    ence in nearly all cases of ovarian cancer (Bashashati et al., 2013). The prevalence of TP53 muta-
                                    tions and BRCA deficiency in these tumors leads to incompetent DNA repair promoting subsequent
                                    steps of carcinogenesis. Studies on the evolution of melanoma from precursor lesions have revealed
                                    that the vast majority of melanomas harbor TERT promoter mutations, indicating that these immor-
                                    talizing mutations are selected at an unexpectedly early stage of neoplastic progression
                                    (Shain et al., 2015).
                                        The life history and evolution of mutational processes and driver mutation sequences of 38 types
                                    of cancer has been analyzed recently by whole-genome sequencing analysis of 2658 cancers. This
                                    study has shown that early oncogenesis is characterized by mutations in a constrained set of driver
                                    genes and that the driver mutations that most commonly occur in a given cancer also tend to occur
                                    the earliest (Gerstung et al., 2020).

                                    Cancer genes and passenger genes
                                    The prominent role of KRAS and TP53 genes in initiating carcinogenesis has been evident from the
                                    observation that their mutation rate in tumors far exceeds those of other genes, suggesting that
                                    their mutations are subject to positive selection during tumor evolution.
                                        Several types of approaches exploit this principle for the identification of genes that drive carci-
                                    nogenesis: the rate of mutation of ‘driver genes’ must be significantly higher in the tumor tissue than
                                    those of ‘passenger genes’ (PGs) that have no role in the development of cancer but simply happen
                                    to mutate in the same tumor (Parmigiani et al., 2009; Meyerson et al., 2010).
                                        Unfortunately, methods based on mutation frequency alone cannot reliably indicate which genes
                                    are cancer drivers because the background mutation rates differ significantly as a consequence of
                                    intrinsic characteristics of DNA sequence and chromatin structure (Michaelson et al., 2012). Intrinsic
                                    mutation hotspots are mutation hotspots that depend on the nucleotide sequence context, the
                                    mechanism of mutagenesis and the action of the repair and replication machineries (Rogozin and
                                    Pavlov, 2003). Genes enriched in intrinsic mutation hotspots may accumulate mutations at a signifi-
                                    cantly higher rate than other genes, creating the illusion of positive selection; based on recurrent
                                    mutations they may be mistakenly identified as cancer driver genes (Carter, 2019; Buisson et al.,
                                    2019).
                                        In principle, we can avoid this danger if we compare the mutation pattern of the gene in the
                                    tumor tissue with that in the normal tissue the tumor has originated from. However, since the rate of
                                    mutation in such hotspots depends not only on the nucleotide sequence but also on the mechanism
                                    of mutagenesis and the integrity of DNA repair pathways (Buisson et al., 2019; Poulos et al., 2018)
                                    mutation hotspots that arise during carcinogenesis could still create the illusion of positive selection.
                                        Chromatin organization also has a major influence on regional mutation rates in human cancer
                                    cells (Schuster-Böckler and Lehner, 2012; Gonzalez-Perez et al., 2019). Since large-scale chroma-
                                    tin features, such as replication time and accessibility influence the rate of mutations, this may hinder
                                    the distinction of cancer driver genes whose high mutation rate reflects positive selection and PGs
                                    whose high mutation rate is the result of the distinctive features of the chromatin region in which
                                    they reside. Moreover, since the cell-of-origin chromatin organization shapes the mutational land-
                                    scape, rates of somatic mutagenesis of genes in cancer are highly cell-type-specific (Polak et al.,
                                    2015). Actually, since regional mutation density of ‘passenger’ mutations across the human chromo-
                                    somes correlates with the cell type the tumor had originated from, this feature may be used to clas-
                                    sify human tumors (Salvadores et al., 2019).
                                        Through the comparison of the exome sequences of 3083 tumor-normal pairs Lawrence et al.,
                                    2013 have discovered an extraordinary variation in mutation frequency and spectrum within cancer
                                    types across the genome, which is strongly correlated with DNA replication timing and transcrip-
                                    tional activity. The authors have shown that by incorporating mutational heterogeneity into their
                                    analyses, they could eliminate many of the apparent artefactual findings, improving the identification
                                    of genes truly associated with cancer. In a more recent study Lawrence et al., 2014 compared the
                                    frequency of somatic point mutations in exome sequences from 4742 human cancers and their
                                    matched normal-tissue samples across 21 cancer types and identified 33 genes that were not

Bányai et al. eLife 2021;10:e59629. DOI: https://doi.org/10.7554/eLife.59629                                                         5 of 76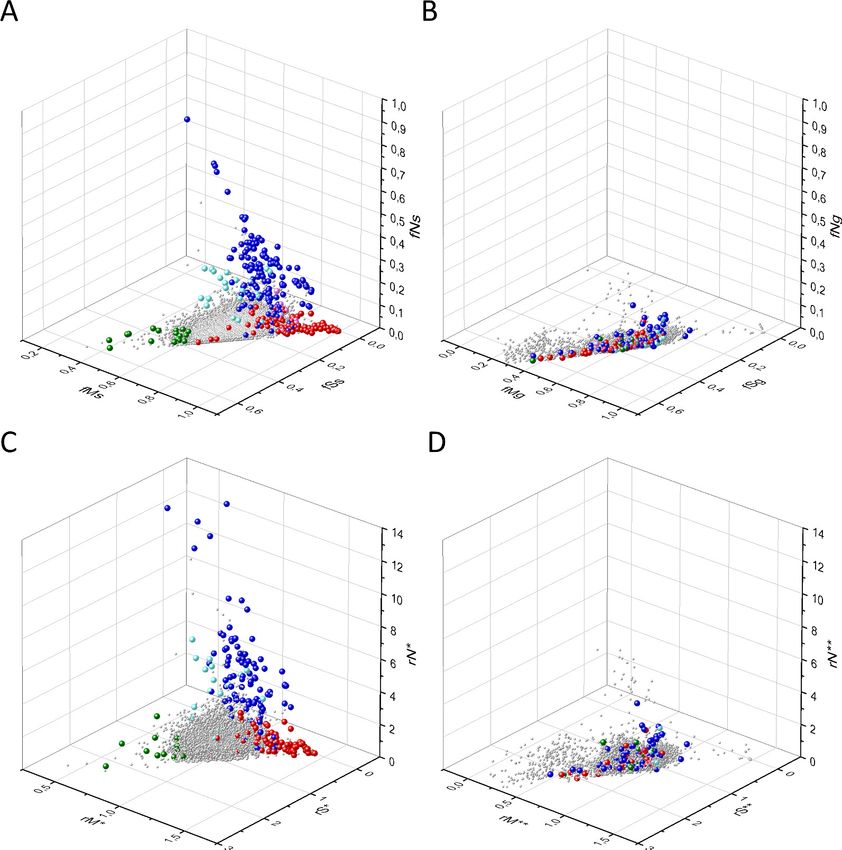
Research article                                                                                                  Cancer Biology

                                    previously known to be significantly mutated in cancer. They have concluded that 224 genes are sig-
                                    nificantly mutated in one or more tumor types.
                                        However, since background mutational frequency estimates are not sensitive enough, the list of
                                    driver genes (defined as genes with increased somatic mutation rate) is likely to be incomplete, but
                                    may also contain false positives. To overcome these limitations of mutation rate-based approaches,
                                    several methods use additional features that may distinguish driver genes and PGs. A major group
                                    of such approaches incorporates observations about the impact of mutations on the structure and
                                    function of well-characterized proteins encoded by proto-oncogenes and TSGs. Several computa-
                                    tional methods aim to identify driver missense mutations most likely to generate functional changes
                                    that causally contribute to tumorigenesis (Kaminker et al., 2007; Carter et al., 2009;
                                    Nussinov et al., 2019).
                                        In a different type of approach Youn and Simon, 2011 identified cancer driver genes as those for
                                    which the non-silent mutation rate is significantly greater than a background mutation rate estimated
                                    from silent mutations, indicating that the non-silent mutations are subject to positive selection. The
                                    authors have identified 28 genes as driver genes, the majority of the significant matches (e.g. EGFR,
                                    CDKN2A, KRAS, STK11, TP53, NF1, RB1 PTEN, and NRAS), were well-characterized OGs or TSGs
                                    known from earlier studies.
                                        In a more recent study, Zhou et al., 2017 have identified 365 genes for which the ratio of the
                                    nonsynonymous to synonymous substitution rate was significantly increased, suggesting that they
                                    are subject to the positive selection of driver mutations. However, an obvious limitation of such
                                    approaches is that they implicitly assume that synonymous substitutions are selectively neutral and
                                    therefore the ratio of the nonsynonymous to synonymous substitution rate properly monitors selec-
                                    tion. This is not necessarily true: some synonymous mutations may have a significant impact on splic-
                                    ing, RNA stability, RNA folding and translation of the transcript of the affected gene and may thus
                                    actually act as driver mutations (Supek et al., 2014; Hurst and Batada, 2017; Sharma et al., 2019).
                                    Furthermore, some mutation hotspots may significantly increase the rate of synonymous mutations
                                    therefore a low ratio of nonsynonymous to synonymous substitution rate does not necessarily indi-
                                    cate the absence of positive selection or the action of purifying selection.
                                        Vogelstein et al., 2013 have used a heuristic approach to identify cancer driver genes. Since the
                                    patterns of mutations in the first and best-characterized OGs and TSGs were found to be highly
                                    characteristic and nonrandom, the authors assumed that the same characteristics are generally valid
                                    and may be used to identify previously uncharacterized cancer genes. For example, since many
                                    known OGs were found to be recurrently mutated at the same amino acid positions, to classify a
                                    gene as an OG, it was required that >20% of the recorded mutations in the gene are at recurrent
                                    positions and are missense. Similarly, since in the case of known tumor suppressors the driver muta-
                                    tions most frequently truncate the tumor suppressor proteins, to be classified as a TSG, it was
                                    required that >20% of the recorded mutations in the gene are truncating (nonsense or frameshift)
                                    mutations. Along these lines, Vogelstein et al., 2013 have analyzed the patterns of the subtle muta-
                                    tions in the Catalogue of Somatic Mutations in Cancer (COSMIC) database to identify driver genes.
                                    As a proof of the reliability of this ‘20/20 rule’, the authors emphasized that all well-documented can-
                                    cer genes passed these criteria (Vogelstein et al., 2013). Although this indicates that the approach
                                    detects known cancer genes, it does not guarantee that it detects all driver genes. Acknowledging
                                    that additional cancer driver genes might exist, the authors have introduced the term ‘Mut-driver
                                    gene’ for genes that contain a sufficient number or type of driver gene mutations to distinguish
                                    them from other genes, whereas for cancer genes that are expressed aberrantly in tumors but not
                                    frequently mutated they proposed the term ‘Epi-driver gene’.
                                        Based on these analyses, the authors have concluded that out of the 20,000 human protein-cod-
                                    ing genes, only 125 genes qualify as Mut-driver genes, of these, 71 are TSGs and 54 are OGs
                                    (Vogelstein et al., 2013). The authors have expressed their conviction that nearly all genes mutated
                                    at significant frequencies had already been identified and that the number of Mut-driver genes is
                                    nearing saturation. This conclusion may not be justified since the criteria used to identify OGs and
                                    tumor suppressors appear to be too stringent and somewhat arbitrary.
                                        In search of additional driver genes, Tamborero et al., 2013 employed five complementary
                                    methods to find genes showing signals of positive selection and identified a list of 291 ‘high-confi-
                                    dence cancer driver genes’ acting on 3205 tumors from 12 different cancer types. Bailey et al.,
                                    2018 used multiple advanced algorithms to identify cancer driver genes and driver mutations. Based

Bányai et al. eLife 2021;10:e59629. DOI: https://doi.org/10.7554/eLife.59629                                                        6 of 76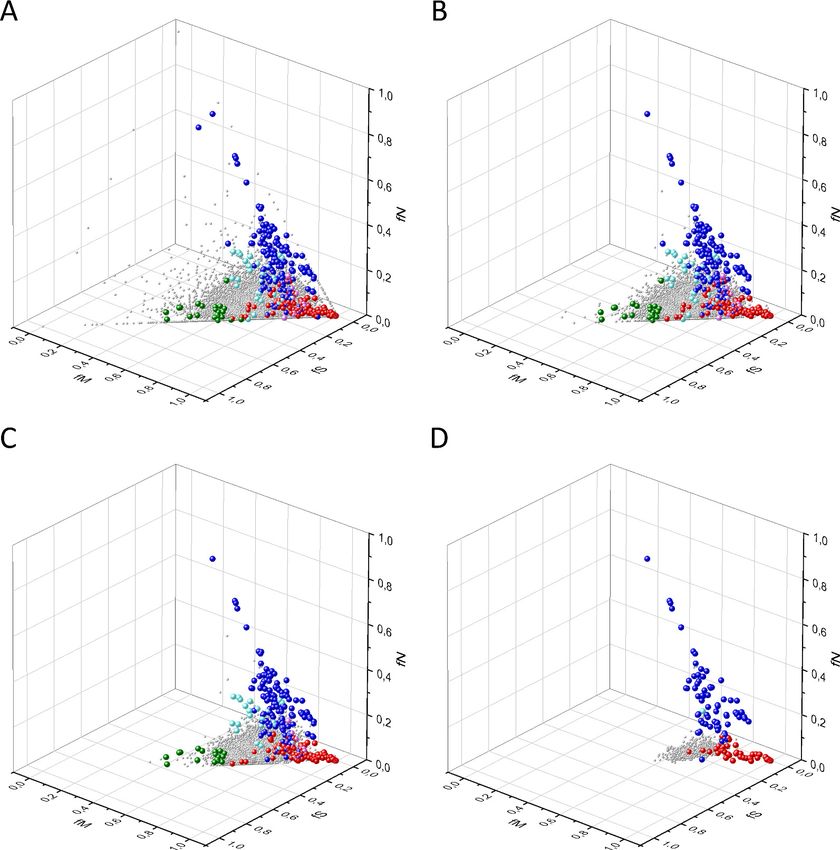
Research article                                                                                                  Cancer Biology

                                    on their PanCancer and PanSoftware analysis spanning 9423 tumor exomes, comprising all 33 of The
                                    Cancer Genome Atlas projects and using 26 computational tools they have identified 299 driver
                                    genes showing signs of positive selection. Their sequence and structure-based analyses
                                    detected >3400,400 putative missense driver mutations and 60–85% of the predicted mutations
                                    were validated experimentally as likely drivers.
                                        Zhao et al., 2019a have developed driverMAPS (Model-based Analysis of Positive Selection), a
                                    model-based approach for driver gene identification that captures elevated mutation rates in func-
                                    tionally important sites and spatial clustering of mutations. The authors have identified 255 known
                                    driver genes as well as 170 putatively novel driver genes.
                                        Currently, COSMIC (the Catalogue Of Somatic Mutations In Cancer, https://cancer.sanger.ac.uk/
                                    cosmic) is the most detailed and comprehensive resource for exploring the effect of subtle somatic
                                    mutations of driver genes in human cancer (Tate et al., 2019) but COSMIC also covers all the
                                    genetic mechanisms by which somatic mutations promote cancer, including non-coding mutations,
                                    gene fusions, and copy-number variants. In parallel with COSMIC’s variant coverage, the Cancer
                                    Gene Census (CGC, https://cancer.sanger.ac.uk/census) describes a curated catalogue of genes driv-
                                    ing every form of human cancer (Sondka et al., 2018). CGC has recently introduced functional
                                    descriptions of how each gene drives disease, summarized into the cancer hallmarks. CGC describes
                                    in detail the effect of a total of 719 cancer-driving genes, encompassing Tier 1 genes (574 genes)
                                    and a list of Tier 2 genes (145 genes) from more recent cancer studies that show less detailed indica-
                                    tions of a role in cancer.
                                        In a different type of approach, Torrente et al., 2016 used comprehensive maps of human gene
                                    expression in normal and tumor tissues to identify cancer related genes. These analyses identified a
                                    list of genes with systematic expression change in cancer. The authors have noted that the list is sig-
                                    nificantly enriched with known cancer genes from large, public, peer-reviewed databases, whereas
                                    the remaining ones were proposed as new cancer gene candidates. A recent study has provided a
                                    comprehensive catalogue of cancer-associated transcriptomic alterations with the top-ranking genes
                                    carrying both RNA and DNA alterations. The authors have noted that this catalogue is enriched for
                                    cancer census genes (Calabrese et al., 2020).
                                        Using transposon mutagenesis in mice, several laboratories have conducted forward genetic
                                    screens and identified thousands of candidate genetic drivers of cancer that are highly relevant to
                                    human cancer. The Candidate Cancer Gene Database (CCGD, http://ccgd-starrlab.oit.umn.edu/) is a
                                    manually curated database containing a unified description of all identified candidate driver genes
                                    (Abbott et al., 2015).
                                        In summary, although a variety of approaches have been developed to identify ‘cancer genes’,
                                    there is significant disagreement as to the number of genes involved in carcinogenesis. Some of the
                                    studies argue that the number is in the 200–700 range, other approaches suggest that their number
                                    may be much higher. Since the ultimate goal of cancer genome projects is to discover therapeutic
                                    targets, it is important to identify all true cancer genes and distinguish them from PGs and candi-
                                    dates that do not play a significant role in the process of carcinogenesis.
                                        We must point out, however, that the majority of genomics-based methods were biased as they
                                    defined the aim of cancer genomics as the identification of mutated driver genes (equating them
                                    with ‘cancer genes’) that are causally implicated in oncogenesis (Futreal et al., 2004). In all these
                                    studies, the underlying rationale for interpreting a mutated gene as causal in cancer development is
                                    that the mutations are likely to have been positively selected because they confer a growth advan-
                                    tage on the cell population from which the cancer has developed. An inevitable consequence of this
                                    focus on positive selection was that most studies neglected the possibility that negative selection
                                    may also play a significant role in tumor evolution.

                                    Carcinogenesis as an evolutionary process
                                    In principle, with respect to its effect on carcinogenesis, a somatic mutation may promote or may
                                    hinder carcinogenesis or may have no effect on carcinogenesis. In cancer genomics, the mutations
                                    that promote carcinogenesis (and are subject to positive selection during tumor evolution) are called
                                    ‘driver mutations’ to distinguish them from ‘passenger mutations’ that do not play a role in carcino-
                                    genesis (and are not subject to positive or negative selection during tumor evolution). Mutations
                                    that impair the growth, survival, and invasion of tumor cells have received much less attention,
                                    although they could also play a significant role in shaping the mutation pattern of genes during

Bányai et al. eLife 2021;10:e59629. DOI: https://doi.org/10.7554/eLife.59629                                                       7 of 76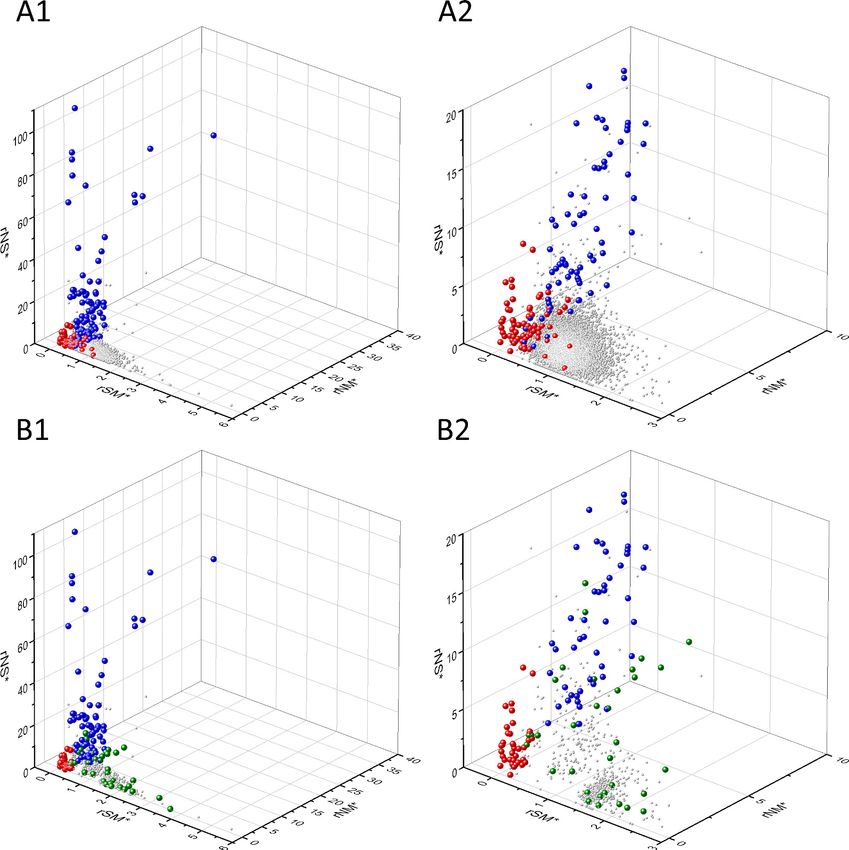
Research article                                                                                                     Cancer Biology

                                    carcinogenesis. Hereafter, we will refer to this category of mutations as ‘cancer blocking mutations’
                                    because they are deleterious from the perspective of tumor growth.
                                        As discussed above, in cancer genomics, genes are usually assigned to just two categories with
                                    respect to their role in carcinogenesis: (1) ‘PGs’ (or bystander genes) that play no significant role in
                                    carcinogenesis and their mutations are passenger mutations; (2) ‘driver genes’ that drive carcinoge-
                                    sis when they acquire driver mutations.
                                        The problem with this binary driver gene-PG categorization is that some genes with functions
                                    essential for the growth and survival of tumor cells (hereafter referred to as ‘tumor essential genes’)
                                    may not easily fit into either category. The coding sequences of driver genes (TSGs, proto-onco-
                                    genes), PGs, and TEGs are predicted to experience markedly different patterns of selection during
                                    tumor evolution.
                                        The mutation patterns of selectively neutral, bona fide PGs are likely to reflect the lack of positive
                                    and negative selection, whereas in the case of TEGs purifying selection is predicted to dominate. In
                                    the case of TSGs, the mutation pattern is expected to reflect positive selection for inactivating driver
                                    mutations. Proto-oncogenes, however, are expected to show signs of both positive selection for
                                    activating mutations and negative selection for inactivating, ‘cancer blocking’ mutations as their
                                    activity is essential for their oncogenic role. In the coding regions of proto-oncogenes positive selec-
                                    tion for driver mutations is expected to favor nonsynonymous substitutions over synonymous substi-
                                    tutions only at sites that are critical for the novel, oncogenic function. For these sites (and these sites
                                    only), the ratio of nonsynonymous to synonymous rates is expected to be significantly greater than
                                    one reflecting positive selection. If there are many such sites in a protein, or selection is extremely
                                    strong the overall nonsynonymous to synonymous ratio for the entire protein may also be signifi-
                                    cantly higher than one, otherwise the effect of positive selection on the synonymous to nonsynony-
                                    mous ratio may be overridden by purifying selection at other sites (Patthy, 1999).
                                        In harmony with some of these expectations, using just the ratio of the nonsynonymous to synon-
                                    ymous substitution rate as a measure of positive or negative selection, Zhou et al., 2017 have shown
                                    that in cancer genomes, the majority of genes had nonsynonymous to synonymous substitution rate
                                    values close to one, suggesting that they belong to the PG category. The authors have identified a
                                    total of 365 potential cancer driver genes that had nonsynonymous to synonymous substitution rate
                                    values significantly greater than one (reflecting the dominance of positive selection). Conversely, 923
                                    genes had nonsynonymous to synonymous substitution rate values significantly less than one (reflect-
                                    ing the dominance of negative selection), leading the authors to suggest that these negatively
                                    selected genes may be important for the growth and survival of cancer cells.
                                        Pyatnitskiy et al., 2015 have also used the dN/dS ratio (the ratio of nonsynonymous and synony-
                                    mous substitution rates) as an indicator of selective pressure and have identified 91 protein-coding
                                    genes (’essential cancer proteins’) with amino acid sequences under negative selection.
                                        Realizing that genes whose wild-type coding sequences are needed for tumor growth are also of
                                    key interest for cancer research, Weghorn and Sunyaev, 2017 have also focused on the role of neg-
                                    ative selection in human cancers. The authors have used an approach based on the principle that
                                    both positive and negative selection can be inferred by comparing the observed mutation rates to
                                    the expectation under the sole action of the mutation process. As the authors have pointed out,
                                    identification, and analysis of true negatively selected,’ undermutated’ genes is particularly difficult
                                    since the sparsity of mutation data results in lower statistical power, making conclusions less reliable.
                                    Although the signal of negative selection was exceedingly weak, the authors have noted that the
                                    group of negatively selected candidate genes is enriched in cell-essential genes identified in a
                                    CRISPR screen (Wang et al., 2015a), consistent with the notion that one of the potential causes of
                                    negative selection is the maintenance of genes that are responsible for basal cellular functions.
                                    Based on pergene estimates of negative selection inferred from the pan-cancer analysis the authors
                                    have identified 147 genes with significant negative selection. The authors have noted that among
                                    the 13 genes showing the strongest signs of negative selection there are several genes (ATAT1,
                                    BCL2, CLIP1, GALNT6, CKAP5, and REV1) that are known to promote carcinogenesis.
                                        In a similar work, Martincorena et al., 2017 have used the normalized ratio of non-synonymous
                                    to synonymous mutations, to quantify selection in coding sequences of cancer genomes. Using a
                                    nonsynonymous-to-synonymous substitution rate value >1 as a marker of cancer genes under posi-
                                    tive selection, they have identified 179 cancer genes, with about 50% of the coding driver mutations
                                    being found to occur in novel cancer genes. The authors, however, have concluded that purifying

Bányai et al. eLife 2021;10:e59629. DOI: https://doi.org/10.7554/eLife.59629                                                           8 of 76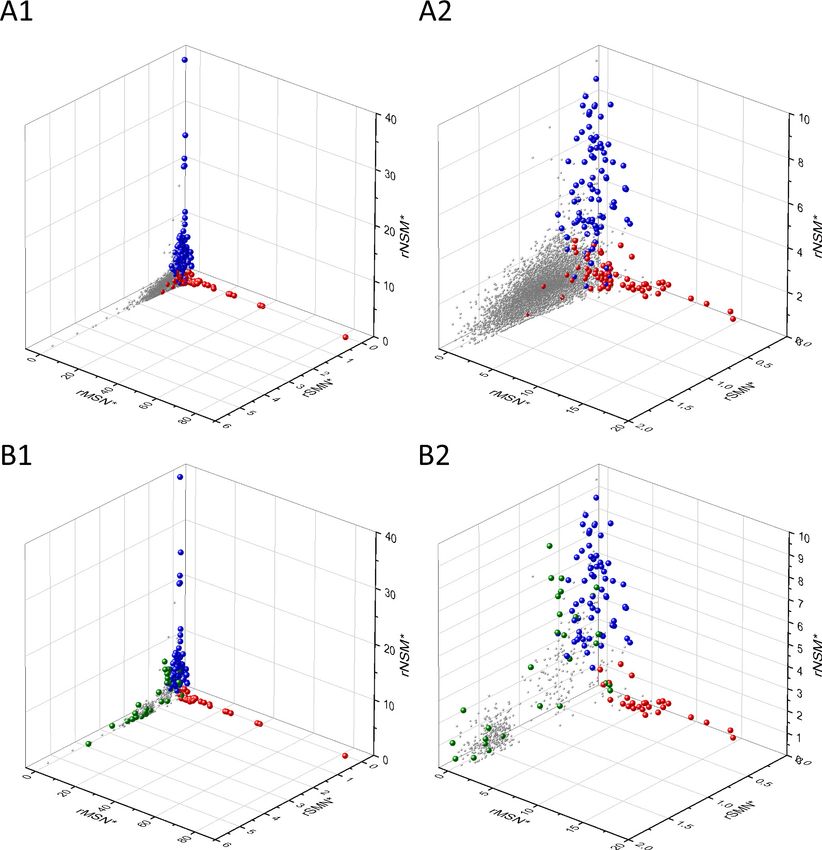
Research article                                                                                                   Cancer Biology

                                    selection is practically absent in tumors since nearly all (>99%) coding mutations are tolerated and
                                    escape negative selection. The authors have suggested that this remarkable absence of negative
                                    selection on coding point mutations in cancer indicates that the vast majority of genes are dispens-
                                    able for any given somatic lineage, presumably reflecting the buffering effect of diploidy and the
                                    inherent resilience and redundancy built into most cellular pathways.
                                        The key message of Martincorena et al., 2017 that negative selection has no role in cancer evo-
                                    lution had a major impact on cancer genomics research as reflected by several commentaries in
                                    major journals of the field that have propagated this conclusion (Bakhoum and Landau, 2017;
                                    Koch, 2017; Vitale and Galluzzi, 2018).
                                        Some more recent studies, however, contradict this conclusion. Although Zapata et al., 2018
                                    have also used the ratio of nonsynonymous-to-synonymous substitutions to identify genes that are
                                    under selection, they have detected significant negative selection in the case of 25 genes.
                                    López et al., 2020, focusing on dN/dS values for truncating mutations, have shown that purifying
                                    selection of essential genes is significant in early phases of tumor evolution (before whole genome
                                    duplications), whereas whole-genome doubling allows the accumulation of deleterious alterations.
                                    Tilk et al., 2020 have shown that appreciable negative selection (dN/dS ~ 0.4) is present in tumors
                                    with a low mutational burden, while the majority of tumors exhibit dN/dS ratios approaching 1, sug-
                                    gesting that tumors with higher mutational burden do not remove deleterious mutations.
                                        Van den Eynden and Larsson, 2017, however, cautioned that it is crucial to take into account
                                    mutational signatures when applying the dN/dS metric to cancer somatic mutation data. For exam-
                                    ple, the authors have shown that the low dN/dS values observed in malignant melanoma may be
                                    due to the predominance of C to T mutations in this tumor and do not necessarily indicate gene
                                    essentiality. The authors have also shown that purifying selection is very limited and similar in all
                                    tumor types if the dN/dS metric uses mutational signature-derived substitution probabilities.
                                        In view of the contradicting conclusions about the significance of negative selection in tumor evo-
                                    lution, in the present work we have reexamined this question using an approach that attempts to
                                    overcome some of the problems highlighted by earlier studies.
                                        First, most studies used a single dN/dS metric to measure nonsynonymous to synonymous substi-
                                    tution rates as indicators of selective pressure and paid less attention to the fact that the strength of
                                    purifying selection is an order of magnitude greater for nonsense mutations than for missense muta-
                                    tions (Gorlov et al., 2006). Furthermore, the use of a single dN/dS value for a transcript may pre-
                                    clude the simultaneous detection of positive and negative selection of activating and inactivating
                                    mutations, both of which might operate for a given gene. To overcome these limitations, in the pres-
                                    ent study we have used a clustering-based approach that can detect different signals of selection
                                    manifested in rates of nonsense, missense versus silent substitutions in the coding regions of genes.
                                        Second, an inherent problem with the detection of purifying selection in tumor tissues is that
                                    putative TEGs are likely to be undermutated relative to PGs and driver genes, resulting in low statis-
                                    tical power of their analyses based on dN/dS metrics. We have reduced this problem by combining
                                    subtle somatic mutations from different tumors types and limiting our work to transcripts that have
                                    at least 100 somatic mutations in tumors. (Note that the requirement of a minimum number of muta-
                                    tions does not place a theoretical limit on this approach; progress with genome-wide screens and
                                    collection of more data is overcoming this limitation.)
                                        In harmony with earlier observations, our analyses have confirmed that the vast majority of human
                                    genes are PGs that do not show detectable signals of selection, whereas known TSGs are positively
                                    selected for inactivating (primarily nonsense and frame-shift) mutations. Known OGs, however, were
                                    found to display signals of both negative selection for inactivating (nonsense, frame-shift) mutations
                                    and positive selection for activating (missense) mutations. Improved detection of signals of selection
                                    has permitted the identification of a number of novel driver genes that are likely to play important
                                    roles in carcinogenesis as TSGs or as OGs.
                                        Significantly, we have identified a cluster of human genes that show clear signs of negative selec-
                                    tion during tumor evolution, suggesting that their functional integrity is essential for the growth and
                                    survival of tumor cells. The group of negatively selected genes includes genes known to play critical
                                    roles in the Warburg effect of cancer cells, others are known to mediate invasion and metastasis of
                                    tumor cells, indicating that negatively selected TEGs may prove a rich source for novel targets for
                                    tumor therapy.

Bányai et al. eLife 2021;10:e59629. DOI: https://doi.org/10.7554/eLife.59629                                                         9 of 76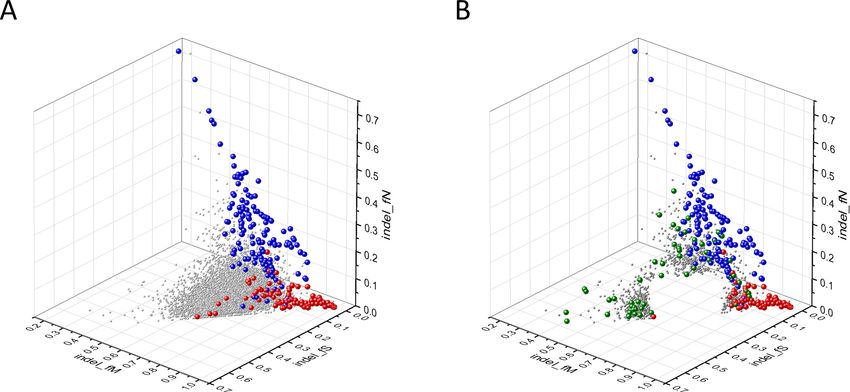
Research article Cancer Biology
Results
Distinguishing PGs and cancer genes
The rationale of the analyses described in the present work is that — due to their different roles in
carcinogenesis — proto-oncogenes, TSGs, TEGs, and PGs are expected to experience different pat-
terns of selection during tumor evolution and this is reflected in the relative rates of missense, non-
sense, and silent mutations of their protein-coding regions. To monitor these differences, we have
calculated for each transcript the fraction of somatic substitutions that could be assigned to the
silent (fS), misssense (fM), and nonsense (fN) category and analyzed their relative rates. (For details,
the reader should consult the Materials and methods section).
Our analyses have shown that in 3D scatter plots of the fS, fM, and fN values of transcripts the
majority of genes are present in a central cluster characterized by fS, fM, and fN values close to
those expected assuming no mutation bias and absence of selection, consistent with the view that
they correspond to PGs (Figure 2). Known OGs, however, were found in a separate cluster charac-
terized by higher fM values, reflecting positive selection for missense mutations, whereas the cluster
of known TSGs has higher fN values, reflecting positive selection for truncating nonsense mutations
(Figure 2B and C).
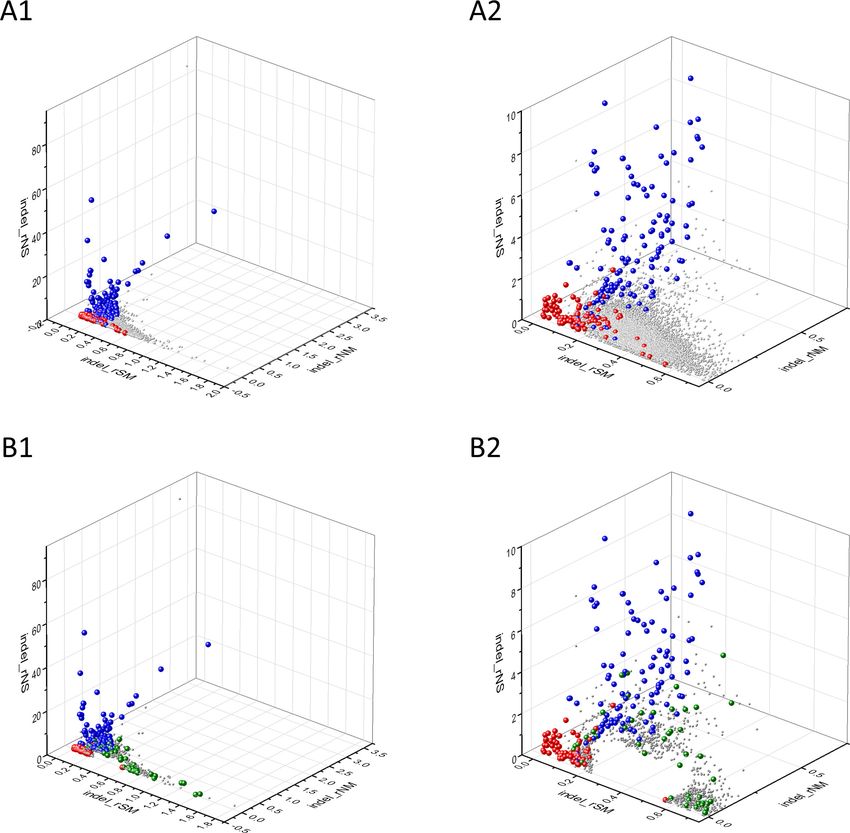
Known cancer genes also separate from the majority of human genes in 3D scatter plots of rSM,
rNM, rNS parameters, defined as the ratio of fS/fM, fN/fM, fN/fS, respectively (Figure 3). In these
scatter plots, OGs separate from the central cluster in having lower rSM and rNM values, whereas
TSGs have higher rNS and rNM values than those of the central cluster (Figure 3).
The separation of known cancer genes from the majority of human genes is even more manifest
in 3D scatter plots of parameters rSMN, rMSN, and rNSM defined as the ratio of fS/(fM+fN), fM/(fS
+fN), and fN/(fS+fM), respectively (Figure 4). In these plots, the transcripts form a three-pronged
cluster, with known OGs and TSGs being present on separate spikes of this cluster, the rMSN and
rNSM spikes, respectively (Figure 4).
There is, however, a fourth cluster of genes that deviates from the clusters of PGs, OGs, and
TSGs (Figures 2, 3 and 4). The high fS, rSM, and rSMN values of the transcripts in this group
Figure 2. Analyses of fS, fM, and fN parameters of human protein-coding genes of tumor tissues. The figure shows the results of the analysis of 13,803
transcripts containing at least 100 subtle, confirmed somatic mutations from tumor tissues, including only mutations identified as not single-nucleotide
polymorphisms (SNPs). Axes x, y, and z represent the fractions of somatic single-nucleotide substitutions that are assigned to the synonymous (fS),
nonsynonymous (fM), and nonsense (fN) categories, respectively. In Panel A, each gray ball represents a human transcript; note that the majority of
human genes are present in a dense cluster. Panel B highlights the positions of transcripts of the genes identified by Vogelstein et al., 2013 as
oncogenes (OGs, large red balls) or tumor suppressor genes (TSGs, large blue balls). It is noteworthy that these driver genes separate significantly from
the central cluster and from each other: OGs have a significantly larger fraction of nonsynonymous, whereas TSGs have significantly larger fraction of
nonsense substitutions. Panel C shows data only for candidate cancer genes present in the CG_SO2SD_SSI2SD list (see Materials and methods). The
positions of novel cancer gene transcripts validated in the present work are highlighted as large green balls.
Bányai et al. eLife 2021;10:e59629. DOI: https://doi.org/10.7554/eLife.59629 10 of 76Research article Cancer Biology Figure 3. Analyses of rSM, rNM, rNS parameters of human protein-coding genes of tumor tissues. The figure shows the results of the analysis of 13,803 transcripts containing at least 100 subtle, confirmed somatic mutations from tumor tissues, including only mutations identified as not single-nucleotide polymorphisms (SNPs). Axes x, y, and z represent the rSM, rNM, rNS values defined as the ratio of fS/fM, fN/fM, fN/fS, respectively. Each ball represents a human transcript; the positions of transcripts of the genes identified by Vogelstein et al., 2013 as oncogenes (OGs, large red balls) or tumor suppressor genes (TSGs, large blue balls) are highlighted. Panels A1, A2 show the distribution of the 13,803 transcripts at different magnification. Note that the majority of human genes are present in a dense cluster but known OGs and TSGs separate significantly from the central cluster and from each other. The rNS and rNM values of TSGs are higher, whereas the rSM and rNM values of OGs are lower than those of passenger genes. Panels B1, B2 show data only for candidate cancer genes present in the CG_SO2SD_SSI2SD list (see Materials and methods). The positions of novel cancer gene transcripts validated in the present work are highlighted as large green balls. Bányai et al. eLife 2021;10:e59629. DOI: https://doi.org/10.7554/eLife.59629 11 of 76
Research article                                                                                                           Cancer Biology

Figure 4. Analyses of rSMN, rMSN, and rNSM parameters of human protein-coding genes of tumor tissues. The figure shows the results of the analysis
of transcripts containing at least 100 subtle, confirmed somatic mutations from tumor tissues, including only mutations identified as not single-
nucleotide polymorphisms (SNPs). Axes x, y, and z represent the rSMN, rMSN, and rNSM defined as the ratio of fS/(fM+fN), fM/(fS+fN), and fN/(fS+fM).
Each ball represents a human transcript; the positions of transcripts of the genes identified by Vogelstein et al., 2013 as oncogenes (OGs, large red
balls) or tumor suppressor genes (TSGs, large blue balls) are highlighted. Panels A1, A2 show the distribution of the 13,803 transcripts at different
magnification. Note that the majority of human genes are present in a dense cluster but known OGs and TSGs separate significantly from the central
cluster and from each other. The rNSM values of TSGs are higher, their rMSN and rSMN are lower than those of passenger genes (PGs). OGs also
separate from PGs in that their rMSN values are higher and their rSMN and rNSM values are lower than those of PGs. Panels B1, B2 show data only for
candidate cancer genes present in the CG_SO2SD_SSI2SD list (see Materials and methods). The positions of novel cancer gene transcripts validated in
the present work are highlighted as large green balls.

Bányai et al. eLife 2021;10:e59629. DOI: https://doi.org/10.7554/eLife.59629                                                                12 of 76
Research article                                                                                                               Cancer Biology

                                     suggest that they are subject to purifying selection during tumor evolution, raising the possibility
                                     that this group may contain genes essential for the survival of tumors.
                                         The analyses discussed above did not take into account the impact of differences in mutation
                                     probability on the fN, fM, and fS values of transcripts. To check the influence of this factor, we have
                                     calculated the expected fN*, fM*, and fS* values for all human transcripts using the probabilities of
                                     the six substitution classes (C>A, C>G, C>T, T>A, T>C, and T>G) observed across tumors (for dea-
                                     tails the reader should consult the Materials and methods section).
                                         The various types of observed/expected ratios (rN*, rM*, rS*; rSM*, rNM*, rNS*; rSMN*, rMSN*
                                     and rNSM*) were calculated for each transcript and the data were analyzed in 3D scatter plots as
                                     described above for the observed values. As shown in Figures 5, 6 and 7, the distribution of tran-
                                     scripts in these 3D scatter plots are similar to those observed in the corresponding Figures 2, 3 and
                                     4, indicating that the separation of the clusters of PGs, OGs, TSGs, and TEGs is relatively insensitive
                                     to transcript-specific differences in mutation probabilities.

                                     Analyses of candidate cancer gene sets
                                     We assumed that the genes whose patterns of subtle mutations deviate significantly (by more than
                                     2SD) from those of prototypical PGs are enriched in cancer genes that play important role in carcino-
                                     genesis. The patterns of subtle mutations of candidate cancer genes assign them to one of the three
                                     main clusters that show signs of positive and/or negative selection (see Figures 2–7). (A) Genes posi-
                                     tively selected for inactivating (nonsense and frame-shift) mutations – putative TSGs; (B) genes posi-
                                     tively selected for missense mutations and negatively selected for inactivating mutations – putative
                                     proto-oncogenes; (C) negatively selected genes – putative TEGs.
                                        The assumption that the cancer genes assigned to these three clusters play significant roles in car-
                                     cinogenesis has strong support in the case of the first two categories: the approach used in the pres-
                                     ent study correctly assigned the known, ‘gold standard’ TSGs and OGs (Supplementary file 1). In
                                     the case of the third category, however, no similar gold standard exists for TEGs.
                                        To check the validity and predictive value of the assumption that the genes assigned to the three
                                     clusters play critical roles in carcinogenesis, we have selected a number of genes at random from

Figure 5. Analyses of rS*, rM*, and rN* parameters of human protein-coding genes of tumor tissues. The figure shows the results of the analysis of
transcripts containing at least 100 subtle, confirmed somatic mutations from tumor tissues. Axes x, y, and z represent rS*, rM*, and rN* values,
respectively. In Panel A, each gray ball represents a human transcript; note that the majority of human genes are present in a dense cluster. Panel B
highlights the positions of transcripts of the genes identified by Vogelstein et al., 2013 as oncogenes (OGs, large red balls) or tumor suppressor
genes (TSGs, large blue balls). It is noteworthy that these driver genes separate significantly from the central cluster and from each other: OGs have a
significantly larger fraction of nonsynonymous, whereas TSGs have significantly larger fraction of nonsense substitutions than expected. Panel C shows
data only for candidate cancer genes present in the CG_SO2SD_SSI2SD list (see Materials and methods). The positions of novel cancer gene transcripts
validated in the present work are highlighted as large green balls.

Bányai et al. eLife 2021;10:e59629. DOI: https://doi.org/10.7554/eLife.59629                                                                    13 of 76
Research article Cancer Biology
Figure 6. Analyses of rSM*, rNM*, rNS* parameters of human protein-coding genes of tumor tissues. The figure shows the results of the analysis of
transcripts containing at least 100 subtle, confirmed somatic mutations from tumor tissues. Axes x, y, and z represent rSM*, rNM*, rNS* values,
respectively. Each ball represents a human transcript; the positions of transcripts of the genes identified by Vogelstein et al., 2013 as oncogenes
(OGs, large red balls) or tumor suppressor genes (TSGs, large blue balls) are highlighted. Panels A1 and A2 show the distribution of the transcripts at
different magnification. Note that the majority of human genes are present in a dense cluster but known OGs and TSGs separate significantly from the
central cluster and from each other. The rNS* and rNM* values of TSGs are higher, whereas the rSM* and rNM* values of OGs are lower than those of
passenger genes. Panels B1, B2 show data only for candidate cancer genes present in the CG_SO2SD_SSI2SD list (see Materials and methods). The
positions of novel cancer gene transcripts validated in the present work are highlighted as large green balls.
each cluster for further in-depth analyses. We have used three criteria to select genes for detailed
analyses from the combined list of candidate cancer genes that deviate from the central clusters of
PGs by more than 2SD (see Materials and methods). (1) The candidate gene is among the genes
showing the strongest signals of selection characteristic of the given group. (2) The candidate gene
is novel in the sense that it is not listed among the 145’ gold standard’ OGs and TSGs of
Vogelstein et al., 2013 or among the 719 cancer genes of CGC (Sondka et al., 2018). (3) There is
substantial experimental information in the scientific literature on the given gene to permit the
assessment of its role in carcinogenesis.
The genes discussed below include genes positively selected for truncating mutations (putative
TSGs), genes positively selected for missense mutations and negatively selected for inactivating
mutations (putative proto-oncogenes) and negatively selected genes (putative TEGs). In the main
text, we summarize only the major conclusions of our analyses; for annotations of the individual
Bányai et al. eLife 2021;10:e59629. DOI: https://doi.org/10.7554/eLife.59629 14 of 76Research article Cancer Biology
Figure 7. Analyses of rSMN*, rMSN*, and rNSM* parameters of human protein-coding genes of tumor tissues. The figure shows the results of the
analysis of transcripts containing at least 100 subtle, confirmed somatic mutations from tumor tissues. Axes x, y, and z represent the rSMN*, rMSN*, and
rNSM* values, respectively. Each ball represents a human transcript; the positions of transcripts of the genes identified by Vogelstein et al., 2013 as
oncogenes (OGs, large red balls) or tumor suppressor genes (TSGs, large blue balls) are highlighted. Panels A1, A2 show the distribution of the
transcripts at different magnification. Note that the majority of human genes are present in a dense cluster but known OGs and TSGs separate
significantly from the central cluster and from each other. The rNSM* values of TSGs are higher, their rMSN* and rSMN* are lower than those of
passenger genes (PGs). OGs also separate from PGs in that their rMSN* values are higher and their rSMN* and rNSM* values are lower than those of
PGs. Panels B1, B2 show data only for candidate cancer genes present in the CG_SO2SD_SSI2SD list (see Materials and methods). The positions of novel
cancer gene transcripts validated in the present work are highlighted as large green balls.
genes, the reader should consult Appendix 1. We discuss examples of negatively selected genes in
the main text in more detail since earlier studies that focussed on positive selection of driver muta-
tions inevitably missed these genes. We also discuss some instructive examples of’ false’ hits, that is
cases where the mutation parameters deviate significantly from those of PGs, but this deviation is
not due to selection.
Novel cancer genes positively selected for nonsense mutations
We have selected genes positively selected for truncating mutations from the combined list of candi-
date transcripts, that is, transcripts whose parameters deviate from those of PGs by more than 2SD
Bányai et al. eLife 2021;10:e59629. DOI: https://doi.org/10.7554/eLife.59629 15 of 76Research article Cancer Biology
(for details see Materials and methods). We have used the additional restriction that genes with
indel_rNSM 0.125) with lists
identified by others (Supplementary file 1) revealed that ~60–100 of our candidate TSG-like genes
are also found in several gene lists identified by others through analyses of somatic mutations of
tumor tissues. Many of the genes selected for annotation are present in at least one of the candidate
gene lists identified by others; the genes of MGA, RASA1, TGIF1, ZFP36L2, and ZNF750 are present
in multiple cancer gene lists (Supplementary file 1). It is noteworthy, however, that RNF128,
SLC16A1, SPRED1, TNRC6B, and TTK are novel in that they are found only among the candidate
cancer genes identified by forward genetic screens in mice (Abbott et al., 2015) or among the
genes whose expression changes in cancer (Torrente et al., 2016).
We have also analyzed the genes present in dataset CG_SO*2SD_rNSM >3, that is, candidate can-
cer genes for which the observed rNSM values are more than threefold higher than expected taking
into account mutational signature-derived substitution probabilities of tumors (Supplementary file
2). We have found that 164 (100%) of the 164 genes present in this dataset are also present in the
dataset CG_SSI2SD rNSM >0.125. It is noteworthy that the majority of candidate TSGs selected for
annotation (B3GALT1, BMPR2, BRD7, ING1, MGA, PRRT2, RASA1, SLC16A1, SPRED1, TGIF1,
Table 1. Assignment of novel positively or negatively selected cancer genes to key cellular
processes of carcinogenesis.
Hallmarks of cancer Gene symbol
Defects of genome, epigenome, CDK8, FOXG1, IDH3B, MARCH7, MGA, NOVA1,
transcriptome, or proteome maintenance PNCK, RNF128, TGIF1, TNRC6B, TWIST1, ZC3H13,
ZFP36L1, ZFP36L2, ZNF750
Sustained proliferation AURKA, BRD7, ING1, FOXG1, MAPK13, PNCK,
PRRT2, RASA1, RIT1, SPRED1, TRIB2, TTK, YAP1,
YES1, ZFP36L1, ZFP36L2, ZNF750
Evasion of growth suppressors
Reprogramming of metabolism BRD7, G6PD, SLC16A1, SLC16A3, SLC2A1, SLC2A8,
YAP1, YES1
Replicative immortality NOVA1
Evasion of cell death BRD7, ING1, MAPK13, PNCK, PRRT2, TP73, TRIB2,
TTK, YAP1, YES1, ZNF750
Evasion of immune destruction
Tumor promoting inflammation BMP2R, CCR2, CCR5, CX3CR1, MAPK13
Inducing angiogenesis CCR2
Activation of invasion and metastasis CCR2, CCR5, CX3CR1, RASA1, TBXA2R
For annotation of novel genes identified in the present study see Appendix 1. The names of negatively selected
genes are marked by bold underline.
Bányai et al. eLife 2021;10:e59629. DOI: https://doi.org/10.7554/eLife.59629 16 of 76You can also read