Using A/B Testing in MOOC Environments
←
→
Page content transcription
If your browser does not render page correctly, please read the page content below
Using A/B Testing in MOOC Environments

                          Jan Renz                                   Daniel.Hoffmann                        Thomas Staubitz
                 Hasso Plattner Institute                         Hasso Plattner Institute                Hasso Plattner Institute
                Prof.-Dr.-Helmert-Str. 2-3                       Prof.-Dr.-Helmert-Str. 2-3              Prof.-Dr.-Helmert-Str. 2-3
                   Potsdam, Germany                                 Potsdam, Germany                        Potsdam, Germany
                    jan.renz@hpi.de                           daniel.hoffmann@hpi.de                   thomas.staubitz@hpi.de
                                                                 Christoph Meinel
                                                                  Hasso Plattner Institute
                                                                 Prof.-Dr.-Helmert-Str. 2-3
                                                                    Potsdam, Germany
                                                             christoph.meinel@hpi.de

ABSTRACT                                                                             1.    INTRODUCTION
In recent years, Massive Open Online Courses (MOOCs)
have become a phenomenon offering the possibility to teach                           1.1   Controlled Online Tests
thousands of participants simultaneously. In the same time                           In the 18th century, a British naval captain wondered why
the platforms used to deliver these courses are still in their                       sailors serving on the ships of the Mediterranean countries
fledgling stages. While course content and didactics of those                        did not suffer from scurvy. On those ships, citrus fruits were
massive courses are the primary key factors for the success                          part of the rations. So he ordered one half of his crew to eat
of courses, still a smart platform may increase or decrease                          limes (the treatment group), while the other half consumed
the learners experience and his learning outcome. The paper                          the same rations they received before (the control group).
at hand proposes the usage of an A/B testing framework                               Despite the displeasure of the crew, the experiment was
that is able to be used within an micro-service architecture                         successful. Without knowing the cause of the effect (that
to validate hypotheses about how learners use the platform                           lack of vitamin C caused scurvy), he found out that limes
and to enable data-driven decisions about new features and                           prevented it [18]. This lead to citrus fruits being a part of
settings. To evaluate this framework three new features                              the sailor’s rations and a healthier crew on all ships.
(Onboarding Tour, Reminder Mails and a Pinboard Digest)
have been identified based on a user survey. They have been                    In the late 1990s, Greg Linden, a software engineer at Ama-
implemented and introduced on two large MOOC platforms                         zon, developed a prototype showing product recommenda-
and their influence on the learners behavior have been mea-                    tions based on the current shopping cart content at check-
sured. Finally this paper proposes a data driven decision                      out [13]. He was convinced that transferring the impulse
workflow for the introduction of new features and settings                     buys, like candy at the checkout lane, from grocery stores
on e-learning platforms.                                                       to online shopping and improving them by personalization
                                                                               would increase the conversion rate and so lead to more in-
                                                                               come for the shop. While he received positive feedback from
Categories and Subject Descriptors                                             his co-workers, one of his bosses, a marketing senior vice-
H.4 [Information Systems Applications]; H.5 [Information president strongly opposed his idea because he believed it
interfaces and presentation]; K.3.1 [Computer Uses in                          would distract customers from checking out and therefore
Education]; J.4 [Social and Behavioral Sciences]                               lead to a loss of revenue. So Linden was forbidden to work on
                                                                               it any further. Being convinced of the possible impact he did
                                                                               not follow this management decision, but instead launched a
Keywords                                                                       controlled online test. One group of customers saw the rec-
MOOC, A/B Testing, microservice, E-Learning, Controlled                        ommendations, the other did not. The senior vice-president
Online Tests                                                                   was furious when he found out that the feature was launched.
                                                                               But it “won by such a wide margin that not having it live
                                                                               was costing Amazon a noticeable chunk of change”, so he
Permission to make digital or hard copies of all or part of this work for per- could not keep up his concerns. The feature was rolled out
sonal or classroom use is granted without fee provided that copies are not     for all users short time later. Today testing is an essential
made or distributed for profit or commercial advantage and that copies bear    part of amazons philosophy.
this notice and the full citation on the first page. Copyrights for components
of this work owned by others than the author(s) must be honored. Abstract-
ing with credit is permitted. To copy otherwise, or republish, to post on            These two examples show how experimentation helps to vali-
servers or to redistribute to lists, requires prior specific permission and/or a     date hypotheses with data and how they may also contradict
fee. Request permissions from Permissions@acm.org.                                   intuition and preconceptions. As pointed out by Thomke,
LAK ’16, April 25 - 29, 2016, Edinburgh, United Kingdom                              “experimentation matters because it fuels the discovery and
Copyright is held by the owner/author(s). Publication rights licensed to             creation of knowledge and thereby leads to the development
ACM.
ACM 978-1-4503-4190-5/16/04...$15.00                                                 and improvement of products, processes, systems, and orga-
DOI: http://dx.doi.org/10.1145/2883851.2883876                                       nizations.” ([25])

                                                                               304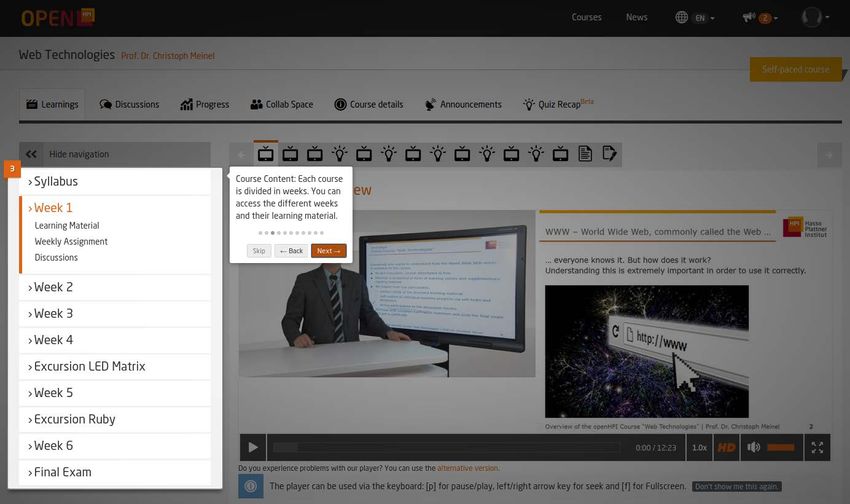
Experimentation has long been costly and time-consuming                     A/B Testing Framework and the underlying Learning
as it would require special lab setups or paying agencies,                  Analytics Engine.
but the web makes it possible to quickly and cost-efficiently
evaluate new ideas using controlled experiments, also called              • Section 4 describes how the possible test candidates
A/B tests, split tests, or randomized experiments [9]. As                   have been identified.
stated in [8] it can be expected that small changes can have              • In Section 5 the three A/B tests conducted and their
a big impact to key metrics. They also integrate well with                  results are introduced and discussed.
agile methodologies, such as the ones described in Lean
Startup by Eric Ries, which “is an approach for launching                 • A conclusion and a discussion of future work can be
businesses and products, that relies on validated learning,                 found in Section 6.
scientific experimentation, and iterative product releases to
shorten product development cycles, measure progress, and            2.    A/B TESTING IN MICROSERVICE BASED
gain valuable customer feedback.” ([11]). He states that no
one, in despite of his expertise can fully anticipate the users’           LEARNING PLATFORMS
behaviour, so only by testing the best solutions for both the        With the advent of MOOCs a large amount of educational
user and the provider can be determined.                             data became available. There are two communities dealing
                                                                     with its analysis: Learning Analytics and Educational Data
MOOCs (used here as a synonym for scalable e-learning                Mining. While they have many things in common, both
platforms) provide their service to thousands of learners, so        are concerned about how to collect and analyze large-scale
they have a critical mass of users that enables the platform         educational data for a better understanding of learning and
providers to run those controlled online experiments. Instead        learners, they have slightly different goals [23]. Learning
of using these tests to increase conversion rates or sales, the      Analytics aims at providing insights to teachers and learners,
aim here is to identify instruments to optimize the learning         whereas Educational Data Mining rather focuses on auto-
experience and the learning outcome of those users.                  matic adaptation of the learning process with not necessarily
                                                                     any human interference.
1.2    openHPI                                                       For a better evaluation of learning data across different
This work focuses on the MOOC platforms openHPI and                  MOOCs, a general database schema was proposed by Veera-
openSAP. openHPI is a non-profit project provided by the             machaneni et al. called MOOCdb [26, 7]. The authors suggest
Hasso Plattner Institute (HPI) in Potsdam, Germany for               developing a “shared standard set of features that could be
opening courses derived from the curriculum of the Institute         extracted across courses and across platforms” ([26]). The
for the general public.                                              schema includes three different modes named observing, sub-
                                                                     mitting, collaborating and feedback.
The web university team of the chair of Internet and Web
Technologies had previous experience with online learning            Another approach is the Experience API (also known as xAPI
research, having established the tele-TASK platform for              or TinCan API) suggested by the Advanced Distributed
recorded HPI lectures. They also provide a tele-recording            Learning (ADL) Initiative [1]. It defines a way to store
system. But they have never been fully satisfied with the            statements of experience, typically but not necessarily in a
usage of the provided content.                                       learning environment. A statement has at least three parts
                                                                     actor, verb and object representing subject, verb and object
In November 2012, the first MOOC in German language was              in a sentence. Additional properties can include references to
held on openHPI, rendering HPI one of the first European             resources like an UUID as id, a result denoting the outcome,
MOOC providers. In 2014 an average of 7,000 participants             contextual information in context or the time of the statement
have been enrolled at course end [17]. SAP, a well-known             in timestamp.
German software company, published their first MOOC on
openSAP in May 2013. It targets professionals working with           In order to gather learning data on openHPI, a versatile and
SAP products and is also used to educate SAP employees [22].         scalable solution called Lanalytics which allows to track user
                                                                     actions in a service-oriented environment [19] (for details on
Both providers use the same underlying system, internally            openHPI’s distributed architecture see subsection 2.1) was
called Xikolo (Tsonga, a Bantu language, for school). Thus,          implemented. The recorded actions can be stored in a variety
the implementation of the A/B Testing framework and                  of different formats (such as MOOCdb and Experience API)
the changes to the user interface are equally applicable for         and data stores (such as PostgreSQL1 , a relational database,
openHPI and openSAP and have been applied in the aca-                elasticsearch2 , a document database, and Neo4j3 , a graph
demic context as well as in the enterprise learning context.         database). This LAnalytics framework sets the foundation
                                                                     for further research in this work.

This paper describes the introduction of an A/B-Testing              2.1     openHPI Architecture
Framework to a micro-service based MOOC platform and                 openHPI is based on a micro-service architecture [15], which
the results obtained evaluating this service with different          means there is no monolithic application, but multiple ser-
A/B tests. The remainder of the paper at hand is structured          vices, each with a defined responsibility [12]. The decision
as follows:                                                          1
                                                                       PostgreSQL: http://www.postgresql.org
                                                                     2
                                                                       elasticsearch: https://www.elastic.co
                                                                     3
   • Section 2 gives an overview on the architecture of the            Neo4j: http://neo4j.com

                                                               305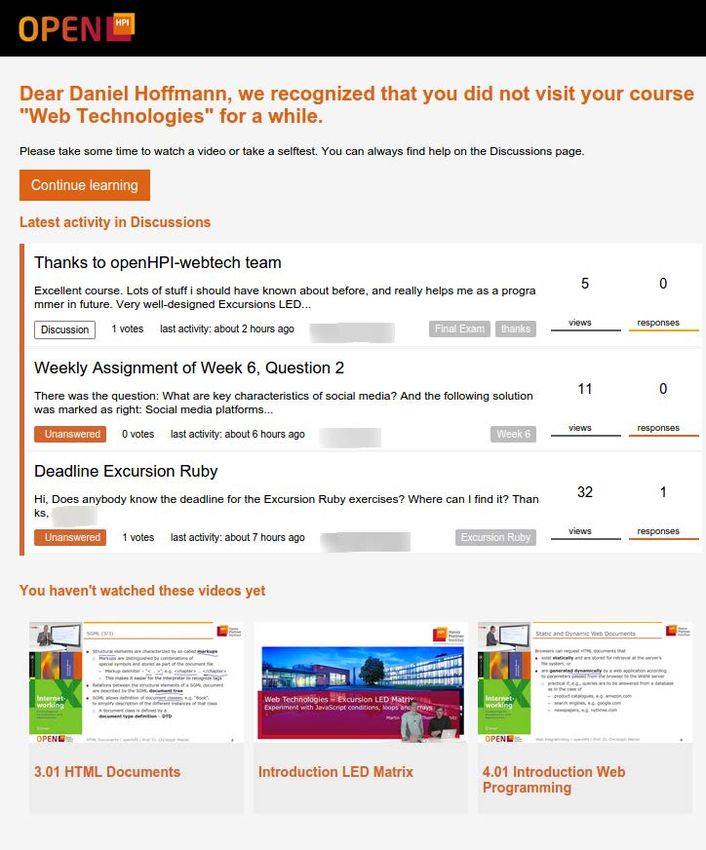
to go for a Service Oriented Architecture was based on the           a set of rules and deciding if the user should be in the test
learnings that resulted from employing and extending a mono-         or the control group for each requested test. In Figure 1
lithic application to run MOOCs in a previous version of             the communication between the different parts of the system
the platform. Each service runs in its own process and               is shown in more detail. While this workflow generates
handles only a small amount of data storage and business             additional requests, there was no measurable performance
logic. This approach has a number of advantages. As the              decrease of the front-end, as this calls could be run in parallel
services are designed around capabilities, each service can          with other calls to the server backend. All code that is
use the technology that serves best the use case including           related to a function that is currently in A/B testing must be
different programming languages or DBMS that fit best [12].          encapsulated in a code block. This code will only be executed
Currently all but one service is implemented as a RubyOn-            if this user is part of the test group. This way of implemented
Rails application due to the existing developer qualification.       features could later be used to make this feature being active
Scaling in a micro-service architecture can be realized by           or deactivated on a per platform or per user base using so
distributing the services across servers, replicating only those     called feature flippers, so this can be considered no extra
needed. With a monolithic application, the complete appli-           work.
cation has to be replicated. Each service can be deployed
independently, which makes it easier to continuously deploy
new versions of the services [20]. In contrast to monolithic
applications a fault in one service does not necessarily affect
the whole application. Lastly, micro-services are relatively
small and therefore easier to understand for a developer.
Most of openHPI’s developers are students and spend only
a few hours per week actively developing. Therefore, this
architecture not only minimizes the risk of breaking other
parts of the software (by isolation), it also enables developers
to become experts in a certain part of the app (exposed by
one or more services).

While having many advantages, the presented architecture
prohibits using one of the many available A/B-Testing solu-
tions like the Ruby gems split 4 and vanity 5 . These libraries
are designed to work within monolithic applications. Other
existing solutions, such as Optimizely use JavaScript to al-
ter the interface and to measure events. These solutions
mostly target marketing driven A/B Tests with a simple
set of metrics and changes (for example display a different
pricetag or alternative landing page). But in our case many
functionalities that might me relevant for A/B testing are
not only part of the User Interface (UI). Instead they might
include actions that happen in one of the underlying services
or even asynchronous actions that are not UI related at all.
This is where UI focused approaches will fail.

Additionally, the measured metric is not simply tracking
conversions, but queries possibly complex data gathered by
the Learning Analytics framework [24]. Furthermore the
used metrics may consist of learning data. Keeping this
data within the system and not sending it to a 3rd party
tool avoids problems with data privacy. So a dedicated
custom prototype was built to enable A/B testing in the
Xikolo-framework.

2.2    Workflow
Each time a user accesses a page within the learning platform,
the system detects if there are any tests currently running
in the scope of the visited page by querying the Grouping
                                                                     Figure 1: Abstract sequence diagram showing the
Service. If there are tests running, the system needs to check
                                                                     communication between the browser and the ser-
if the user has one of this test features enabled. This check
                                                                     vices.
is handled by the Account Service. It will return an already
given test group assignment or create a new one by applying
4
  split, the Rack Based A/B testing framework: https://              2.3    Administrators Dashboard
github.com/splitrb/split                                             The creation of new AB tests with a certain complexity
5                                                                    involves writing additional code and taking care that this
  Vanity, Experiment Driven Development for Ruby: https:
//github.com/assaf/vanity                                            code is well tested and rolled out, so this part can only be

                                                               306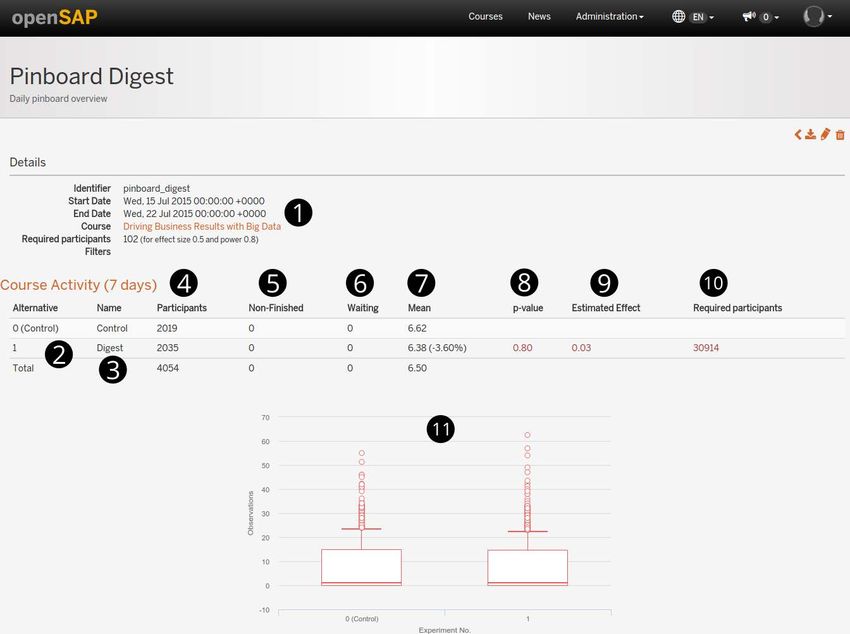
provided by the development team. The management of                 to pass in between the beginning of the user test (the user
running A/B tests can be achieved using a newly introduced          being assigned to one of the groups and presented with a
section within the backend of the learning software. There,         certain functionality) and the measurement of the metrics.
administrators (or all users equipped with the needed set           If the user test is course-specific, only actions concerning
of permission) can enable, edit and view user tests. This           this course are queried. The amount of time relates on the
includes not only the meta data of the user tests, but also         metrics. Metrics that are based on the learning outcome
the live test results. All those users can see the gathered         might need a certain amount of self tests done by the users
data on a dashboard shown in item 2. For each metric the            or the course to be ended. Other metrics that focus on user
number of participants, the number of participants that did         activity may need at least some days.
not yet finish the user test and the number of participants for
whom the metric wait interval did not end yet is displayed.         Most of the metrics query data is gathered by the LAnalytics
If a metric has been evaluated for some users in both groups        service. This service processes messages sent in the services
the effect size is displayed, calculated as Cohen’s d [3].          on certain events, for example if a user asks a new question,
                                                                    answers one or watches a video. This data is then sent and
                                                                    received using the Msgr gem6 , which builds on RabbitMQ 7 .
                                                                    The received events are then transformed and processed by
                                                                    several pipelines. While this is an asynchronous processing,
                                                                    usually all events are processed near real time. The LAna-
                                                                    lytics service allows the usage of different storage engines,
                                                                    however all relevant events for the metrics for this tests
                                                                    are stored in an elasticsearch instance using the Experience
                                                                    API [1] standard. An Experience API statement consists
                                                                    of four parts: subject, verb and object, in this case user,
                                                                    verb and resource. The resource needs a UUID (Universally
                                                                    Unique Identifier) and can contain additional information for
                                                                    faster processing for example the question title. Additionally,
                                                                    the statement has a timestamp and a context, for example
                                                                    the course ID.

                                                                    The following metrics are currently implemented and can be
                                                                    used within A/B tests:
Figure 2: Screenshot of the administrators dash-
board of a user test showing 1) general properties of               3.1     Pinboard Posting Activity
the test, 2) and for each metric the indices 3) and                 The pinboard posting activity counts how often a user asks,
names of the test groups, 4) the number of partic-                  answers and comments questions and discussions in the pin-
ipants, 5) the number of participants that did not                  board of a course.
finish the test, 6) the trials waiting for the metric
result, 7) the mean of the group, 8) the p-value of                 Verbs: ASKED QUESTION, ANSWERED QUESTION,
statistical significance, 9) the effect size, 10) the re-           COMMENTED
quired number of participants for a power of 0.8,
11) box plots of the group results.
                                                                    3.2     Pinboard Watch Count
                                                                    The pinboard watch count denotes the number of viewed
3.   METRICS                                                        questions and discussions of a user.
Witte and Witte define quantitative data as “a set of ob-
servations where any single observation is a number that
                                                                    Verb: WATCHED QUESTION
represents an amount or a count”, whereas qualitative data is
defined as “a set of observations where any single observation
is a word, or a sentence, or a description, or a code that          3.3     Pinboard Activity
represents a category” ([28]).                                      This pinboard activity combines pinboard posting activity
                                                                    and pinboard watch count. Considering the different amounts
Thus, quantitative data describes the intensity of a feature        of effort, a weighting is applied. The posting activity con-
and is measured on a numerical scale. Qualitative data has          tributes with a ratio of 90%, while the watch count is weighted
a finite number of values and can sometimes be ordinally            with 10%.
scaled. Qualitative usability studies observe directly how
the user interacts with the technology, noting their behavior       3.4     Question Response Time
and attitudes, while quantitative studies indirectly gather         The question response time denotes how long after a question
numerical values about the interaction, mostly for a later          was asked, the question is answered by a user. To compute
mathematical analysis [21].                                         this metric all Experience API statements with the verb
                                                                    ANSWERED QUESTION are retrieved for a user, then the
Each user test can have multiple metrics based on quantita-         matching ASKED QUESTION statement is queried and
tive data, for example if the user enrolled in the course in
                                                                    6
question or the number of specific actions performed by the             Msgr: https://github.com/jgraichen/msgr
                                                                    7
user in a given time frame. Most metrics require some time              RabbitMQ: https://www.rabbitmq.com/

                                                              307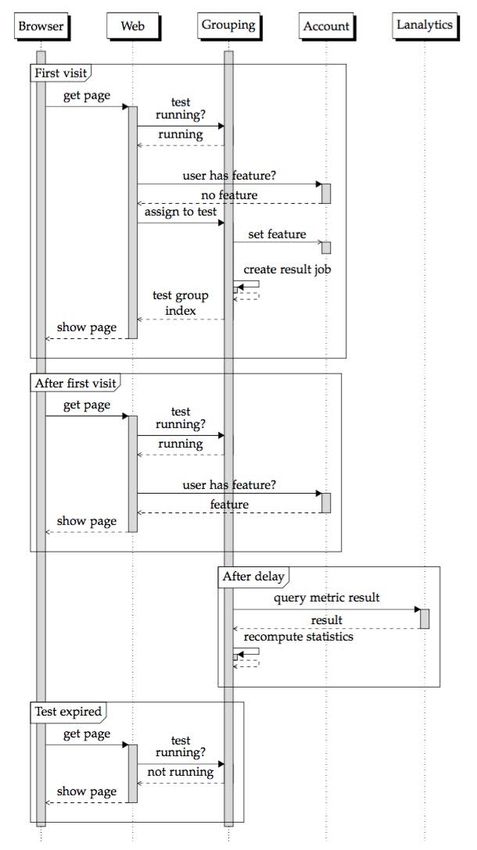
the average difference between this timestamps is computed.         which have an impact on the user’s performance. While 66%
Since not all users answer questions in the specified time          of all students of the analyzed course with an absence of less
frame, empty values need to be allowed, but these values are        than two weeks entered the final exam and scored 71% on
removed before significance testing.                                average, only 13% of the students that were absent longer
                                                                    than one month took the final exam with a mean score of
3.5     Visit Count                                                 46%.
The visit count denotes how many items a user visited, in-
cluding videos, selftests and text parts. This metric can be        Several recent works addressed this issue. One counter-
filtered by time and course. Verbs: VISITED                         measure is to make the course content available for every
                                                                    interested person. Only if wanting to take an assignment or
                                                                    to contribute to the forums a registration is necessary. This
3.6     Video Visit Count                                           way people that just want to take a look at the content but
The video visit count denotes the number of visited videos          are not interested in taking the course are filtered out from
per user. This metric can be filtered by time, video and            the participants.
course.
                                                                    Yang et al. [29] point out that higher social engagement
Verb: VISITED                                                       corresponds with lower dropout, because it “promotes com-
Filter: content type == video                                       mitment and therefore lower attrition”. This was also shown
                                                                    by Grünewald et al. [5] in an analysis of the first two openHPI
3.7     Course Activity                                             courses. However, one half of the participants did not actively
The course activity summarizes the aforementioned metrics           participate in forum discussions. openHPI programming
to measure the overall activity of a user in a course. The          courses have higher completion rates than other courses. An
pinboard activity is weighted with 50%, while the visit count       average of 31% received a certificate in the two program-
is included without weight.                                         ming courses, while the average completion rate in 2014 was
                                                                    19.2% [17]. The courses provide an interactive programming
                                                                    environment. Exercises have predefined test cases, against
3.8     Course Points                                               which students can try their code against. This higher engage-
After the end of a course the number of points are persisted        ment of learners might be a reason for the larger completion
and the quantiles of the users’ points are calculated. For each     rate.
enrollment a completed event is emitted, which is received
and processed by the LAnalytics Service. The course points
metric returns the number of points a user received in a
                                                                    4.2    User Experience Survey
specified course.                                                   For a prior investigation of how users perceive their experi-
                                                                    ence on openHPI, we conducted a survey. It was announced
Verbs: COURSE COMPLETED                                             via an email to all users and on openHPI’s social media
                                                                    channels. From March 25, 2015 to May 25, 2015, all users
                                                                    have been asked for their opinion about their user experience
3.9     Micro Survey                                                on and the usability of the platform. The survey contained
Not all interface changes can be evaluated with an objective        questions about existing functionalities, but also about un-
metric, for example design changes. For these cases a quali-        finished or unpublished functionalities and functionalities
tative feedback metric is used. It allows for fast evaluation       not available on the platforms, but maybe available on other
by prompting users to rate whether they like the displayed          MOOC platforms. The survey yielded 512 responses of which
version. In contrast to the other metrics, this one is just a       161 were incomplete. For the following evaluation only the
concept and is not yet implemented. For this metric every           complete responses are considered. 61% of the participants
users would be asked to rate a functionality or a design.           are older than 40 years and 63% are male. 71.6% of all par-
Then the ratings provided by test and control group can be          ticipants are satisfied with the overall usability of openHPI
compared.                                                           (a rating of 4 or 5 on a scale from 1 to 5). 73% were satisfied
                                                                    with the learnability, 73.1% with the video player and 71.9%
4.     IDENTIFYING TEST CANDIDATES                                  with the tests. Only the discussions deviate from these re-
To utilize the power of an A/B Testing framework, possible          sults. They have a satisfaction rate of 61.5%. Additionally,
test candidates must be identified and selected.                    when asked whether the discussions support their learning
                                                                    process, only 36.1% agreed. Regarding gamification, 29.7%
                                                                    rated the importance of gamified elements for them with 4 or
4.1     Dropout and Absence in MOOCs                                5. 34.9% agreed that gamification elements would influence
Since MOOCs can be joined freely and impose no commit-              their course participation in a positive way.
ment on the user, there is a high number of students who do
not visit the course after enrollment, stop visiting it after a     In conclusion, the overall perception of the usability of the
while, or leave it completely. The reported dropout rate on         openHPI platform is at a high level, but the discussions
Coursera is 91% to 93% [10] and on openHPI 8 it is between          are not as helpful as intended. The didactical concept and
77 and 82% [17, 16]. So the number of registrations should          expectation and the user perception diverge. This gap can
be seen as an indicator of interest rather than the ambition        be closed using the experimentation framework and should
to finish the course. Halawa et al. [6] claim that not only         be addressed when optimizing the learning outcome.
complete dropout is a problem, but also periods of absence
8
    openHPI: https://open.hpi.de                                    5.    CONCLUDED TESTS

                                                              308
Based on the survey results three tests have been selected to The course activity metric (subsection 3.7) and the pinboard
evaluate the introduced A/B testing framework based on the activity metrics (subsection 3.3) were used to validate the
expected impact. The selection was based on the predicted impact of the alternative group.
user acceptance and the expected impact in combination with
the amount of work needed to implement these new features. 5.1.1 Alternatives
As the learners in MOOCs are connected via the forum, it is After enrollment the groups saw:
also important to respect this fact while choosing possible
test candidates, as this could lead to confusion or jealousy.
While all of these tests required to implement prototypes of Group 0: a confirmation that they are enrolled.
these features none of these functionalities were so essential
Group 1: a welcome message and a tour guiding them
or prominent that not having it may lead to disappointed
through the course area.
users. Some of the tests featured additional explanatory
text, explaining that the user is part of a test group. One
possible test candidate featuring gamification elements which 5.1.2 Setup
are really prominent on the platform was not chosen for this The test ran for a week starting on May 20, 2015 17:20
reason. As we run several platforms, a possible test strategy targeting users who enrolled for their first course on openHPI.
is to roll it out on one instance of the platform only and then It started after enrollment and ended immediately for the
”normalize” the metrics. All tests could be easily stopped or control group and after skipping or finishing the tour for the
deactivated by the user, disabling the tested feature for that treatment group.
user.
The control group comprised 172 participants, the alternative
119 (plus 16 that did not finish the tour).
5.1 Onboarding
All metrics were evaluated after one week.
5.1.3 Results
The results (Table 1, Table 2) show that an onboarding tour
increases the number of visits of learning items (34.5 % for
videos, 27.9 % for all items). However, the difference is not
significant, pThe emails are sent by the Notification Service, which is
responsible of receiving updates sent in other services and
forwarding them as a notification on the web or as an email.
The regular email for this test is initiated using a daily routine
at 2:00 UTC. It queries all enrollments of users that have not
visited their course for the last four days and have visited
less than 90% of the course content. The latter restriction
prevents users that nearly finished a course, but are not
interested in some parts of it to repeatedly receive reminders.
Depending on the group, the popular questions of the course’s
discussions of the four last days and unwatched videos are
queried for each enrollment.
5.2.1 Alternatives
The test is designed in a multivariate manner and comprises
three alternative groups. The groups are sent:
Group 0: no email
Group 1: an email reminding them to visit the course again
Group 2: an email reminding them to visit the course again
including an extract of the latest activity in discussions
Group 3: an email reminding them to visit the course again
including videos they did not see yet
Group 4: an email reminding them to visit the course again
including an extract of the latest activity in discussions
and videos they did not see yet
Figure 4: Sample reminder email for group 4
An exemplary email as a user part of group 4 would receive
is show in Figure 4. As with all notifications, the users can
opt-out of these emails. Table 4: Reminder Emails: Results for course activ-
ity
5.2.2 Setup Name Participants Mean Change p
The test ran for two weeks starting on July 6, 2015, 22:00 Control 1830 1.12
UTC, targeting all users enrolled in Web Technologies on Text 1831 1.34 19.92% 0.109
openHPI. A trial started when the first reminder email was Questions 1833 1.2 6.96% 0.337
sent and ended upon successful delivery. Videos 1834 1.53 37.36% 0.02
Q. and V. 1868 1.6 43.32% 0.009
The control group comprised 1830 participants, the alter- Total 9196 1.36
natives 1831, 1833, 1834, and 1868 summing up to 9196
participants in total.
Table 5: Reminder Emails: Results for visit count
All metrics were evaluated after one week. Only the course
point metric was evaluated after the certificates were pub- Name Participants Mean Change p
lished. Control 1830 1.1
Text 1831 1.33 20.63% 0.102
5.2.3 Results Questions 1833 1.19 7.45% 0.327
The results show that sending a reminder email increases Videos 1834 1.53 38.26% 0.018
the overall course activity (Table 4). However, only emails Q. and V. 1868 1.58 43.46% 0.009
containing videos show a statistically significant change of Total 9196 1.35
37.4% with a p-value of 0.02 < 0.05 for videos and 43.3%
(p-value 0.009 < 0.05) for videos and questions.
The results for pinboard activity (Table 7) are surprising, as
The same effect can be seen for the visit count (Table 5) with they reveal a decrease of discussions visits for all alternatives.
an increase of 38.3% and a p-value of 0.018 < 0.05 for videos, The decrease is less for the alternatives showing questions,
and 43.5% (p-value 0.009 < 0.05) for videos and questions but the results still indicate that reminder emails have no
and even stronger for the video visit count (Table 6) with a impact, if not a negative impact (that was not tested), on the
gain of 60.4% and a p-value of 0.004 < 0.05 for videos, and number of visits in the discussions. A possible explanation
73.1% (p-value 0.002 < 0.05) for videos and questions. could be that users that saw the recommended content of
310to receive these emails. Reminder emails are designed for
Table 6: Reminder Emails: Results for video visit those cases. A background job queries the pinboard service
count for unseen questions for that user and unanswered questions
Name Participants Mean Change p in the course.
Control 1830 0.47
Text 1831 0.6 29.0% 0.07 5.3.1 Alternatives
Questions 1833 0.59 26.87% 0.11 The groups are sent:
Videos 1834 0.75 60.38% 0.004
Q. and V. 1868 0.81 73.08% 0.002
Total 9196 0.64 Group 0: no email
Group 1: an email including five unseen questions with the
most activity and five unanswered questions with the
the pinboard could realise that there is no content that demand to answer them
would motivate them to visit the pinboard, while otherwise
they may just have browser there and then explored some
interesting threads. An exemplary email is show in Figure 5. Similar to the
reminder emails, users can disable these emails.
Table 7: Reminder Emails: Results for pinboard
watch count
Name Participants Mean Change p
Control 1830 0.12
Text 1831 0.07 -46.22% 0.915
Questions 1833 0.08 -38.22% 0.846
Videos 1834 0.06 -51.23% 0.932
Q. and V. 1868 0.1 -14.33% 0.635
Total 9196 0.09
Another outcome we did not expect was that the emails have
no positive effect on the total points achieved in the course.
As Table 8 shows, the means of all alternatives are inferior
to that of the control group.
Table 8: Reminder Emails: Results for course points
Name Participants Mean Change p
Control 1830 9.57
Text 1831 8.43 -11.88% 0.899
Questions 1833 7.87 -17.71% 0.977
Videos 1834 8.71 -8.97% 0.83
Q. and V. 1868 9.51 -0.63% 0.526
Total 9196 8.82
5.3 Pinboard Digest Mails
In the pinboard students can discuss course contents and ask
questions about advanced topics to help them to understand
the taught content better. As outlined in subsection 4.1
social interaction also prevents dropouts. However, in the
user experience survey on openHPI (see subsection 4.2),
the statement “Did the discussions support your learning
process?” received only a rating of 2.93 on a scale from 1 to 5.
This test evaluated if a daily pinboard overview email fuels
the participation in the discussions of a course. Such an email
contains questions the user has not yet seen, but received
much attention from others. It also includes unanswered
questions to reduce the time until a question is answered.
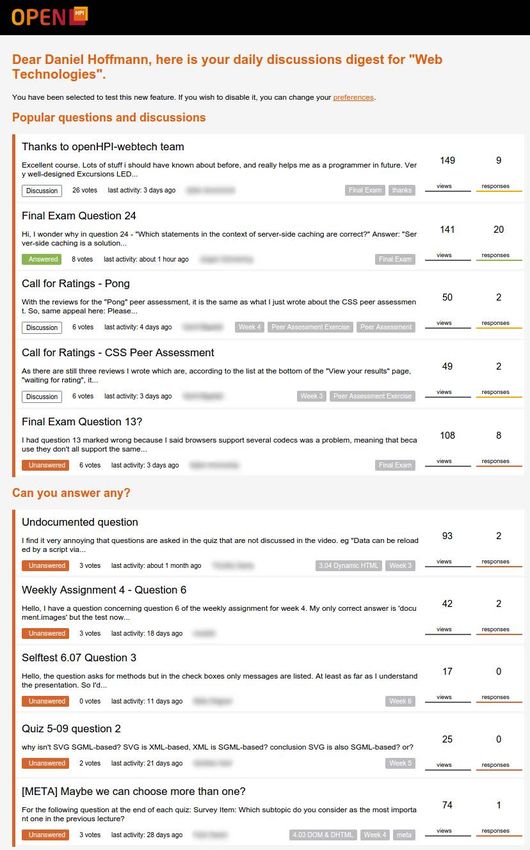
Figure 5: Sample pinboard digest email for group 1
These emails are also sent each day at 4:00 UTC. For each
enrollment in an active course with an open forum it is 5.3.2 Setup
determined if the user visited the course in the last two The test ran for one week starting on July 15, 2015, 00:00
weeks. This avoids disturbing users that are dropped out UTC, targeting all users enrolled in Driving Business Results
311with Big Data on openSAP . A trial started when the first possible explanation could be that it was performed in the
pinboard digest email was sent and ended upon successful last two weeks of the course running for six weeks. Users
delivery. The control group comprised 2019 participants, that dropped out before might either be not determined
the alternative 2035 summing up to 4054 participants. All to complete the course in the first place or were deterred
metrics were evaluated after one week. by the workload needed to catch up. A test running over
the full length of a course could show if the results can be
5.3.3 Results reproduced.
The results show that sending daily discussions overviews
increases the pinboard activity of the affected users (Table 9) The test concerning pinboard digest emails verified our as-
by 64% which is a statistically significant improvement (p- sumption that it increases the participation in the discussions.
value 0.021 < 0.05). They also raise the posting activity in The alternative succeeded by the large margin of 140% more
the discussions (Table 10) by 140%, which is statistically questions, answers and comments.
significant as well (p-value 0.03 < 0.05).
Some of the results confirm our hypotheses and some con-
tradict our intuition. Hence, the tool justifies its place in
Table 9: Pinboard Digest Mail: Results for pinboard the openHPI ecosystem. It allows to decide which features
activity should be included backed with data. Disadvantageous ones
are not published permanently and only those with a positive
Name Participants Mean Change p
impact on the learning behavior or experience are included.
Control 2019 0.06
Digest 2035 0.1 63.98% 0.021 Based on this results next steps could be taken to improve
Total 4054 0.08 this framework. This includes introducing pre- and post
tests, as well as other actions to allow better interpretation
as suggested in [14].
Table 10: Pinboard Digest Mail: Results for pin-
board posting activity 6.1 New feature release cycle
Name Participants Mean Change p Thanks to the presented framework feature decisions for
Control 2019 0.02 openHPI and openSAP can be based on empirical data. The
Digest 2035 0.04 139.77% 0.03 workflow of releasing new features now looks as follows. After
Total 4054 0.03 the implementation of the feature it is reviewed internally
in the development team. Depending on the importance of
the feature, it is also reviewed by the customer / product
6. CONCLUSION AND FUTURE WORK owner. If the reviews are positive the feature is deployed,
The introduction of an A/B Testing Framework gives plat- but deactivated using feature flippers. Metrics are defined to
form developers, architects and providers the needed toolset assess the feature. Then one or more user tests are performed.
to be aware of the impact of new instruments and features After a predefined time span the test results are reviewed.
before introducing them to all users. This lays the foundation If there is an improvement in the metrics and there is no
for constant improvement of the user experience and learning negative impact (for example comunicative pollution) the
outcome on openHPI and MOOC platforms in general. The feature is rolled out for all users, since it evidentially improves
possibility to have a live view on the current data situation the learning behavior of the participants. If no change is
was very helpful and empowered agile decisions like extend- detected, it is rolled out but deactivated by default. Users
ing tests or run them on other instances of the portal as well. that want to use the feature can activate it. If the test reveals
While the evaluation of the new framework was successful, that the new feature performs worse than the control, it is
the majority of the test runs have been successful. not rolled out.
It is not uncommon for A/B-tests to fail. In fact, reported This new workflow allows for fast evaluation of features.
success rates hover around 10 and 12.5% [4, 2], the others Rather than deciding by intuition which features should be
show little change between the groups. But in the case of added, they are tested beforehand if they are beneficial for
the onboarding test the margin was rather large but not the users. Only those that perform better are activated for
significant. This test should be repeated over a longer time all users.
span to examine if the results are similar and whether a
larger sample size causes statistical significance.
6.2 Evaluation of used metrics and introduc-
The reminder email test confirmed our hypothesis that re- tion of negative metrics
minding students after a certain period of absence increases The used metrics could be evaluated based on the mea-
their course activity. Showing videos in the email was the suremnt of this metrics in courses. For the tests where the
decisive factor for statistical significance, which indicates activity was increased but the course results stayed the same,
that users are more content driven, not social driven. We additional metrics should be introduced to assure that there
also received positive feedback from users who appreciated is no negative impact of the introduced test. Therefore sev-
the feature. However, the test also yielded surprising results. eral metrics that are based on ”negative” events should be
The email decreased the pinboard visits regardless of the introduced. As during the time of evaluation of the new
fact whether it included questions or not. It also did not framework such events were not recorded by the learning
affect the course results of the learners in a positive way. A analytics service, these metrics are not yet implemented. One
312possible metric is the amount of course or platform unen- conference on Knowledge discovery and data mining -
rollments. Another possible metric is the amount of users KDD ’07, volume 2007, page 959, New York, New York,
unsubscribing from notification mails. This metric could help USA, 2007. ACM Press.
to indicate users being annoyed by too many mails received [10] D. Koller. MOOCs on the Move: How Coursera Is
from the platform. Disrupting the Traditional Classroom, 2012.
[11] J. H. Kolodziej. The lean team., volume 37. 2011.
6.2.1 Marketing or content driven style A/B tests [12] J. Lewis and M. Fowler. Microservices, 2014.
All tests run in the context of the evaluation of this new [13] G. Linden. Geeking with Greg: Early Amazon:
framework are based on new functionalities. Still, it could be Shopping cart recommendations, 2006.
also used to run A/B test evaluating smaller, more content- [14] M. W. Lipsey, K. Puzio, C. Yun, M. A. Hebert,
driven or UI driven changes within the platform. This work K. Steinka-Fry, M. W. Cole, M. Roberts, K. S.
could be started on the course detail pages. These pages Anthony, and M. D. Busick. Translating the statistical
can be compared to classical landing pages, therefore it can representation of the effects of education interventions
be predicted that they have a huge unused potential. An into more readily interpretable forms. National Center
enrollment rate per page visitor rate could be used as a for Special Education Research, 2012.
metric. However, given the simple requirements of tests [15] C. Meinel, M. Totschnig, and C. Willems. openHPI:
like this could also be run by using Optimizely or other Evolution of a MOOC Platform from LMS to SOA.
externally provided testing tools. As Willems states in [27] Proceedings of the 5th International Conference on
other MOOC platforms like edX allows optional content Computer Supported Education, pages 593–598, 2013.
modules for a given sub set of learners. Also Khan Academy [16] C. Meinel, C. Willems, J. Renz, and T. Staubitz.
allows A/B testing on certain exercise types. All of these AB Reflections on Enrollment Numbers and Success Rates
tests may be supported by the platform, but do not include at the openHPI MOOC Platform. In Proceedings of the
functional additions. These types of tests involve additional European MOOC Stakeholder Summit 2014, pages
creation of content, therefore they are hard to realize given 101–106, Lausanne, Switzerland, 2014.
the bottleneck of content creation, however the presented
[17] OpenHPI. Blick nach vorn – und zurück!, 2015.
A/B testing framework could be used for tests like this.
[18] M. Q. Patton, P. H. Rossi, H. E. Freeman, and S. R.
Wright. Evaluation: A Systematic Approach., 1981.
6.2.2 Community contributed test cased [19] J. Renz, T. S. Suarez, Gerardo Navarro, and C. Meinel.
Another idea of gathering test cases is to collect them from
Enabling schema agnostic learning analytics in a
users and the research community. Therefore the authors are
service-oriented mooc platform. L@S ’16.
open for suggestions of tests. It is planned to at least run
[20] C. Richardson. Microservices Architecture pattern,
three community contributed tests within the next month.
2014.
[21] C. Rohrer. When to Use Which User Experience
7. REFERENCES Research Methods, 2008.
[1] Advanced Distributed Learning (ADL). Experience
[22] Sap Se. About openSAP, 2014.
API v1.0.1, 2014.
[23] G. Siemens and R. S. J. D. Baker. Learning analytics
[2] P. Chopra. Appsumo reveals its A/B testing secret:
and educational data mining. In Proceedings of the 2nd
only 1 out of 8 tests produce results - VWO Blog, 2011.
International Conference on Learning Analytics and
[3] J. Cohen. Statistical Power Analysis for the Behaviorial
Knowledge - LAK ’12, page 252, New York, New York,
Sciences. Lawrence Erlbaum Associates, Inc, 1977.
USA, 2012. ACM Press.
[4] M. A. Farakh. Most of your AB-tests will fail, 2013.
[24] G. N. Suarez. Enabling Learning Analytics in a
[5] F. Grunewald, E. Mazandarani, C. Meinel, R. Teusner, Service-Oriented MOOC Platform. Master’s thesis,
M. Totschnig, and C. Willems. openHPI - A case-study Hasso Plattner Institute, 2015.
on the emergence of two learning communities. In 2013
[25] S. Thomke. Experimentation Matters. 2003.
IEEE Global Engineering Education Conference
[26] K. Veeramachaneni and U.-m. O’Reilly. Developing
(EDUCON), pages 1323–1331. IEEE, Mar. 2013.
data standards and technology enablers for MOOC
[6] S. Halawa, D. Greene, and J. Mitchell. Dropout data science. MOOC Research Initiative Conference,
Prediction in MOOCs using Learner Activity Features. (October 2013):1–8, 2013.
eLearning Papers, 37(March):1–10, 2014.
[27] J. J. Williams, K. Ostrow, X. Xiong, E. Glassman,
[7] S. Halawa and U.-m. O. Reilly. MOOCdb : Developing
J. Kim, S. G. Maldonado, N. Li, J. Reich, and
Standards and Systems to support MOOC Data N. Heffernan. Using and designing platforms for in vivo
Science Massachusetts Institute of Technology. educational experiments. In Proceedings of the Second
Technical report, 2014. (2015) ACM Conference on Learning @ Scale, L@S ’15,
[8] R. Kohavi, A. Deng, R. Longbotham, and Y. Xu. Seven pages 409–412, New York, NY, USA, 2015. ACM.
rules of thumb for web site experimenters. In
[28] R. S. Witte and J. Witte, S. Statistics. John Wiley &
Proceedings of the 20th ACM SIGKDD International
Sons, 9 edition, 2009.
Conference on Knowledge Discovery and Data Mining,
[29] D. Yang, T. Sinha, D. Adamson, and C. Rose. “Turn on,
KDD ’14, pages 1857–1866, New York, NY, USA, 2014.
Tune in, Drop out”: Anticipating student dropouts in
ACM.
Massive Open Online Courses. Proceedings of the NIPS
[9] R. Kohavi, R. M. Henne, and D. Sommerfield.
Workshop on Data Driven Education, pages 1–8, 2013.
Practical guide to controlled experiments on the web.
In Proceedings of the 13th ACM SIGKDD international
313You can also read


