Using high-density DNA methylation arrays to profile copy number alterations
←
→
Page content transcription
If your browser does not render page correctly, please read the page content below
Feber et al. Genome Biology 2014, 15:R30
http://genomebiology.com/2014/15/2/R30

 METHOD                                                                                                                                         Open Access

Using high-density DNA methylation arrays to
profile copy number alterations
Andrew Feber1*, Paul Guilhamon1, Matthias Lechner1, Tim Fenton1, Gareth A Wilson1, Christina Thirlwell1,
Tiffany J Morris1, Adrienne M Flanagan1,2, Andrew E Teschendorff1, John D Kelly1,3† and Stephan Beck1†

  Abstract
  The integration of genomic and epigenomic data is an increasingly popular approach for studying the complex
  mechanisms driving cancer development. We have developed a method for evaluating both methylation and copy
  number from high-density DNA methylation arrays. Comparing copy number data from Infinium HumanMethylation450
  BeadChips and SNP arrays, we demonstrate that Infinium arrays detect copy number alterations with the sensitivity of
  SNP platforms. These results show that high-density methylation arrays provide a robust and economic platform for
  detecting copy number and methylation changes in a single experiment. Our method is available in the ChAMP
  Bioconductor package: http://www.bioconductor.org/packages/2.13/bioc/html/ChAMP.html.

Background                                                                            for the detection of C/T alterations based on the conver-
Copy number alterations (CNAs) have been implicated                                   sion of unmethylated cytosine with bisulfite. The relative
in the development and progression of many human                                      ratio of methylated (C) to unmethylated (T) residues is
malignancies, including prostate, bladder and breast can-                             then used to define the methylation state of a particular
cer [1-4]. Since first described in the late 1990s, many                              locus [16].
platforms have been developed for assessing alterations                                 The integration of genomic and epigenomic data from
in genomic copy number at an ever increasing resolution                               the same sample is becoming increasingly popular as we
[5-9]. The latest version of copy number variation arrays                             try to garner a greater understanding of the complex
can interrogate over one million loci, and have the abil-                             mechanisms driving the development and progression of
ity to detect genomic alterations ranging from approxi-                               cancers. Although at present arrays still prove the most
mately 4 kb to over 2 Mb [10-13]; they are, however,                                  cost-effective method of assessing both copy number and
limited in the size of small alterations detectable, due to                           DNA methylation state, this interest in integrating multiple
the distance between loci interrogated (Table 1). As a re-                            data sets means a significant increase in costs associated
sult, many small/micro-deletions encompassing single                                  with these projects. Huge international efforts are currently
genes may not be detectable [9].                                                      underway through the International Cancer Genome Con-
   In parallel, arrays designed to interrogate epigenetic al-                         sortium (ICGC) and the Cancer Genome Atlas (TCGA)
terations, particularly DNA CpG methylation, have been                                projects to produce genomic and epigenomic data on a
developed. These arrays were initially designed based on                              huge number of human cancers. At present these data are
immunoprecipitation (MeDIP) or enzymatic digestion                                    generated on separate array platforms, with over 6,200
followed by hybridization to a bacterial artificial chromo-                           SNP arrays and 6,300 methylation arrays used to date to
some or oligonucleotide CpG island array [14,15]. Subse-                              generate genomic and epigenomic profiles from the same
quently, there has been a move towards arrays designed                                sample. This, therefore, not only doubles the cost but also
on the premise of SNP detection arrays, and applied to                                the amount of specimen used. The latter is particularly im-
bisulfite converted DNA [16-18]. Probes are designed                                  portant when considering the potential effects of tumor
                                                                                      heterogeneity on disease development, where subtle areas
* Correspondence: a.feber@ucl.ac.uk                                                   of a tumor are genetically and epigenetically different,
†
 Equal contributors                                                                   which may ultimately confer a different phenotypic trait,
1
 UCL Cancer Institute, University College London, 72 Huntley Street, London
WC1E 6BT, UK                                                                          such as differing metastatic potential [19].
Full list of author information is available at the end of the article

                                        © 2014 Feber et al.; licensee BioMed Central Ltd. This is an Open Access article distributed under the terms of the Creative
                                        Commons Attribution License (http://creativecommons.org/licenses/by/2.0), which permits unrestricted use, distribution, and
                                        reproduction in any medium, provided the original work is properly cited.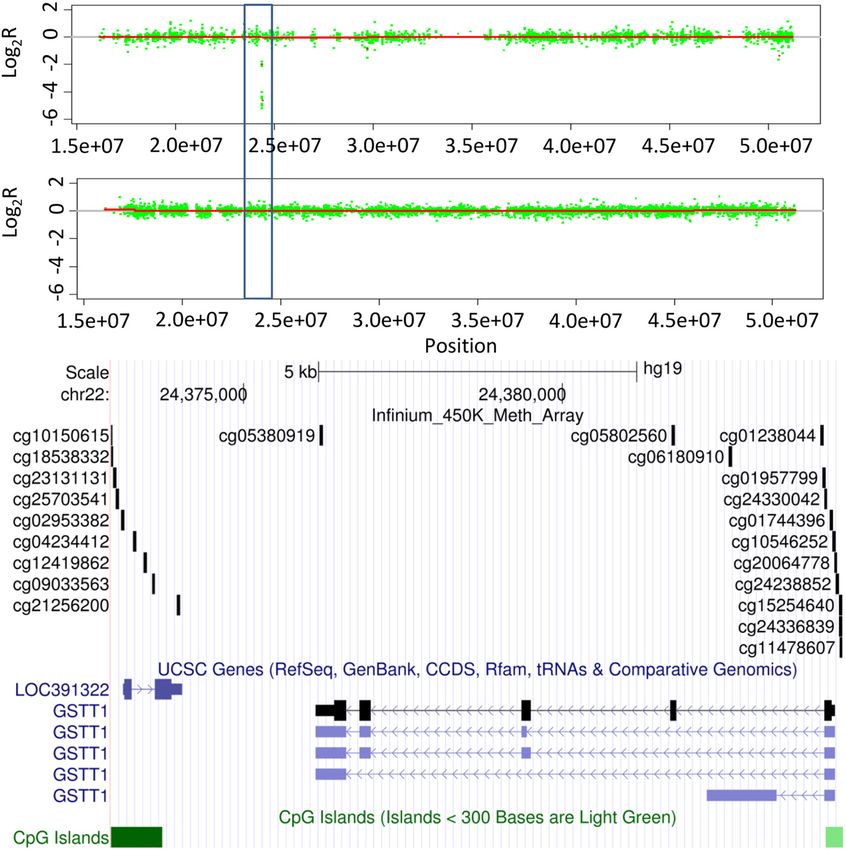
Feber et al. Genome Biology 2014, 15:R30                                                                                                       Page 2 of 13
http://genomebiology.com/2014/15/2/R30

Table 1 Genomic probe distribution
                                                Affymetrix SNP 6.0                  Illumina CytoSNP                  Illumina 450 K methylation array
Number of probes                                       945,806                            296,715                                    485,577
Median intermarker distance (kb)                         2.3                                6.1                                       0.35
Mean intermarker distance (kb)                           3.0                                10.8                                       5.8
Number of probes, mean and median intermarker distance interrogating copy number alterations from Affymetrix SNP 6.0, Illumina CytoSNP and Infinium
HumanMethylation450 BeadChip.

   We therefore sought to assess if the Infinium Human-                        and amplification (P < 2.2e-16), where a significant
Methylation450 BeadChips (the methylation array of choice                      negative correlation is observed with both data sets.
for the ICGC and TCGA) could be used to define regions                           An association with beta value and homozygous loss
of CNA as well as sites of aberrant CpG methylation. It has                    was as expected as low/no signal does not allow accurate
already been shown, for low density methylation arrays and                     assessment of methylation; in fact, most probes in these
high resolution whole genome bisulfite sequencing, that                        regions fail to pass the Illumina signal quality detection
changes in genomic content do not impact on the ability of                     P-value (defined by the comparison of signal from the
these arrays to accurately define the methylation state for                    target compared to that of negative controls (Illumina
individual loci and that these technologies also have poten-                   user manual)), and are removed in standard methylation
tial utility in detecting CNAs [20-22]. As the Infinium                        analyses. Unexpectedly, however, a significant negative
methylation arrays are, in essence, SNP arrays, providing                      correlation was observed between regions of SNP array
high density coverage of the genome, the question is do                        amplification and reduced beta values in all data sets.
they have the sensitivity and specificity to detect CNAs with                  Unlike in regions of deletion, over 97% of probes in
the same accuracy as existing technologies. This will not                      regions of amplification pass the detection P-value. On
only allow analysis and ultimately the integration of both                     closer inspection, this negative correlation appears to
epigenetic and copy number from exactly the same DNA                           be driven by the Infinium probe distribution. A higher
specimen, potentially important when considering the ef-                       proportion of probes in regions of focal amplification
fects of tumor heterogeneity on disease development and                        are located in CpG islands, which are predominately
progression [19,23], but will also significantly reduce the                    unmethylated, when compared with regions of normal
cost of integrated epigenomic cancer studies looking to in-                    ploidy [12,13,24]. Separating the Infinium probes within
corporate both data types.                                                     regions of amplification into CpG island-associated ver-
                                                                               sus non-CpG island-associated confirmed this (Figure S1
                                                                               in Additional file 1), with CpG island-associated probes
Results and discussion                                                         having a mean beta of 0.28 compared with 0.62 for non-
Influence of copy number alteration on methylation state                       CpG island-associated probes (similar beta values are
Prior to evaluating whether the Infinium array could detect                    observed if regions of no change and gain are partitioned
CNAs, we first sought to assess whether alterations in gen-                    in a similar fashion). The inherent complex dynamics
omic content influenced the methylation state inferred by                      between CN and methylation means it is difficult to dis-
the Infinium HumanMethylation450 BeadChips. Previous                           entangle biology from systematic biases.
analysis of similar low density Infinium type arrays
(GoldenGate) have shown that changes in DNA methyla-                           Array artifact removal
tion are unaffected by copy number (CN) state [20].                            Furthermore, as with other array-based platforms, tech-
Figure 1 shows the average beta value (methylation score)                      nical artifacts, such as batch effects and genomic wave,
for all potential sites on the Infinium array as a function                    may impinge on the accurate profiling of CNA form the
of CN determined from Affymetrix SNP6.0 or Illumina                            Infinium arrays. A ‘genomic-wave’ artifact, a probe effect
CytoSNP arrays from 11 chondrosarcoma and 74 glio-                             that correlates with surrounding genomic GC content
blastoma multiforme (GBM) tumors. It also shows the                            and is commonly observed in other comparative gen-
average beta value for all potential sites on the Infinium                     omic hybridization and SNP array platforms, and is also
array as a function of CN determined from an Affymetrix                        manifest on the Infinium arrays [25,26]. In order to help
SNP6.0 array from 144 bladder cancer and 178 prostate                          negate any effects of local CG content in calling CNAs,
cancer samples, respectively.                                                  we performed a loess correction prior to CNA analysis,
  These data show that CN has little impact on methy-                          which estimates and removes the wave effects [25].
lation (Figure 1) in either series at regions of heterozy-                       In a similar fashion, batch effects have been shown to
gous loss or single copy gains when compared with                              have a substantial effect on high throughput array-based
regions of normal CN. However, there does appear to                            platforms, and are particularly apparent with the Infinium
be an association when assessing homozygous deletion                           arrays, particularly when considering scale projects, such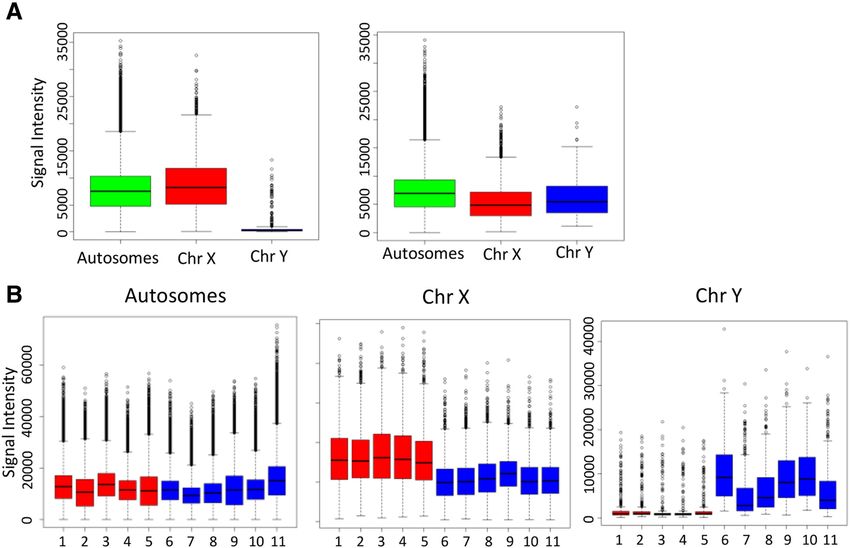
Feber et al. Genome Biology 2014, 15:R30                                                                                         Page 3 of 13
http://genomebiology.com/2014/15/2/R30

 Figure 1 Association of methylation state with copy number. Box plots showing the influence of changing genomic content on methylation
 state (average beta value) inferred from SNP (CytoSNP and Affymetrix SNP6.0) and Infinium arrays, respectively, for (A) chondrosarcoma, (B)
 glioblastoma multiforme, (C) bladder cancer and (D) prostate cancer.

as the TCGA [27,28]. In order to help reduce variance at-               Copy number alteration profiling using Infinium
tributed to batch as opposed to biological influence, we                methylation arrays
also incorporated batch effect removal with the ComBat                  Our initial motivation was to assess if the Infinium
function [29]. Batch effect removal significantly improved              HumanMethylation450 BeadChips could provide infor-
the correlation between replicate samples across differing              mation on genomic rearrangements with a level of ac-
batches (Figure S2 in Additional file 1): uncorrected R2 =              curacy comparable to current gold standard SNP arrays.
0.77 compared to batch-corrected R2 = 0.97. The correl-                 As the Infinium arrays are, in essence, SNP arrays, with
ation of replicate samples within a single array was R = 0.99,          probes designed to interrogate the relative ratio of a
suggesting array position does not unduly affect signal in-             methylated to unmethylated (C to T) template in bisul-
tensity. All subsequent analysis where carried out on wave-             fite converted DNA, and as the methylation state (beta
and batch-corrected data (Figure S2 in Additional file 1).              value) is defined by a relative ratio of methylated probe
   It is well documented that the different Infinium assay              signal intensity to the total signal intensity of both meth-
designs (type I and type II) show considerable probe ef-                ylated and unmethylated probes, it is logical to expect
fects [16,30]. For example, when assessing methylation,                 that these arrays may also allow assessment of CN. If
the beta values derived from Infinium II probes were less               total (unmethylated plus methylated) probe intensity is
accurate and reproducible than those obtained from Infi-                representative of CN, then the simplest of CN changes,
nium I probes [30]; it has therefore been suggested (at                 that is, differences in the sex chromosomes between
least for methylation analysis) that the differing probe                males and females, should be clearly detectable. Figure 2
types be treated independently. We initially took this ap-              shows the total signal intensities of the autosomal and
proach when utilizing these arrays to assess CN, as the                 sex chromosomes for normal reference DNA and 11
intensities of the two probe types also show considerable               chondrosarcoma patients. These data clearly show a sig-
differences [16,30].                                                    nificant (P < 2.2e-16) difference between the autosomal
Feber et al. Genome Biology 2014, 15:R30                                                                                        Page 4 of 13
http://genomebiology.com/2014/15/2/R30

 Figure 2 Changes in Infinium probe intensities between sex chromosomes. (A) Box plots of Infinium total signal intensities for autosomes
 and sex chromosomes for male and female patients (autosome (green) and sex chromosomes (chromosome X (red), chromosome Y (blue)).
 (B) Box plots of Infinium intensities for autosomes and sex chromosomes for 11 chondrosarcoma samples (females, red; males, blue).

chromosomes and sex chromosomes and that the Infi-                      account for this lack of correlation in regions of hetero-
nium methylation arrays can potentially detect single                   zygous/homozygous loss.
copy alterations.                                                         Finally, we sought to define CN profiles from Infinium
   We subsequently assessed the relationship between                    array data. CNAs were identified using circular binary
Infinium probe intensity and differing CNA states de-                   segmentation in the Bioconductor package DNAcopy
fined by SNP array from an in-house series of matched                   [31]. We initially analyzed both probe types independ-
Infinium and CytoSNP arrays along with 386 samples                      ently and evaluated the concordance of CNAs identified.
from the TCGA project, representing three tumor types,                  Using the default parameters, type II probes appear to
GBM, prostate cancer and bladder cancer. As expected,                   show a higher degree of ‘noise’ than the type I probes.
regression coefficients confirmed that the mean Infinium                Despite this, the concordance of CNAs called by both
signal intensity increases monotonically with CNA state                 probe types (when considering large regions) is high
(Figure 3), with a significant difference (P
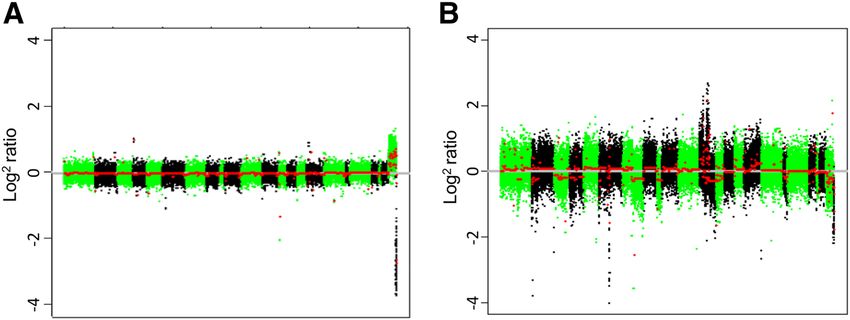
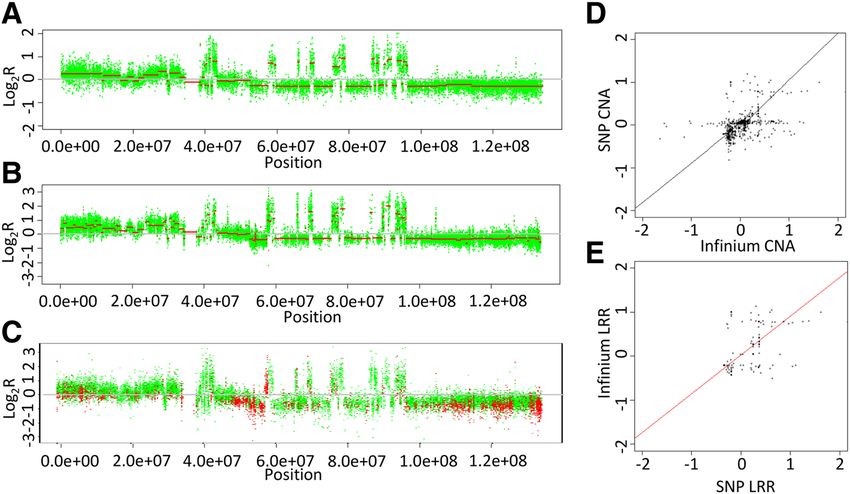
Feber et al. Genome Biology 2014, 15:R30                                                                                             Page 5 of 13
http://genomebiology.com/2014/15/2/R30

 Figure 3 Comparison of Infinium total probe intensity and changing copy number. Box plots showing the association of total probe
 signal intensity from the Infinium arrays and copy number state inferred from SNP arrays for (A) chondrosarcoma, (B) glioblastoma multiforme,
 (C) bladder cancer and (D) prostate cancer.

chromosomes is observed (P ≤ 0.0001), along with an ex-                    Correlation between Infinium and SNP array-defined
ample of a highly aneuploid malignant genome. These                        CNAs
data indicate that the Infinium HumanMethylation450                        We next sought to assess whether the Infinium arrays
BeadChips, when combined with circular binary segmen-                      could give a robust definition of CNAs compared to the
tation, can detect both single copy and potentially high                   gold standard SNP arrays for aneuploid malignant ge-
level CNAs.                                                                nomes. CNAs were determined from both SNP arrays as

 Figure 4 Normal and malignant copy number profiles. (A) CN profile for normal female versus male reference. (B) CN profile for a highly
 aneuploid cancer genome (versus male reference) derived from the Infinium arrays. Individual chromosomes are shown in green/black and
 segmented CN is shown in red.
Feber et al. Genome Biology 2014, 15:R30                                                                                          Page 6 of 13
http://genomebiology.com/2014/15/2/R30

above, using the Bioconductor package DNAcopy for                        initially assessed the overlap between all regions of focal
GBM samples. For bladder cancer and prostate cancer                      genomic alteration (10 Mb) for both gains and losses.              age at differing alteration thresholds (that is, gain, loss,
This analysis showed that a total of over 94% of large                   amplification and deletion) across all 407 paired SNP Infi-
chromosomal gains and 97% of losses were identified by                   nium array comparisons (Figure 6). This confirmed that
both Infinium and the SNP array, suggesting that the                     the Infinium arrays show a good level of accuracy in de-
Infinium arrays show sufficient sensitivity to detect large              tecting alterations at all levels of alteration across multiple
scale, predominately single copy alterations.                            studies (Table 2).

Copy number alteration detection sensitivity                             Copy number alteration resolution
Besides the detection of large chromosomal rearrange-                    As highlighted above, Infinium arrays define a significant
ments, we also sought to evaluate the ability of the Infinium            number of CNAs that are not present in the SNP array
arrays to detect focal alterations, including small (
Feber et al. Genome Biology 2014, 15:R30 Page 7 of 13
http://genomebiology.com/2014/15/2/R30
Quantitative PCR validation confirmed the heterozygous
deletion of this region in PTCH1 (Figure S4 in Additional
file 1). Similarly, Figure 4 shows the homozygous deletion
of a small region centered on GSTT1; homozygous dele-
tion of this gene has been associated with increased sus-
ceptibility to many different cancer types, including
prostate cancer, renal cancers and osteosarcoma [32-35].
The Infinium data indicate this deletion spans approxi-
mately 12 kb and contains GSTT1 and a small proportion
of the neighboring LOC391322 only (Figure 8). This re-
gion also contains a single probe from the Affymetrix
SNP6.0 array and would be undetectable by the Illumina
CytoSNP arrays (Figure 8). Quantitative PCR validated the
homozygous deletion of GSTT1 (Figure S4 in Additional
file 1). Although we have not mapped the full extent of
these deletions, these data highlight the potential utility of
these arrays to identify novel small alterations that are not
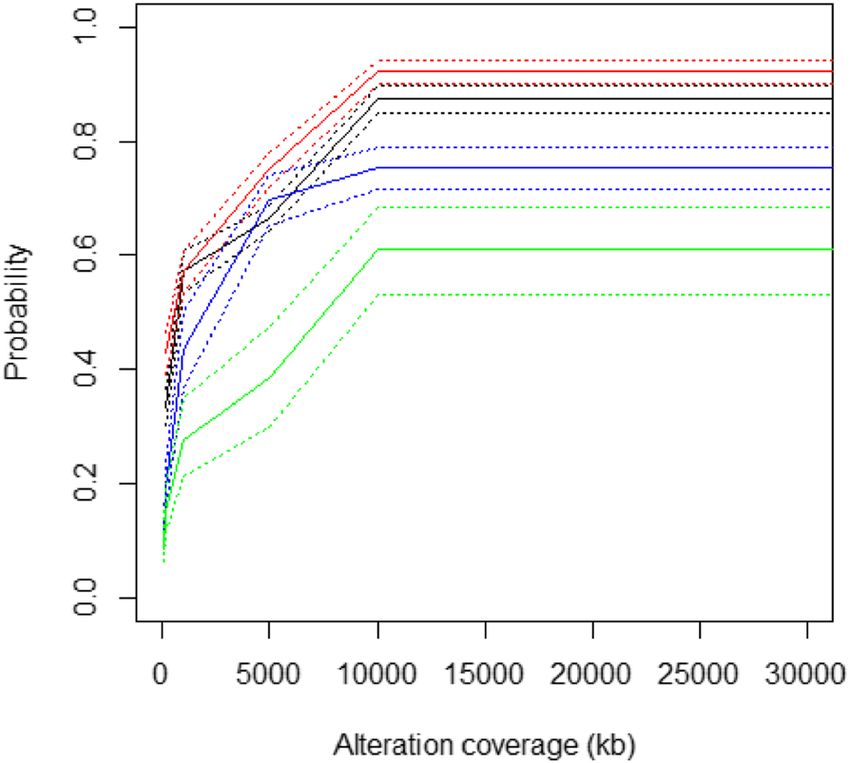
Figure 6 Coverage plots of candidate true positives to assess detectable with existing SNP array platforms.
the sensitivity and specificity of alterations defined by the We further validated CNAs identified by the Infinium
Infinium arrays. At each alteration threshold (deletion, blue; loss, arrays with the targeted exome-sequencing of key cancer
red; gain, black; amplification, green) we counted the alterations that
overlap between matched arrays. The number of overlapping
genes [36]. This analysis revealed greater than 90% con-
regions (candidate true positives). Dotted lines represent 95% cordance between alterations identified by Infinium CNA
confidence intervals. profiling and targeted exome sequencing (Figure S5 in
Additional file 1). Of overlapping loci, 45 alterations were
identified from Infinium CNA profiling with a false posi-
or whether they were artifacts. On close inspection, most tive rate of 8%, and a similar false negative rate (8.8%)
of these false positives (92%) appear to be regions devoid [36], further highlighting that the Infinium arrays provide
of sufficient probes to call a change on the SNP arrays. a reliable, robust and cost-effective method of identifying
For example, Figure 7 shows LOH (loss of hetrozygosity) CNAs in human cancers.
of the entire chromosome 9 by both SNP and Infinium ar-
rays, along with the focal, potential homozygous deletion Conclusion
of a further four regions, including the loci encompassing There is increasing interest in the integration of genomic
the tumor suppressor gene CDKN2A. Three of the four and epigenomic data from the same DNA specimen in
homozygous deletions are identified by both array types, order to provide greater insight into disease processes. It
apart from an approximately 10 kb region (Figure 7) not is particularly intriguing to integrate genomic CN and
detected by the CytoSNP array. This region (log2R = -2.7) DNA methylation data, which may allow the identifica-
contains 24 probes on the Infinium arrays and appears to tion of synergistic mechanisms for the inactivation of
span approximately 34 kb (first 3 exons) and 1.2 kb up- tumor suppressor genes or the activation of oncogenic
stream of PTCH1 only (9 probes in the remaining 44 kb pathways [3]. However, the integration and ultimately
of PTCH1 showed heterozygous loss only, log2R = -0.36, the interpretation of these integrated datasets are both
similar to the remainder of Chr9). However, this region is costly and challenging if carried out separately.
represented by only a single probe on the CytoSNP array Here we sought to evaluate whether the Infinium
(nearest neighbors 5′ = 7.34 kb and 3′ = 6.99 kb). HumanMethylation450 BeadChip could be utilized to
determine CNAs as well as epigenetic alterations. Ini-
Table 2 Infinium sensitivity and specificity tially, we sought to confirm that the methylation state
Sensitivity inferred by the Infinium HumanMethylation450 Bead-
Deletion Loss Gain Amplification Chip was not biased by altered CN state. We show there
Chondrosarcoma 0.83 0.91 0.89 0.69 is little bias when comparing normal (two copies) to het-
GBM 0.97 0.85 0.87 0.75 erozygous loss (one copy) or single copy gain (three cop-
Bladder cancer 0.62 0.81 0.79 0.67 ies). However, there does appear to be a correlation at
loci of complete genomic loss, potential homozygous de-
Prostate cancer 0.6 0.81 0.85 0.63
letion (more than one copy) and amplification (more
The sensitivity and specificity of CNAs identified between SNP array and
Infinium methylation arrays for four tumor types across a range of
than four copies). Association of methylation and CNA
alteration types. state with homozygous loss is unsurprising and has littleFeber et al. Genome Biology 2014, 15:R30 Page 8 of 13 http://genomebiology.com/2014/15/2/R30 Figure 7 Infinium unique PTCH1 deletion. CN profiles for chromosome 9 for a single chondrosarcoma sample generated from Infinium HumanMethylation450 BeadChip (upper panel) and CytoSNP arrays (middle panel). The Infinium array-specific deletion of PTCH1 is highlighted (blue box).The lower panel shows the genomic organization of the Infinium unique PTCH1 region of deletion and the distribution of probes on the Infinium methylation, CytoSNP and SNP 6.0 arrays. impact on methylation analysis per se as these loci are Our primary objective was to assess whether the Infi- generally removed from methylation analysis due to sig- nium HumanMethylation450 BeadChip could be used to nal intensities indistinguishable from background (low accurately assess CNAs to the same degree of reliability detection P-value). However, it may represent a con- and sensitivity as standard SNP array platforms, such as founding factor effect when comparing methylation in the Affymetrix 6.0 SNP or Illumina CytoSNP arrays. Spe- samples with and without CNA. For example, a tumor cifically, we compared Infinium CNA profiles from sam- suppressor deleted in a proportion of samples may be ples with matched SNP array data. Using the same hypermethylated in others, but in many Infinium methy- algorithm for all array types, we show that approximately lation array analysis pipelines this information will be 85% of all alterations were identified in both SNP and Infi- lost due to the removal of missing data. This highlights nium arrays (when regions contain sufficient overlapping the importance of integrated analysis using both CNA probes). Interestingly, we see a reduced concordance when and methylation data. The strong negative association assessing smaller alterations, with a high number of false between methylation state and regions of high level ampli- positive alterations identified by the Infinium arrays com- fication was less anticipated, and appears to be a result of pared to SNP platforms. The majority of these appear to the genomic distribution of probes as opposed to inherent be results of differences in array design and the gene- biases of the arrays. As most probes in regions of amplifi- centric design bias of the Infinium arrays. Unlike the cation fall within CpG islands, which are predominately standard SNP array design, with probes roughly evenly unmethylated, these therefore contribute to the apparent distributed throughout the genome, the Infinium arrays loss of methylation in regions of amplification. are very much gene-centric in their design, with 95% of
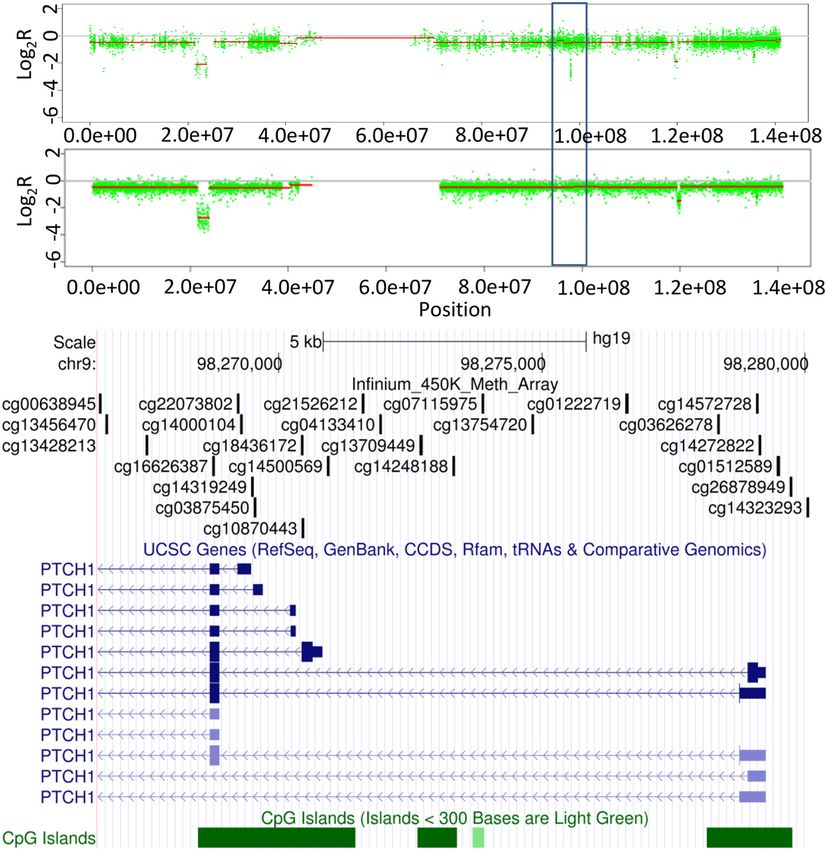
Feber et al. Genome Biology 2014, 15:R30                                                                                           Page 9 of 13
http://genomebiology.com/2014/15/2/R30

 Figure 8 Infinium unique GSTT1 deletion. CN profiles for a proportion of chromosome 22 for a single chondrosarcoma sample generated from
 Infinium HumanMethylation450 BeadChip (upper panel) and CytoSNP arrays (middle panel). The Infinium array specific deletion of GSTT1 is
 highlighted (blue box). The lower panel shows the genomic organization of the Infinium unique GSTT1 region of deletion and the distribution of
 probes on the Infinium methylation, CytoSNP and SNP 6.0 arrays.

probes within 2 kb of 95% of the known genes and, on                      biology of malignant processes where the challenge is to
average, >9 probes per gene. Therefore, although the Infi-                identify driver from passenger alterations [3]. For instance,
nium arrays may lack the resolution of SNP arrays to de-                  a change in genomic content (that is, single copy gain or
tect alterations in large intergenic regions or gene desert               loss) does not have to correlate with a linear change in
regions, they provide high resolution coverage of the ma-                 methylation; in fact, it is those genes that show an inverse
jority of coding loci. This allows for the identification of              correlation between CNA and methylation that may be
discreet alterations of individual genes, which would not                 most important. For example, tumor suppressor genes
be detected by standard SNP arrays. Similarly, with over                  that undergo a ‘double hit’ - that is, heterozygous loss and
94% of CpG islands represented, these arrays may also                     hypermethylation - or oncogenes in a region of gain that
allow the identification of small alterations within regula-              are hypomethylated compared with neighboring genes
tory regions, potentially revealing novel mechanisms of                   may represent those genes most likely to be differentially
gene disregulation. Therefore, the gene-centric/biased de-                expressed and consequently drivers of tumorigenic pro-
sign of the Infinium array has a greater potential to iden-               cesses. Hence, through utilizing the Infinium arrays for
tify driver CNAs involved in tumorigenic processes.                       both epigenetic and CN analysis, it may be possible to
   Furthermore, as the same loci can be interrogated for                  more accurately distinguish between genes that drive the
both methylation and CN in the same DNA sample, the                       selection of a malignant phenotype from those that are
analysis potentially allows easier integration of epigenetic              passengers within an amplified or deleted region.
and genomic data. The integration of methylation and CN                     Finally, it can be difficult to compare CNA data across
data can provide fascinating insights into the underlying                 different high-density array platforms, particularly given
Feber et al. Genome Biology 2014, 15:R30                                                                          Page 10 of 13
http://genomebiology.com/2014/15/2/R30

differing designs, and even the comparison of the same           CytoSNP
data with differing algorithms can lead to varying results       DNA (300 ng) from 11 chondrosarcoma specimens and
[37-39]. Even given these caveats, these data show the util-     one normal reference DNA sample were processed and
ity of using the Infinium HumanMethylation450 Bead-              hybridized to the HumanCytoSNP-12 BeadChip according
Chips to define CNAs in human cancers. We show that              to the manufacturer’s instructions. Subsequent data were
the Infinium Arrays are as robust and sensitive as current       processed and R values computed using the genotyping
high density SNP arrays for the detection of CNAs and            module of the GenomeStudio software (version 1.9.0; Illu-
appear highly applicable for providing estimates of CN as        mina). Further analysis and identification of CNAs was
well as a measure of methylation state. Furthermore, we          carried out in R (version 2.15.0) [45].
highlight that the gene centric design of the arrays may be
beneficial, in allowing the identification of alterations con-   Identification of copy number alterations
taining single genes or just regulatory regions, which may       CNA data were generated from un-normalized signal in-
aid in our understanding of the complex genomic and epi-         tensities. Signal intensities were extracted for each sample
genomic interactions driving the development and pro-            using GenomeStudio. Probe intensities were subsequently
gression of a malignant phenotype.                               subjected to GC content normalization, carried out using
                                                                 cyclic loess and log2 ratios, generated to averaged normal
Materials and methods                                            reference samples [25]. Circular binary segmentation,
Study population                                                 from the R package DNAcopy, was then performed to de-
DNA from 11 chondrosarcoma specimens were subjected to           fine chromosomal segments with differing CN states, with
profiling on Infinium HumanMethylation450 BeadChip and           the following settings: alpha = 0.001, undo.splits = ‘sdundo’,
HumanCytoSNP-12 BeadChip (GSE40853) [40]. The mater-             min.wdith = 3 [31]. Thresholds for the identification of
ial was obtained from the RNOH Musculoskeletal Biobank,          single copy CNAs were derived from the difference in log
with approval provided by the Cambridgeshire 1 Research          ratio between normal reference DNA from male and
Ethics Committee (reference number 09/H0304/78).                 female samples (log2 ± 0.33), denoting a single copy
   Infinium methylation data with matched targeted exome-        change in the X chromosome; high-level amplifications
seq data were generated from 44 formalin-fixed paraffin          and homozygous deletions were defined incrementally
wax-embedded (FFPE) head and neck squamous cell car-             from this threshold. The level of noise was determined
cinoma (HNSCC) samples [41] (GSE38271, SRP034519).               from the median deviance of neighboring probes. Probes
Ethical approval for these samples was granted by the UCL/       that show a high degree of variability, such as the highly
UCLH Ethics Committee (reference number 04/Q0505/59).            polymorphic major histocompatibility (MHC) region on
   Finally, matched Infinium array and Affymetrix SNP6.0         the short arm of chromosome 6, were removed from sub-
array data were downloaded from TCGA DataPortal for              sequent analysis.
74 GBM samples [42] and for 178 prostate cancer samples             This method for identifying CNAs from the Infinium
[43].                                                            methylation arrays is incorporated in the ChAMP Bio-
                                                                 conductor package [46,47], an Infinium HumanMethyla-
Genome-wide methylation profiling                                tion450K array integrated analysis pipeline that allows
For chondrosarcoma and HNSCC, 1 μg of DNA from fresh             quality control, normalization, calling of differentially
frozen tissue and 2 μg from FFPE tissues [41] were bisulfite     methylated regions and methylation variable positions
converted using the EZ DNA Methylation kit (Zymo Re-             along with detection of CNAs [47].
search Corp. Irvine, CA, USA) according to the manufac-             Copy number alterations from reference CytoSNP arrays
turer’s instructions, with the exception of FFPE samples,        were generated with DNAcopy (chondrosarcomas) as
which were bisulfite converted using a modified protocol         above from normalized R values. We analyzed publicly
[44]. Bisulphite converted samples were processed and hy-        available GBM Affymetrix SNP6.0 segmented data to iden-
bridized to the Infinium HumanMethylation450 BeadChip            tify CNAs. Thresholds derived from the difference between
according to the manufacturer’s recommendations. Subse-          sex chromosomes in male and female patients was used to
quent data were processed and beta values computed using         identify single CN gains and homozygous deletions. Ampli-
the methylation module of the GenomeStudio software              fications and homozygous deletions were assessed using in-
(version 1.9.0; Illumina). Briefly, each CpG locus interro-      cremental thresholds.
gated is represented by signals corresponding to both the
methylated (M) and unmethylated (U) alleles, respectively.       Correlation between Infinium and SNP array-defined
The beta value represents the ratio of the intensity of the      CNAs
methylated bead type to the combined locus intensity: β =        Regression analysis was used to determine the association
max(M, 0)/(max(M,0) + max(U,0) + 100) and reflects the           between signal intensities and CNAs from the Infinium
methylation status of a specific CpG site.                       HumanMethylation450 BeadChip and CNA status defined
Feber et al. Genome Biology 2014, 15:R30 Page 11 of 13
http://genomebiology.com/2014/15/2/R30
from SNP arrays (Affymetrix SNP6.0 or Illumina CytoSNP). Additional file
This was carried out in R using Bioconductor packages glm
or gam. The Bioconductor packages and iRanges [48] were Additional file 1: Figures S1 to S5. Figure S1. Distribution of beta
values for promoter associated and non-associated CpGs. (A) Boxplot of
used to define overlapping regions between Infinium and beta values for CpGs in non-CpG island associated promoters and CpG is-
SNP array CNA data from all 407 paired samples. land associated promoters for regions of genomic amplification. (B)
Binomial probabilities of true positive detection were Regions of genomic deletion, (C) Regions of genomic loss, (D) CNA neutral
regions and (E) Regions of single copy gain.
calculated across all 407 samples at any given CNA al-
teration threshold (deletion, loss, gain or amplification).
We define true positive binomial probabilities first by Abbreviations
CN: copy number; CNA: copy number alteration; GBM: glioblastoma
defining true positive counts. The true positive count is multiforme; HNSCC: head and neck squamous cell carcinoma;
defined as the number of overlapping regions between ICGC: International Cancer Genome Consortium; SNP: single-nucleotide
paired samples on any two platforms at any given alter- polymorphism; TCGA: The Cancer Genome Atlas.
ation threshold and alteration size. A binomial test was
Competing interests
used to convert true positive counts to binomial prob- The authors declare that they have no competing interest.
abilities with 95% confidence intervals for each sample
comparison. Authors’ contributions
Sensitivity was defined by the number of true positives AF conceived and developed the method for identifying CNAs from Infinium
arrays and wrote the manuscript. TJM incorporated the method in the
over the total number of alterations (true positives plus ChAMP pipeline. GAW and AET provided bioinformatics and statistical
false negatives) detected by the Infinium array at any support. ML, PG, TF, and AMF provided samples and data. SB and JDK
given alteration threshold. Specificity was determined by supervised the study and CT, SB and JDK contributed to writing the
manuscript. All authors have read and approved the final manuscript.
the Infinium false positive call rate (that is, an Infinium
CNA identified in a region of no change defied by the Acknowledgments
SNP array). True negatives were defined as overlapping AF is supported by the UCL/UCLH Comprehensive Biomedical Research
genomic regions without alteration on both platforms, Centre and the Rosetrees Trust. Research in the Beck lab was supported by
the Wellcome Trust (WT084071, WT093855), Royal Society Wolfson Research
compared to the number of Infinium false positives plus Merit Award (WM100023), MRC (G100041), IMI-JU OncoTrack (115234) and
true negatives. Only windows with more than three EU-FP7 projects EPIGENESYS (257082), IDEAL (259679) and BLUEPRINT
probes in both platforms were assessed. (282510). PG was supported by a PhD CASE Studentship from the UK Medical
Research Council (G1000411). CT is supported by Cancer Research UK and The
Raymond and Beverly Sackler Foundation. AET was supported by a Heller
Research Fellowship. Research in the Flanagan lab was supported by Skeletal
Targeted exome sequence analysis Cancer Action Trust (Scat), the UCLH/UCL Comprehensive Biomedical Research
Programme and the UCL Experimental Cancer Centre. JK is supported by the
Matched tumor and germline DNA from 44 FFPE UCLH/UCL Comprehensive Biomedical Research Programme.
HNSCC samples were subjected to targeted exome cap-
ture and next-generation sequencing [36,41]. Briefly, ex- Author details
1
UCL Cancer Institute, University College London, 72 Huntley Street, London
ome sequencing was carried out using a custom WC1E 6BT, UK. 2Royal National Orthopaedic Hospital, Stanmore, Brockly Hill,
SureSelect capture kit, representing 3,230 exons in 182 Middlesex HA7 4LP, UK. 3Division of Surgery and Interventional Science, UCL
cancer-related genes plus 37 introns from 14 genes often Medical School, University College London, London WC1E 6BT, UK.
rearranged in cancer. Paired-end sequencing was per- Received: 3 July 2013 Accepted: 3 February 2014
formed using the HiSeq2000 (Illumina). Reads were subse- Published: 3 February 2014
quently mapped to the reference human genome (hg19)
using the BWA aligner and processed using SAMtools References
1. Feber A, Clark J, Goodwin G, Dodson AR, Smith PH, Fletcher A, Edwards S,
[49], Picard [50] and the Genome Analysis Toolkit Flohr P, Falconer A, Roe T, Kovacs G, Dennis N, Fisher C, Wooster R, Huddart R,
(GATK) [51]. CNAs were detected by comparing targeted Foster CS, Cooper CS: Amplification and overexpression of E2F3 in human
genomic DNA sequence coverage with a process-matched bladder cancer. Oncogene 2004, 23:1627–1630.
2. Holcomb IN, Young JM, Coleman IM, Salari K, Grove DI, Hsu L, True LD,
normal control sample. Genomic rearrangements were Roudier MP, Morrissey CM, Higano CS, Nelson PS, Vessella RL, Trask BJ:
detected by clustering chimeric reads mapping to targeted Comparative analyses of chromosome alterations in soft-tissue
introns [36,47]. metastases within and across patients with castration-resistant
prostate cancer. Cancer Res 2009, 69:7793–7802.
3. Hammerman PS, Hayes DN, Wilkerson MD, Schultz N, Bose R, Chu A, Collisson EA,
Cope L, Creighton CJ, Getz G, Herman JG, Johnson BE, Kucherlapati R, Ladanyi M,
Quantitative PCR validation of alterations Maher CA, Robertson G, Sander C, Shen R, Sinha R, Sivachenko A, Thomas RK,
Travis WD, Tsao MS, Weinstein JN, Wigle DA, Baylin SB, Govindan R, Meyerson M:
Deletions of PTCH1 (chromosome 9) and GSTT1 (chromo- Comprehensive genomic characterization of squamous cell lung cancers.
some 22) were validated in triplicate biological replicates Nature 2012, 489:519–525.
using SYBR-Green quantitative PCR. Loss of these regions 4. Cancer Genome Atlas N: Comprehensive molecular portraits of human
breast tumours. Nature 2012, 490:61–70.
was determined relative to the control gene ACTB 5. Kallioniemi A, Kallioniemi OP, Waldman FM, Chen LC, Yu LC, Fung YK, Smith HS,
(chromosome 7), a universal housekeeping gene. Pinkel D, Gray JW: Detection of retinoblastoma gene copy number inFeber et al. Genome Biology 2014, 15:R30 Page 12 of 13
http://genomebiology.com/2014/15/2/R30
metaphase chromosomes and interphase nuclei by fluorescence in situ 24. Deaton AM, Bird A: CpG islands and the regulation of transcription.
hybridization. Cytogenet Cell Genet 1992, 60:190–193. Genes Dev 2011, 25:1010–1022.
6. Pinkel D, Segraves R, Sudar D, Clark S, Poole I, Kowbel D, Collins C, Kuo WL, 25. Marioni JC, Thorne NP, Valsesia A, Fitzgerald T, Redon R, Fiegler H, Andrews TD,
Chen C, Zhai Y, Dairkee SH, Ljung BM, Gray JW, Albertson DG: High Stranger BE, Lynch AG, Dermitzakis ET, Carter NP, Tavare S, Hurles ME: Breaking
resolution analysis of DNA copy number variation using comparative the waves: improved detection of copy number variation from microarray-
genomic hybridization to microarrays. Nat Genet 1998, 20:207–211. based comparative genomic hybridization. Genome Biol 2007, 8:R228.
7. Snijders AM, Nowak N, Segraves R, Blackwood S, Brown N, Conroy J, Hamilton G, 26. Diskin SJ, Li M, Hou C, Yang S, Glessner J, Hakonarson H, Bucan M, Maris JM,
Hindle AK, Huey B, Kimura K, Law S, Myambo K, Palmer J, Ylstra B, Yue JP, Gray JW, Wang K: Adjustment of genomic waves in signal intensities from whole-
Jain AN, Pinkel D, Albertson DG: Assembly of microarrays for genome-wide genome SNP genotyping platforms. Nucleic Acids Res 2008, 36:e126.
measurement of DNA copy number. Nat Genet 2001, 29:263–264. 27. Sun Z, Chai HS, Wu Y, White WM, Donkena KV, Klein CJ, Garovic VD, Therneau TM,
8. Zhao X, Li C, Paez JG, Chin K, Janne PA, Chen TH, Girard L, Minna J, Kocher JP: Batch effect correction for genome-wide methylation data with Illu-
Christiani D, Leo C, Gray JW, Sellers WR, Meyerson M: An integrated view mina Infinium platform. BMC Med Genomics 2011, 4:84.
of copy number and allelic alterations in the cancer genome using 28. Marabita F, Almgren M, Lindholm ME, Ruhrmann S, Fagerstrom-Billai F,
single nucleotide polymorphism arrays. Cancer Res 2004, 64:3060–3071. Jagodic M, Sundberg CJ, Ekstrom TJ, Teschendorff AE, Tegner J,
9. Haraksingh RR, Abyzov A, Gerstein M, Urban AE, Snyder M: Genome-wide Gomez-Cabrero D: An evaluation of analysis pipelines for DNA
mapping of copy number variation in humans: comparative analysis of methylation
high resolution array platforms. PLoS One 2011, 6:e27859. profiling using the Illumina HumanMethylation450 BeadChip
10. Fridley BL, Chalise P, Tsai YY, Sun Z, Vierkant RA, Larson MC, Cunningham JM, platform. Epigenetics 2013, 8:333–346.
Iversen ES, Fenstermacher D, Barnholtz-Sloan J, Asmann Y, Risch HA, Schildkraut JM, 29. Johnson WE, Li C, Rabinovic A: Adjusting batch effects in microarray
Phelan CM, Sutphen R, Sellers TA, Goode EL: Germline copy number variation and expression data using empirical Bayes methods. Biostatistics 2007,
ovarian cancer survival. Front Genet 2012, 3:142. 8:118–127.
11. McCarroll SA: Extending genome-wide association studies to 30. Dedeurwaerder S, Defrance M, Calonne E, Denis H, Sotiriou C, Fuks F:
copy-number variation. Hum Mol Genet 2008, 17:R135–R142. Evaluation of the Infinium Methylation 450 K technology. Epigenomics 2011,
12. Down TA, Rakyan VK, Turner DJ, Flicek P, Li H, Kulesha E, Graf S, Johnson N, 3:771–784.
Herrero J, Tomazou EM, Thorne NP, Backdahl L, Herberth M, Howe KL, 31. Olshen AB, Venkatraman ES, Lucito R, Wigler M: Circular binary
Jackson DK, Miretti MM, Marioni JC, Birney E, Hubbard TJ, Durbin R, Tavare S, segmentation for the analysis of array-based DNA copy number data.
Beck S: A Bayesian deconvolution strategy for immunoprecipitation-based Biostatistics 2004, 5:557–572.
DNA methylome analysis. Nat Biotechnol 2008, 26:779–785. 32. Nam RK, Zhang WW, Jewett MA, Trachtenberg J, Klotz LH, Emami M, Sugar L,
13. Feber A, Wilson GA, Zhang L, Presneau N, Idowu B, Down TA, Rakyan VK, Sweet J, Toi A, Narod SA: The use of genetic markers to determine risk for
Noon LA, Lloyd AC, Stupka E, Schiza V, Teschendorff AE, Schroth GP, prostate cancer at prostate biopsy. Clin Cancer Res 2005, 11:8391–8397.
Flanagan A, Beck S: Comparative methylome analysis of benign and 33. Choubey VK, Sankhwar SN, Tewari R, Sankhwar P, Singh BP, Rajender S:
malignant peripheral nerve sheath tumors. Genome Res 2011, Null genotypes at the GSTM1 and GSTT1 genes and the risk of benign
21:515–524. prostatic hyperplasia: A case–control study and a meta-analysis. Prostate
14. Weber M, Davies JJ, Wittig D, Oakeley EJ, Haase M, Lam WL, Schubeler D: 2012, 73:146–152.
Chromosome-wide and promoter-specific analyses identify sites of 34. Salinas-Souza C, Petrilli AS, de Toledo SR: Glutathione S-transferase
differential DNA methylation in normal and transformed human cells. polymorphisms in osteosarcoma patients. Pharmacogenet Genomics 2010,
Nat Genet 2005, 37:853–862. 20:507–515.
15. Irizarry RA, Ladd-Acosta C, Carvalho B, Wu H, Brandenburg SA, Jeddeloh JA, 35. Salinas-Sanchez AS, Sanchez-Sanchez F, Donate-Moreno MJ, Rubio-Del-Campo A,
Wen B, Feinberg AP: Comprehensive high-throughput arrays for relative Serrano-Oviedo L, Gimenez-Bachs JM, Martinez-Sanchiz C, Segura-Martin M,
methylation (CHARM). Genome Res 2008, 18:780–790. Escribano J: GSTT1, GSTM1, and CYP1B1 gene polymorphisms and
16. Bibikova M, Le J, Barnes B, Saedinia-Melnyk S, Zhou L, Shen R, Gunderson KL: susceptibility to sporadic renal cell cancer. Urol Oncol 2011, 30:864–870.
Genome-wide DNA methylation profiling using Infinium assay. 36. Lechner M, Frampton G, Fenton T, Feber A, Palmer G, Jay A, Pillay N, Forster M,
Epigenomics 2009, 1:177–200. Cronin MT, Lipson D, Miller VA, Brennan TA, Henderson S, Vaz F, OF P,
17. Bibikova M, Barnes B, Tsan C, Ho V, Klotzle B, Le JM, Delano D, Zhang L, Kalavrezos N, Yelenski R, Beck S, Stephens PJ, Boshoff C: Targeted next-
Schroth GP, Gunderson KL, Fan JB, Shen R: High density DNA methylation generation sequencing of head and neck squamous cell carcinoma
array with single CpG site resolution. Genomics 2011, 98:288–295. identifies novel genetic alterations in HPV+ and HPV- tumors.
18. Bibikova M, Lin Z, Zhou L, Chudin E, Garcia EW, Wu B, Doucet D, Thomas NJ, Genome Med 2013, 5:49.
Wang Y, Vollmer E, Goldmann T, Seifart C, Jiang W, Barker DL, Chee MS, Floros J, 37. Eckel-Passow JE, Atkinson EJ, Maharjan S, Kardia SL, De AM: Software
Fan JB: High-throughput DNA methylation profiling using universal bead comparison for evaluating genomic copy number variation for
arrays. Genome Res 2006, 16:383–393. Affymetrix 6.0 SNP array platform. BMC Bioinformatics 2011, 12:220.
19. Gerlinger M, Rowan AJ, Horswell S, Larkin J, Endesfelder D, Gronroos E, 38. Winchester L, Yau C, Ragoussis J: Comparing CNV detection methods for
Martinez P, Matthews N, Stewart A, Tarpey P, Varela I, Phillimore B, Begum S, SNP arrays. Brief Funct Genomic Proteomic 2009, 8:353–366.
McDonald NQ, Butler A, Jones D, Raine K, Latimer C, Santos CR, Nohadani M, 39. Baross A, Delaney AD, Li HI, Nayar T, Flibotte S, Qian H, Chan SY, Asano J,
Eklund AC, Spencer-Dene B, Clark G, Pickering L, Stamp G, Gore M, Szallasi Z, Ally A, Cao M, Birch P, Brown-John M, Fernandes N, Go A, Kennedy G,
Downward J, Futreal PA, Swanton C: Intratumor heterogeneity and branched Langlois S, Eydoux P, Friedman JM, Marra MA: Assessment of algorithms
evolution revealed by multiregion sequencing. N Engl J Med 2012, for high throughput detection of genomic copy number variation in
366:883–892. oligonucleotide microarray data. BMC Bioinformatics 2007, 8:368.
20. Houseman EA, Christensen BC, Karagas MR, Wrensch MR, Nelson HH, Wiemels JL, 40. Guilhamon P, Eskandarpour M, Halai D, Wilson GA, Feber A, Teschendorff AE,
Zheng S, Wiencke JK, Kelsey KT, Marsit CJ: Copy number variation has little Gomez V, Hergovich A, Tirabosco R, Fernanda Amary M, Baumhoer D, Jundt G,
impact on bead-array-based measures of DNA methylation. Bioinformatics Ross MT, Flanagan AM, Beck S: Meta-analysis of IDH-mutant cancers identifies
2009, 25:1999–2005. EBF1 as an interaction partner for TET2. Nat Commun 2013, 4:2166.
21. Kwee I, Rinaldi A, Rancoita P, Rossi D, Capello D, Forconi F, Giuliani N, Piva R, 41. Lechner M, Fenton T, West J, Wilson G, Feber A, Henderson S, Thirlwell C,
Inghirami G, Gaidano G, Zucca E, Bertoni F: Integrated DNA copy number Dibra HK, Jay A, Butcher L, Chakravarthy AR, Gratrix F, Patel N, Vaz F, O'Flynn P,
and methylation profiling of lymphoid neoplasms using a single array. Kalavrezos N, Teschendorff AE, Boshoff C, Beck S: Identification and functional
Br J Haematol 2012, 156:354–357. validation of HPV-mediated hypermethylation in head and neck squamous
22. Miller CA, Hampton O, Coarfa C, Milosavljevic A: ReadDepth: a parallel R cell carcinoma. Genome Med 2013, 5:15.
package for detecting copy number alterations from short sequencing 42. The Cancer Genome Atlas: GBM. [https://tcga-data.nci.nih.gov/tcga/
reads. PLoS One 2011, 6:e16327. tcgaCancerDetails.jsp?diseaseType=GBM&diseaseName]
23. Letouze E, Allory Y, Bollet MA, Radvanyi F, Guyon F: Analysis of the copy 43. The Cancer Genome Atlas: Prostate. [https://tcga-data.nci.nih.gov/tcga/
number profiles of several tumor samples from the same patient reveals tcgaCancerDetails.jsp?diseaseType=PRAD&diseaseName=Prostate%
the successive steps in tumorigenesis. Genome Biol 2010, 11:R76. 20adenocarcinoma]Feber et al. Genome Biology 2014, 15:R30 Page 13 of 13
http://genomebiology.com/2014/15/2/R30
44. Thirlwell C, Eymard M, Feber A, Teschendorff A, Pearce K, Lechner M,
Widschwendter M, Beck S: Genome-wide DNA methylation analysis of
archival formalin-fixed paraffin-embedded tissue using the Illumina
Infinium HumanMethylation27 BeadChip. Methods 2010, 52:248–254.
45. The R project for statistical computing. [http://www.r-project.org/]
46. Bioconductor. [http://www.bioconductor.org/]
47. Morris TJ, Butcher LM, Feber A, Teschendorff AE, Chakravarthy AR, Wojdacz
TK, Beck S: ChAMP: 450 k Chip Analysis Methylation Pipeline.
Bioinformatics 2013, 30:428–430.
48. Bioconductor: cghMRC. [http://www.bioconductor.org/packages/2.12/bioc/
html/cghMCR.html]
49. Li H, Handsaker B, Wysoker A, Fennell T, Ruan J, Homer N, Marth G, Abecasis G,
Durbin R: The Sequence Alignment/Map format and SAMtools.
Bioinformatics 2009, 25:2078–2079.
50. Picard. [http://picard.sourceforge.net]
51. Genome Analysis Toolkit. [https://www.broadinstitute.org/gatk/index.php]
doi:10.1186/gb-2014-15-2-r30
Cite this article as: Feber et al.: Using high-density DNA methylation
arrays to profile copy number alterations. Genome Biology 2014 15:R30.
Submit your next manuscript to BioMed Central
and take full advantage of:
• Convenient online submission
• Thorough peer review
• No space constraints or color figure charges
• Immediate publication on acceptance
• Inclusion in PubMed, CAS, Scopus and Google Scholar
• Research which is freely available for redistribution
Submit your manuscript at
www.biomedcentral.com/submitYou can also read