Vickers Project Market Analysis - Chatham County
←
→
Page content transcription
If your browser does not render page correctly, please read the page content below

Vickers Project Market Analysis

CONTENT
OBJECTIVES                         03

EXECUTIVE SUMMARY                  04

SITE PLAN & CMA BOUNDARIES         08

HOUSING DEMAND                     07 - 15

PRICING AND COMPETITIVE ANALYSIS   16 - 28
COMMERCIAL ANALYSIS                29
DEMOGRAPHIC ANALYSIS               37
APPENDIX                           42

                                             2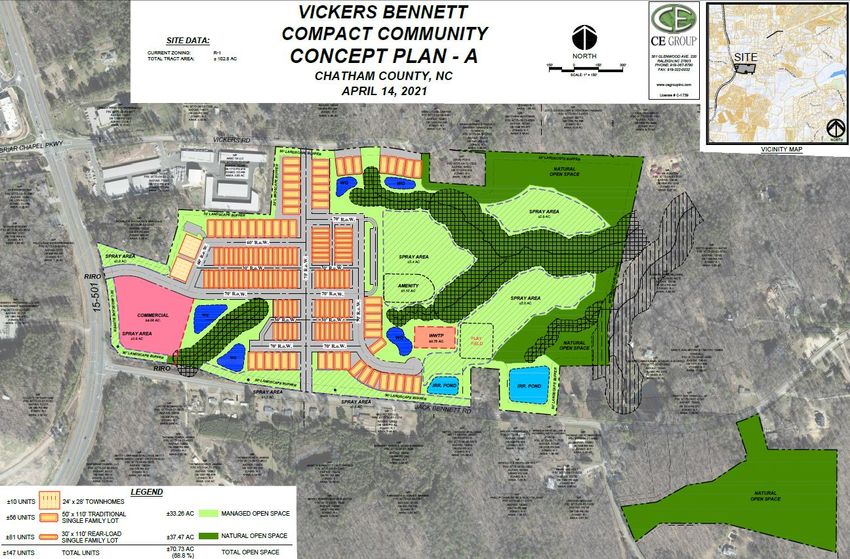
OBJECTIVES
The objectives of this assignment was to provide a market study to include demand analysis, absorption and final home prices
for the different segments of the Vickers projected located in Chatham County, North Carolina. In addition, we were asked to
provide a description of demand indicators for each land use type, including commercial.

EXECUTIVE SUMMARY

The Vickers project is a well-planned multi-use community of 115-acres located on
Highway 15-501 directly across from Briar Chapel. The community is planned for 195
units and 20,000 sq. ft. of commercial space. The site plan was created with the
Chatham County comprehensive plan in mind. We believe the proposed units are
currently underserved in the county and will provide a more diverse product offering for
customers.
With the growth that the norther part of the county has seen, we also believe that there
are commercial services that are needed and not currently offered.

This report contains our assessment of the housing demand, anticipated product, price
and absorption and commercial assessment from JLL. JLL is an international real estate
firm that specializes in a variety of assets including industrial, commercial, retail,
residential and hotel real estate.

                                                                                           4
SITE PLAN

   Vickers Bennett is an approximately 115-acre community
   planned as follows:

   21 SFD Rear-loaded units (47’ x 130’)
   139 Traditional TH (3-story, 2-car ) units (22’ x 42’)
   20 Townhomes, tandem 2-car (18’ x 42)
   15 Condos/Apartment units above commercial

   The communiy is planned for 20,000 sq. Ft. of commercial
   located along 15-501. Plans for a play field and passive
   amenity (dog park, etc) are included. There will also be a
   wastewater treatment plant along with onsite spray fields.

   The community will appeal to singles, couples and young
   families. These consumers prefer new homes and
   communities with strong architectural curb appeal and
   desire a location within 30 minutes of work with easy access
   to restraunts and entertainment.

                                                                  5
Sources: YuleGroup
CMA BOUNDARIES

                            The competitive market area is defined by 15-501 to the
                            west, I-40 to the north, Hwy 540 to the east and Hwy 64 to
                            the south. These areas include transportation and
                      CMA   employment corridors. They also represent counties with
                            dwindling new home supply. In conversations with Realtors
                            and new home builders, this area is where ~ 60% of new
                            home buyers are drawn.

     Chatham County

Source: ESRI
                                                                                         6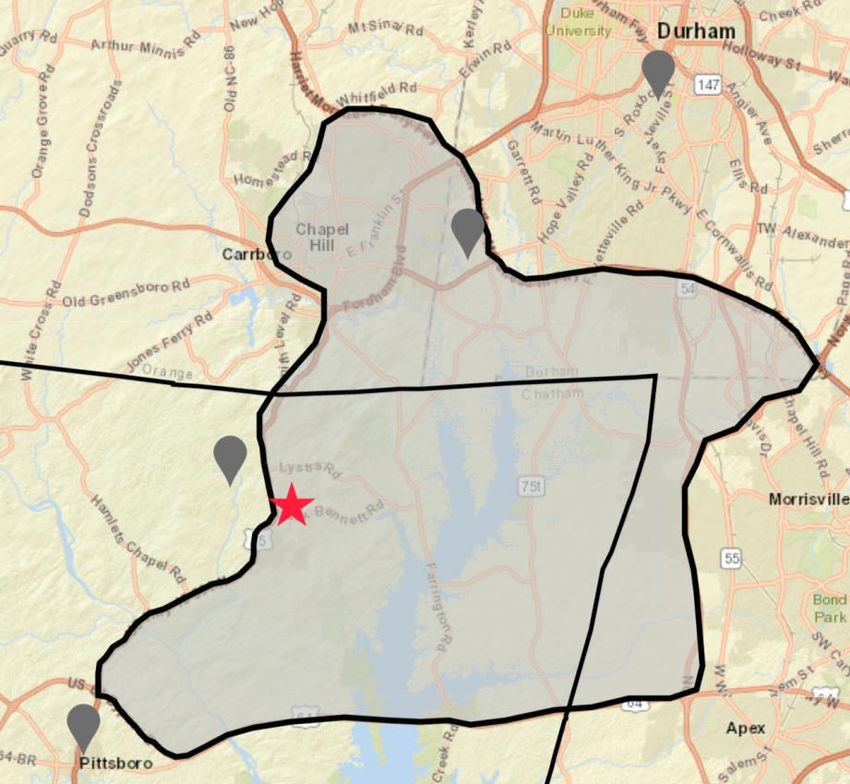
HOUSING DEMAND

                 7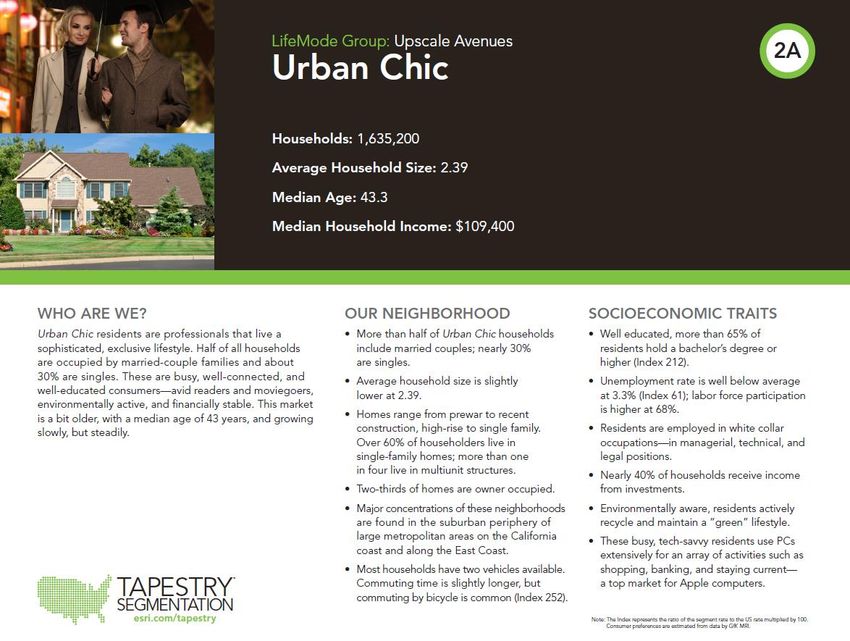
MARKET OVERVIEW

Despite the pandemic, Raleigh’s housing market has continued to grow. According to Zonda, “In March, Raleigh's New Home Pending Sales
Index had the third highest YOY gain among major markets nationwide. The metro’s index did see a decrease MOM, but this is mostly a
reflection of low inventory and sales caps. In terms of demand, Raleigh builders remain in a good place, but the pressure is on to deliver
supply. The pressure will be magnified over the future as Apple has announced it will spend $1B to build a new campus in Research Triangle
Park that will employ 3,000 tech workers at an average salary of $187,000. Raleigh stands among the top 15 metros in the country with the
lowest unemployment rates as its economic recovery continues. As of March data, the metro has recovered 80% of its pandemic job losses
with particular strength in professional and business services. In a recent Zonda Builder Sentiment Survey, 78% of Raleigh builders indicated
they are expanding their geographic search for land opportunities into additional markets due to increasingly competitive conditions caused
by local land constraints and tight lot supply.” This strong demand and waning land supply in counties like Wake, Orange and Durham, will
benefit surrounding counties like Chatham.

According to Moody’s, total nonfarm employment in the Raleigh-Cary, NC metropolitan statistical area decreased 3.0% year over year to
638,900 payrolls in February 2021. There are approximately 19,900 fewer jobs than February of last year. The local unemployment rate
decreased to 4.9% in February 2021 compared to 5.1% in the previous month. Forecasts show that the region’s unemployment rate will
finish the year at 4.8%.

                                                                                                                                                8
Sources: ZONDA, MLS, Moody’s, WRAL
MARKET OVERVIEW (continued)

Several news reports further demonstrate the resiliency of the MSA. According to WRAL, “The coronavirus pandemic has taken a toll on
many facets of daily life, from education to business to mental health. But one area thriving through it all in North Carolina is residential real
estate. According to mover United Van Lines, 60 percent of the moves in North Carolina were made by people moving into the state, which
is the sixth-highest inbound percentage in the country.”
County statistics obtained by WRAL reflect that:

                                     In Wake County, sales were up 6.8 percent, and prices were up 7.1 percent.
                                     In Durham County, sales jumped 4.2, percent, and prices rose 6.7 percent.
                                     Johnston County experienced a 14.5 percent increase in sales and a 6.4 percent increase in prices.
                                     Despite sales dropping 2.2 percent in Orange County, the median price went up more than 4 percent.
                                     Cumberland County had the biggest winners among home sellers, with sales up 13 percent and prices up 12
                                     percent.

With strong recovery in the professional and business services industries, waning supply in neighboring counties and reduced inventory
overall, we believe there is more than sufficient demand for the 215 residential units at the Subject property.

                                                                                                                                                     9
Sources: ZONDA, MLS, Moody’s, WRAL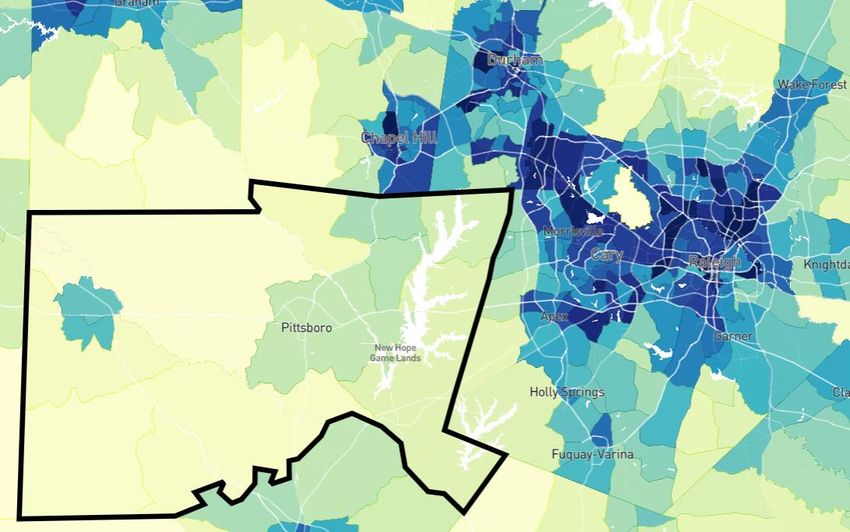
CURRENT AND PROJECTED POPULATION IN THE CMA vs. CHATHAM COUNTY

                                           158,893
                        142,732

                                                              78,620            86,158

               Total population in the CMA is projected to increase by 11% or 16,161 by 2025. By
               comparison, Chatham County is expected to grow by 10%.

Source: ESRI
                                                                                                   10
EMPLOYMENT & JOB DENSITY IN 2013
According to Wake Co. Economic Development, “Unemployment rates
have improved significantly since the worst of the crisis in April 2020,
with 5.3% unemployment reported in November in the Triangle
Region. This is lower than state and national figures.
Economic recovery has been uneven. The restaurant, leisure, and
hospitality sectors continue to show large job losses statewide and
other sectors including education, manufacturing, and public sector
are still far below employment levels from the same time in 2019.
In November 2020, there were nearly over 53,000 people defined as
unemployed in the Triangle region, an increase from over 33,000 in
February 2020. In addition, there are over 43,000 fewer people in the
labor force when compared to February, representing many
previously employed people who have stopped actively looking for
work for reasons including childcare, virtual schooling, caregiving,
health concerns, and others.”
Currently unemployment rates are as follows: Chapel Hill 3.2%,
Durham 4.9%, Cary 2.9%, Apex 3.6%. The unemployment rates are
lowest for the target buyers of new homes.
Number of jobs per square mile in this area
As this map shows, the job centers have historically located in and around Raleigh, Durham and Chapel Hill. Most people who live in Chatham county either
work from home or commute to one of the job centers.
Source: Wake County Economic Development, BLS.gov, OpportunityAtlas
11CURRENT AND PROJECTED HOUSEHOLDS IN THE CMA vs. CHATHAM COUNTY
63,045
56,557
43,016 35,469
31,584 32,277
28,545
19,741
Households in the CMA are projected to grow 2.2% annually (3,140 households)
from 2020 to 2025 vs. 1.8% (1,415 households) for Chatham County.
Source: ESRI
12CURRENT AND PROJECTED HOUSEHOLD SIZE FOR CMA
Site 2010 Average Household Size 2020 Average Household Size 2025 Average Household Size
CMA 2.33 2.39 2.40
Household size in the CMA has remained steady at approximately 2 per household. It’s expected
to increase to almost 2.5 by 2025. When we analyze the population by average age, we see that
25% is 55+ and 15% are 24-34. The proportion of empty nesters and young singles/couples will
hold the average household number down.
Source: ESRI; Demographic breakdown on page 27
13PROJECTED POPULATION CAPTURE IN THE TRADE AREA
Year 2020 2021 2022 2023 2024 2025
Total New Home Sales 3024 3021 3081 3142 3205 3269*
Projected CMA Population Growth 142,732 145,786 148,950 152,182 155,484 158,893
Projected New Home Capture 0 0 2.0% 2.0% 2.0% 2.0%
The subject has a total of 195 units. Anticipated start date is in 2022. We have projected a new
home capture of 2.0% for most of the six-year life of the project. We only have population
projections from the census through 2025 but we expect home capture percentage to drop in 2026
and 2027 as supply dwindles.
Source: ESRI, MLS, *based on projected 2% growth
14CMA - DEMOGRAPHIC PROFILE
25% of residents in this area are 55+; 24.4% are 34 – 54 and 29.3% of homes are valued at $500K + and 17.6% are
15% are 24 - 34 between $400 - 499K and 24% are $300 – 399K.
Median household income was $92,720 in 2020. Median The number of households is expected to grow 2.29%
income is expected to grow ~9% by 2025 to $101,599 annually from 2020-2025.
2020 HH by Income
25.00%
20.00%
15.00%
10.00%
5.00%
0.00%
15
Sources: ESRIPRICING AND COMPETITIVE
ANALYSIS
16PRICING DETAIL
Chapel Hill Product Price Recommendations
Home Home Net Net Ttl Buyer Total
Width Size Base Base Base & Seller Total Price/
Mix (Ft) (SqFt) Bd Ba Levels Pkg Price Price /SqFt Options Price SqFt
Rear Load SFD Builder TBD
Product SFD Sales Start 6/1/22 1.0 47' 2,100 3 2.5 2.0 2.0 $400,000 $400,000 $190 $15,000 $415,000 $198
Total Units 21 1.0 47' 2,300 3 2.5 2.0 2.0 $424,400 $424,400 $185 $15,000 $439,400 $191
Target Sales Rate 1.50 1 47' 2,500 4 3.0 2.0 2.0 $448,800 $448,800 $180 $15,000 $463,800 $186
Sell-Out (months) 14
Total/Avg 3 41' - 50' 2,300 SF $424,400 $424,400 $185 $15,000 $439,400 $191
18' 3-story TH Builder TBD
Product TH Sales Start 6/1/22 1 18' 1,500 3 2.5 3 2.0 $300,000 $300,000 $200 $20,000 $320,000 $213
Allley Load Total Units 20 1 18' 1,800 4 3.0 3 2.0 $323,400 $323,400 $180 $20,000 $343,400 $191
Min Lot/Density Target Sales Rate 4.00 1 18' 2,000 4 3.0 3 2.0 $339,000 $339,000 $170 $20,000 $359,000 $180
Dimens/Config Sell-Out (months) 5
Total/Avg 3 12' 1,767 SF $320,800 $320,800 $182 $20,000 $340,800 $193
22' 3-story TH Builder TBD
Product TH Sales Start 6/1/22 1 22' 1,900 3 2.5 3 2.0 $331,200 $331,200 $174 $15,000 $346,200 $182
Total Units 139 1 22' 2,100 3 2.5 3 2.0 $346,800 $346,800 $165 $15,000 $361,800 $172
Min Lot/Density Target Sales Rate 3.50 1 22' 2,300 3 2.5 3 2.0 $362,400 $362,400 $158 $15,000 $377,400 $164
Dimens/Config Sell-Out (months) 40
Total/Avg 3 2,100 SF $346,800 $346,800 $165 $15,000 $361,800 $172
Condo over Retail Builder TBD
Product Condo Sales Start 12/1/25 1 Condo 800 1 1.0 1 2.0 $270,000 $270,000 $280 $0 $270,000 $338
Condo Total Units 15 1 Condo 1,200 2 2.0 1 2.0 $380,000 $380,000 $420 $0 $380,000 $317
Min Lot/Density Target Sales Rate 2.00
Dimens/Config Sell-Out (months) 8
Total/Avg 2 0' 1,000 SF $325,000 $325,000 $325 $0 $325,000 $325
Overall Totals/Averages: 195 2,003 $350,813 $350,813 $181 $14,359 $365,172 $188
17
Sources: Yule GroupCOMPARABLE FOR SALE PROJECT DETAIL
We anticipate the single-family detached home plans from 2,100 – 2,500 sq. ft. will have an average price of $439,400 for the rear load product.
The 18’ attached homes range from 1,500 to 2,00 sq. ft. and average $340,800 total price. The 22’ attached homes range from 1,900 to 2,300
and average $361,800 in total price. The attached product is in line with Creekside Commons, which is in Durham. Most of the competition for
townhomes is in closeout. The average for the single-family are 3% below Briar Chapel which is appropriate due to the numerous amenities and
brand premium for Briar Chapel. We priced the condos just approximately 1% below Mosiac, as they have more walkable retail planned but
have yet to sale a condo. We believe the sales pace will pick up once they have product to show. We used $0.35/sq. ft. for HOA pricing for the
condos, which is in-line with Mosiac.
Project Summary
Product 3-Mo
Location Community Builder Unit Size (SqFt) Overall Abs Price Avg Price
Type Abs
1 Chapel Hill Rear Load SFD Builder TBD SFD 2,300 1.5 New $400K - $449K $439,400
2 Chapel Hill 18' 3-story TH Builder TBD TH 1,767 4.0 New $300K - $339K $340,800
3 Chapel Hill 22' 3-story TH Builder TBD TH 2,100 3.5 New $331K - $362K $361,800
4 Chapel Hill Condo over Retail Builder TBD Condo 1,000 2.0 New $270K - $380K $325,000
1 Durham Creekside Commons Ryan Homes TH 2,159 4.6 19.0 $336K - $351K $343,490
2 Chatham Providence at Southpoint David Weekley TH 2,092 New New $319K - $343K $330,300
2 Chapel Hill Chapel Run David Weekley TH 2,034 1.0 2.3 $299K - $316K $307,495
3 Chapel Hill Briar Chapel 2100 - 2500 Multiple Builders SFD 2,354 5.3 3.6 $358K - $665K $453,658
4 Pittsboro Mosiac Chatham Park Condo 1,207 0.0 0.0 $274K - $600K $400,700
Competitor Median 2,092 2.8 3.0 $343,490
Competitor Average 1,969 2.7 6.2 $367,129
Competitor Minimum 1,207 0.0 0.0 $307,495
Competitor Maximum 2,354 5.3 19.0 $453,658
18
Sources: Yule GroupCOMPARABLE FOR SALE PROJECT DETAIL
Community Briar Chapel Creekside Commons – Chapel Run (Closed Briar Chapel TH Mosiac Condos
Closeout (TH) Out) (Anticipated pricing) (Above Retail)
Location Chapel Hill Durham Chapel Hill Chapel Hill Pittsboro
Builders David Weekley, Homes by Dan Ryan David Weekley David Weekley Montgomery Construction
Dickerson
Lot Size SFD - 32’, 45’, 55’, 70’ Th - 22’ 18’ 25’ N/A
Future TH – 1800 – 2400 sq. ft.
Home Price $550,000 - $950,000* Townhomes $335,990 - $275,900 - $288,900 $328,467 - $353,187 $273,900 - $599,900
Range $350,990
Square Foot 1,920 – 4,000 1,978 – 2,339 1,558 – 1,915 1,950 – 2,271 853 – 1,675
Range
Total SFD 2,606/94 132/3 441/260 89/89 56/56
Lots/Remaining
Lots
Monthly HOA $130 - $330 (Age restricted) TH $100/month SFD $119/month $200/month $0.33/sq. ft.
$250 - $586
Amenities Jr. Olympic and Free form No Amenities No amenities Jr. Olympic and Free form Amenities include
saltwater pool, clubhouse with Product is 3-stories and includes 2-3 story with 1-car garage saltwater pool, clubhouse with Reserved Covered Parking
fitness center, dog parks, trails, 2-car garages Chapel Hill address but fitness center, dog parks, trails, Smart Phone keyless entry
parks, community garden, located in Durham County parks, community garden, Private entrance with elevators
basketball court, pickle ball, basketball court, pickle ball, Pet spa
volleyball court, amphitheater, volleyball court, amphitheater, Interior – 11’ ceilings, Caesarstone
covered picnic area covered picnic area countertops with tile backsplash
Buyer Profile Local/relos. 55+, young and Local/relos, singles, couples Local/relos, singles, Local/relos, young families, No sales yet
mature families, couples, singles couples, couples, singles
19
Sources: Yule Group, *David Weekley TH price unavailableCOMPARABLE LOCATION MAP
Most of the new townhome competition is in close
out and located near Durham. Briar Chapel is
directly across from the subject but is also in close Creekside Commons
out for smaller product. The one exception is the
three-story townhomes by David Weekley Chapel Run
anticipated to come online by the end of 2021.
Mosiac is offering new condos over retail and is
planning on having four condo buildings.
Briar Chapel
Mosiac
Chatham County CMA Subject
20
Sources: Yule GroupCOMMUNITY PRODUCT RECOMMENDATIONS
The subject is proposing four product lines: condos, an 18’ townhome with a tandem 2-car garage, a 22’ townhome with
a 2-car garage and a 47’, rear-load single-family home. We recommend total prices for the condos of $270,000 -
$380,000, the 18’ townhome product of $320,000 - $359,000 and for the 22’ townhomes a range of $346,200 -
$377,400. For the single-family product we recommend $415,000 to $463,800 for the rear load single-family homes.
$510,000 Subject Price and Sales per Month Est.
Comp Data by Numbers after Builder Name are Sales per
Recommendations Month/Last 3 Mo Sales Rate
$490,000
$470,000
$450,000
Rear Load SFD - , Builder TBD, 1.5
$430,000
$410,000
18' 3-story TH - , Builder TBD, 4.0
Update
Total Price
$390,000
$370,000 22' 3-story TH - , Builder TBD, 3.5
$350,000
Condo over Retail - , Builder TBD, 2.0
$330,000
$310,000
$290,000
$270,000
$250,000
700 850 1,000 1,150 1,300 1,450 1,600 1,750 1,900 2,050 2,200 2,350 2,500 2,650 2,800
Unit Size (SqFt) 21
Sources: Yule GroupCOMMUNITY TOWNHOME & CONDO BASE PRICING POSITIONING
We recommend three plans for each townhome line. For the 18’ product we recommend 1,500 – 2,000 and for the 22’ product 1,900 –
2,300 sq. ft. We have priced the Subject in-line with Creekside Commons and just above Chapel Run closings. Please note that these closings
occurred in 2019 and prices have risen approximately 10-15% since then. We believe that the lack of attached supply as well as the small
number of townhomes planned for the Subject will allow for a stronger price per sq. ft. We priced the condos 1% below Mosiac. They have
more planned retail but have been preselling for a year with no sales. We expect sales to increase once they have product to show.
$400,000 Subject Price and Sales per Month Est.
Comp Data by Numbers after Builder Name are Sales per
Month/Last 3 Mo Sales Rate
$390,000
18' 3-story TH - , Builder TBD, 4.0
$380,000
$370,000 22' 3-story TH - , Builder TBD, 3.5
$360,000 2. Providence at Southpoint - , David
Weekley, New/New
$350,000 Condo over Retail - , Builder TBD, 2.0
$340,000
Update Potential Briar Chapel TH pricing +3%
Base Price
$330,000
1. Creekside Commons - , Ryan
$320,000 Homes, 4.6/6.3
3. Chapel Run - , David Weekley,
$310,000 1.0/2.3
5. Mosiac - , Chatham Park, New/New
$300,000
$290,000 Chapel Run Closings
$280,000
Recommendations
Creekside Commons
$270,000
Providence at Southpoint
Potential Briar Chapel Pricing
$260,000 Chapel Run Closings
Mosiac
$250,000
700 900 1,100 1,300 1,500 1,700 1,900 2,100 2,300 2,500
Unit Size (SqFt)
22
Sources: MLSCOMMUNITY TOTAL PRICING POSITIONING
The average resale townhome in Chatham County is 2,044 sq. ft and sells for $284,308. The recommended pricing for the 18’ townhome
product averages $340,800 for 1,767 sq. ft. and the 22’ townhome averages 2,100 for $361,800. This price range is a 20- 27% premium over
resale. Most areas of the triangle achieve a 25%-30% premium over resale. Most condo closings in the CMA occurred in Orange County with
average resale of $233,144 with an average age of 32 years. The higher priced ones are along Franklin Street. The average recommended
price for the condos is $325,000 for 1,000 sq. ft. Given the age and supply of condos, we feel the 39% spread between new and resale is
$500,000
appropriate. $490,000 Recommendations
Subject Price and Sales per Month Est.
Comp Data by Numbers after Builder Name are Sales per
$480,000 Creekside Commons Month/Last 3 Mo Sales Rate
Chapel Run
$470,000 Potential Briar Chapel Pricing 18' 3-story TH - , Builder TBD, 4.0
$460,000 Mosiac
$450,000
$440,000 22' 3-story TH - , Builder TBD, 3.5
$430,000
$420,000 Condo over Retail - , Builder TBD, 2.0
$410,000
$400,000 2. Providence at Southpoint - , David
$390,000 Weekley, New/New
$380,000 Update
Potential Briar Chapel TH pricing +3%
Closing Price
$370,000
$360,000
$350,000 5. Mosiac - , Chatham Park, New/New
$340,000
$330,000 Creekside Commons Closings
$320,000
$310,000
Chapel Run Closings
$300,000
$290,000
$280,000 Chatham Co Resale TH Closings
$270,000
$260,000 Durham Co Resale TH Closings
$250,000
$240,000 Orange Co Condo Resale Closings
$230,000
750 950 1,150 1,350 1,550 1,750 1,950 2,150 2,350 2,550
23
Unit Size (SqFt)
Sources: MLSCOMMUNITY SINGLE FAMILY DETACHED TOTAL PRICING
POSITIONING
There is one single-family product; a rear load from 2,100 – 2,500 sq. ft. The average size and price for new homes in Briar
Chapel from 2,100 – 2,500 was $453,658. Our recommendations price the single-family product line at $439,400, which is a
3% discount to Briar Chapel. Given the amenity load and brand recognition, we believe this discount is appropriate.
Subject Price and Sales per Month Est.
$700,000 Comp Data by Numbers after Builder Name are Sales per
Month/Last 3 Mo Sales Rate
Recommendations
$675,000
Briar Chapel
$650,000 Rear Load SFD - , Builder TBD, 1.5
$625,000
Briar Chapel 2100 - 2500
$600,000
$575,000
$550,000 Update
Spec/Closing Price
$525,000
$500,000
$475,000
$450,000
$425,000
$400,000
$375,000
$350,000
$325,000
2,000 2,200 2,400 2,600 2,800
Unit Size (SqFt) 24
Sources: MLSPROJECTED HOME PRICE APPRECIATION
According to Zillow, “Inventory growth should cool down home value appreciation. While panelists expect home value
growth this year to be almost double its pre-bubble, historically “normal” annual pace of 3.6%, they expect a slowdown
through the middle of the decade. On average, panelists said they expect annual home value growth to slow to 4.5% in
2022, slowing further to 3.7%, 3.5%, and 3.6% in 2023, 2024, and 2025, respectively. Even with an anticipated slowdown
to levels more in line with historic norms, the recent stretch of rapid home value growth is extraordinary.”
Based on the above index, Yule Group has based annual price appreciation at 3.3 beginning in 2022. 25
Sources: ZillowFORECASTED PRICE APPRECIATION BY YEAR
Zillow is currently projecting a 3.1% price appreciation for this area. We have conservatively kept the appreciation the
same for 2022 - 2024. Zillow is projecting a 9.8% price appreciation for the total MSA. We reduced to 6.8% to avoid
double counting the appreciation. We have also reduced the price appreciation rate down to 2020’s levels beginning in
2022 as we feel that most of the cost increases are due to delays in materials and is directly related to COVID-19 and
inventory for materials should increase within a year.
MSA and Subject Forecasted Value Change; Subject Forecasted Absorption and Sell-Out
Dec-21 Dec-22 Dec-23 Dec-24
Total Price Appreciation - MSA 6.8% 3.3% 3.3% 3.3%
Project or Neighborhood Adjustments to MSA Forecast
Category
Update
Zillow Home Value Index 3.1% 3.1% 3.1% 3.0%
Other 0.0% 0.0% 0.0% 0.0%
Forecasted Change for Subject 9.9% 6.4% 6.4% 6.3%
Total Price
Community Units Product Detail Dec-21 Dec-22 Dec-23 Dec-24
May 2021
Rear Load SFD 25 Rear Load SFD $439,400 $482,901 $513,806 $546,690 $581,104
18' 3-story TH 20 Allley Load $340,800 $374,539 $398,510 N/A N/A
22' 3-story TH 155 22' 3-story TH $361,800 $397,618 $423,066 $450,142 $478,478
Condo over Retail 15 Condo $325,000 $357,175 $380,034 $404,356 $429,811
Weighted Avg 215 $366,302 $402,566 $428,330 $416,300 $442,507 26
Sources: MLS, ZillowFORECASTED ABSORPTIONS BY YEAR
Below is the forecasted absorption levels for the Subject assuming a 6/1/2022 beginning of sales. We have assumed a
reduction in absorptions in 2023 and beyond as prices rise.
Dec-21 Dec-22 Dec-23 Dec-24 Dec-25 Dec-26 Dec-27 Subject Projected Sales
60
Monthly Absorption Change 0% 0% -10% -10% -10% -10% -10%
50 50
Community Units Sales/Month 2021 2022 2023 2024 2025 2026 2027 50
Rear Load SFD 21 1.50 1.50 1.50 1.35 1.22 1.09 0.98 0.89 40
34
18' 3-story TH 20 4.00 4.00 4.00 3.60 3.24 2.92 2.62 2.36 31 31
30
22' 3-story TH 139 3.50 3.50 3.50 3.15 2.84 2.55 2.30 2.07
Condo over Retail 15 2.00 2.00 2.00 1.80 1.62 1.46 1.31 1.18 20
Total Project 195 11.0 11.0 11.0 9.9 8.9 8.0 7.2 6.5 10
3
Potential Sellout 0
0
2021 2022 2023 2024 2025 2026 2027
Community Units Sales Start 2021 2022 2023 2024 2025 2026 2027
Rear Load SFD 21 06/01/22 0 9 12 0 0 0 0
18' 3-story TH 20 06/01/22 0 20 0 0 0 0 0
22' 3-story TH 139 06/01/22 0 21 38 34 31 16 3
Condo over Retail 15 12/01/25 0 0 0 0 0 15 0
Total Project 195 0 50 50 34 31 31 3
27
Sources: MLS, ZillowCOMPETITIVE MARKET AREA - NEW & RESALE CLOSINGS
We defined the Competitive Market Area (CMA) by 15-501 to the west, I-40 to the north, Hwy 540 to the east and Hwy 64 to the south and included Briar
Chapel which is across 15-501 and has had similar product to the Subject. New home closings were steady at approximately 33% for 2018-2019. Supply has since
dropped and is currenlty projected to drop to 20% this year. The competition for the Subject represents a dwindling market share, starting at 6% and is currently
around 3-5%. At the projected sales absorptions, assuming all product lines are available, the Subject will obtain a 2% market share by 2022. The amount of
market share the Subject property will obtain is much less than the drop-off from the competition.
New and Resale CMA Closings
3500 7%
6%
3000 6%
2500 5% 5%
2000 4%
4% 4%
3%
1500 3% 3%
1000 2%
2% 2%
500 1%
0 0% 0% 0% 0% 0%
2018 2019 2020 2021 2022 2023
New Resale Subject % of market Comp % of market
Includes detached and attached. Added 2%
volume to 2022 & 2023 in new and resales;
added subject property in new beginning 28
Source: MLS, Yule Group 2022.COMMERCIAL
29VERANDA – A CASE STUDY
Veranda is a 42,500 Sq. Ft. neighborhood retail center located at the
entrance to Briar Chapel on 15-501. It was built in 2016, eight years
after the start of the development with approximately 686 homes
closed. The Veranda includes restaurants, traditional office tenants,
preschool / daycare, and health and beauty providers.
Sales at Veranda occurred from 2016-2017 and averaged $327/Sq. Ft.
or $2,330,750 with 7,448 Sq. Ft.
Need comment from
commercial regarding
difference in market then
vs. now
30
Sources: CoStarCOMMERCIAL – ANALYSIS OVERVIEW
The development plan provides for 20,000 SF of commercial space, along the western border of the project site, adjacent to Highway 15-
501 North. The commercial space will benefit from very high visibility along the 4-lane highway and excellent access at a fully signalized
intersection at the southwestern corner of the project. The Vickers Bennett owners will offer the commercial parcel (and necessary
infrastructure) for sale to a commercial real estate developer who will build the physical commercial space.
The site is a natural fit for Class A/B commercial tenants that value easy access, high visibility and proximity to higher density residential
development.
The owners see the commercial development directly across Highway 15-501 North, the Veranda, as a very close - and very successful -
comparable. The Veranda is a part of its parent project, Briar Chapel, which comprises 2,389 approved residential units, 42,500
commercial SF, and 18 parks with 21 miles of trails. The Veranda was developed as two physically adjacent sections and totals
approximately 42,500 SF of commercial and retail space.
The owners anticipate that construction of the commercial parcel will likely start approximately two years after construction of the
residential development begins in 2022. Assuming a one-year build-out of the commercial space, and a six-to-twelve-month absorption
timeframe, the owners expect that 20,000 SF of commercial space would be completely absorbed sometime in 2024/2025.
The owners believe that some of the most likely uses for the commercial space at the Vickers Bennett project would-be stand-alone food
/beverage service, destination entertainment, professional office users, specialized medical providers, and other service providers.
The commercial space will be integrated into the overall design of the Vickers Bennett Project so that each compliments the other. The
adjacent residential development is within an easy walk of the commercial development. The single-family residences will share a
common, inviting connection with the commercial space.
31COMMERCIAL PLAN
102 Vickers Road (the “Site” or “Subject Property”) is a nearly 103-acre development tract that will conceptually hold 195single-family and multi-family units
and approximately 4.06 acres of retail development. The Site is located on Hwy-501 about 7.5 miles south Chapel Hill, North Carolina, an economic
powerhouse home to the University of North Carolina at Chapel Hill (30,000+ enrolled students and 3,800+ faculty). Hwy-501 is a major Raleigh-Durham
arterial roadway that connects major economic centers and population bases, particularly in the Chapel Hill and Durham markets. Directly across the street
from 102 Vickers Road is the Veranda retail development. Dubbed as the “front porch” to the adjacent Briar Chapel neighborhood, the Veranda offers a variety
of locally owned retailers, restaurants, and businesses. Delivered in 2017, the Veranda is now 100 percent occupied as of 2021 and is home to a collection of
medical services, cafes and eateries, a school, and a pharmacy. Serving as a catalyst for retail growth along this Hwy-501 corridor, the Veranda will serve as a
complementary shopping center to the potential retail space within the Subject Property. The Veranda’s stabilized, leas-up timeline of approximately three
years was considered for the lease-up timeline for the Subject Property (found on page 2 of this report). Furthermore, as the immediate trade area continues
to growth, more retailers will need to be constructed in order to support the increased consumer demand. Given the current growth of the Raleigh-Durham
MSA as the second fastest growing “large” city in the U.S. (United Nations Population Division) and recent, record-breaking economic announcements (Apple
and Google), we estimate a greater influx of residents to the MSA as well as a continued, increased need for services and retailers.
32
Sources: JLLCOMMERCIAL – DEMOGRAPHICS & IMMEDIATE TRADE AREA
102 Vickers Road provides incredible retail opportunity due to its surrounding demographics
and immediate trade area. Strength is in numbers with a projected 14% population growth
(2020 - 2025) within one mile of the Site as well as a high average household incomes greater
than $117,000. The site sits on Hwy-501 (30,000+ VPD), a major arterial roadway connecting
Chapel Hill to Durham. Collectively, this is a prime area for increased retail supply to support a
growing and well accessible population.
33
Sources: JLLCOMMERCIAL – FINANCIAL/LEASE UP ANALYSIS
Value Description
• With 4.06 acres of commercial land, this property portion likely yields 35,000 SF of commercial area.
• A $16 PSF NNN retail market rent (area south of Chapel Hill) is applied to all 35,000 SF of potential commercial land. This assumes all tenants pay their pro-
rata share of expenses with no slippage.
• While more aggressive leasing assumptions / development plans (i.e. outparcel pad) could be considered, conservative projections are shown below for a
strip center at $16 PSF NNN rent.
The below analysis assumes the Owner pays all leasing and development costs, including TI’s and leasing commissions.
34
Sources: JLLCOMMERCIAL – FINANCIAL/LEASE UP ANALYSIS COMPS
35
Sources: JLLCOMMERCIAL – KEY FACTORS THAT WILL INCREASE VALUE
• Area Demographics / Buying Power
• Employment Drivers
• Surrounding area single-family and multi-family developments
As these factors continue to progress, retailers will desire to be in this area.
Below are popular retailers who currently do not operate within 5-miles but could occupy space in this
project as they operate nearby:
• Restaurant: Cava, Chipotle, Panera Bread
• Gym: Barre3, The Little Gym
• Auto Parts: Autozone, O’Reilly Auto Parts
• Electronics: Sprint, Verizon
36
Sources: JLLDEMOGRAPHIC OVERVIEW
YULEGRP.COMCHAPEL HILL/CARRBORO – POPULATION TRENDS & KEY INDICATORS
38
Sources: ESRIDOMINANT TAPESTRY MAP – CMA
This map is the dominant tapestry map designated
competitive market area for the Subject. The
orange areas are Affluent Estates LifeMode which
includes Boomburbs and Exurbanites. The dark
pink area is Senior Styles LifeMode and includes
Golden Years. Light Blue areas are Uptown
Individuals and include Metro Renters. Light green
areas are Upscale Avenues and include Urban Chic
buyer groups. These groups represent 57% of the
population in this area.
Vickers
Source: ESRI Bennett 39Target Buyer Groups - Tapestry Descriptions
Boomburbs Exurbanites Golden Years
Market Profile ▪ Average household size is 3.25. • Average household size is 2.5. • Average household size is 2.0
▪ Median Income is $113,400. • Median Income is $103,400. • Median Income is $71,700.
▪ Median age is 34 • Median age is 51 • Median age is 52.3
▪ Young families are mostly married couples • Residents are college educated, more • Single person households (over 40%) and
and nearly half have school-aged kids. than half hold a bachelor’s degree or married-couple families with no children.
▪ Prefer new homes and neighborhoods. higher. • Avid readers, they regularly read daily
▪ These buyers drive long distances to work, • This labor force is beginning to retire, 1 in newspapers, particularly the Sunday edition.
over 30 minutes average. 3 households currently receive social • They use professional services to maintain
▪ Well educated young professionals, 55% are security. their homes inside and out to minimize
college graduates. • Consumers are more interested in quality chores.
▪ Leisure includes sports to visits to theme or than cost. Sociable and hardworking, they • Involved in physical fitness, also travel, sports,
water parks. still find time to stay physically fit. dining out and the arts.
▪ Residents are generous supporters of • They take advantage of their proximity to • Will choose single-family detached or multi-
charitable organizations. large metropolitan centers to support the family units.
arts, but they prefer a more expensive
home style in less crowded
neighborhoods.
40
Source: ESRITarget Buyer Groups - Tapestry Descriptions
Urban Chic
Metro Renters
Market Profile ▪ Average household size is 2.39 • Average household size is 1.6
▪ Median Income is $109,400. • Median Income is $67,000.
▪ Median age is 43.3 • Median age is 32.5
▪ More than half of these households • Single person households (over 50%).
are married couples; 30% are singles • Participate in leisure activities including
▪ Well educated, more than 65% hold a yoga, Pilates and skiing.
bachelor’s degree or higher. • Very interested in fine arts and strive to
▪ Prefer single-family detach housing be sophisticated; value education and
▪ Environmentally aware, residents creativity.
actively recycle and maintain a “green” • Will choose townhome or multi-family
lifestyle. units.
41
Source: ESRIAPPENDIX
42Tapestry Segmentation – Boomburbs
43Tapestry Segmentation – Boomburbs
44Tapestry Segmentation – Boomburbs
45Tapestry Segmentation – Golden Years
46
Source: ESRITapestry Segmentation – Golden Years
47
Source: ESRITapestry Segmentation – Golden Years
48
Source: ESRITapestry Segmentation – Metro Renters
49
Source: ESRITapestry Segmentation – Metro Renters
50
Source: ESRITapestry Segmentation – Metro Renters
Source: ESRI
51Tapestry Segmentation – Exurbanites
52
Source: ESRITapestry Segmentation – Exurbanites
53
Source: ESRITapestry Segmentation – Exurbanites
54
Source: ESRITapestry Segmentation – Urban Chic
55
Source: ESRITapestry Segmentation – Urban Chic
Source: ESRI
56Tapestry Segmentation – Urban Chic
Source: ESRI 57Limiting Conditions
The conclusions and recommendations presented in this report are based on our analysis of the information available to us from our own research and from
the client as of the date of this report. We assume that the information is correct and reliable and that we have been informed about any issues that would
affect project marketability or success potential.
Our conclusions and recommendations are based on current and expected performance of the national, and/or local economy and real estate market. Given
that economic conditions can change, and real estate markets are cyclical, it is critical to monitor the economy and real estate market continuously and to
revisit key project assumptions periodically to ensure that they are still justified.
The future is difficult to predict, particularly given that the economy and housing markets can be cyclical, as well as subject to changing consumer and market
psychology. There will usually be differences between projected and actual results because events and circumstances frequently do not occur as expected,
and the differences may be material. We do not express any form of assurance on the achievability of any pricing or absorption estimates or reasonableness
of the underlying assumptions.
In general, for projects out in the future, we are assuming “normal” real estate market conditions and not a condition of either prolonged “boom” or “bust”
market conditions. We do assume that economic, employment, and household growth will occur more or less in accordance with current expectations. We
are not taking into account major shifts in the level of consumer confidence; in the ability of developers to secure needed project entitlements; in the cost of
development or construction; in tax laws that favor or disfavor real estate markets; or in the availability and/or cost of capital and mortgage financing for
real estate developers, owners and buyers. Should there be such major shifts affecting real estate markets, this analysis should be updated, with the
conclusions and recommendations summarized herein reviewed and re-evaluated under a potential range of build-out scenarios reflecting changed market
conditions.
We have no responsibility to update our analysis for events and circumstances occurring after the date of our report.
58OUR
TEAM
Kristy Yule
Lead Strategist
919.928.6453
kristy@yulegrp.com
59OUR BUSINESS
SERVICES ASSESSMENTS
Consumer Insight
Business Planning
Feasibility Studies
Market Entry Studies
Product Development
Fractional CMO
Marketing Planning, Management & Measurement
RESEARCH
YOUR DELIVER
CUSTOMER
60THANK YOU kristy@yulegrp.com I 919.928.6453 I www.yulegrp.com 61
You can also read