Virginia COVID-19 Surveillance Data Update - January 6, 2022
←
→
Page content transcription
If your browser does not render page correctly, please read the page content below
Virginia
COVID-19 Surveillance Data
         Update

        January 6, 2022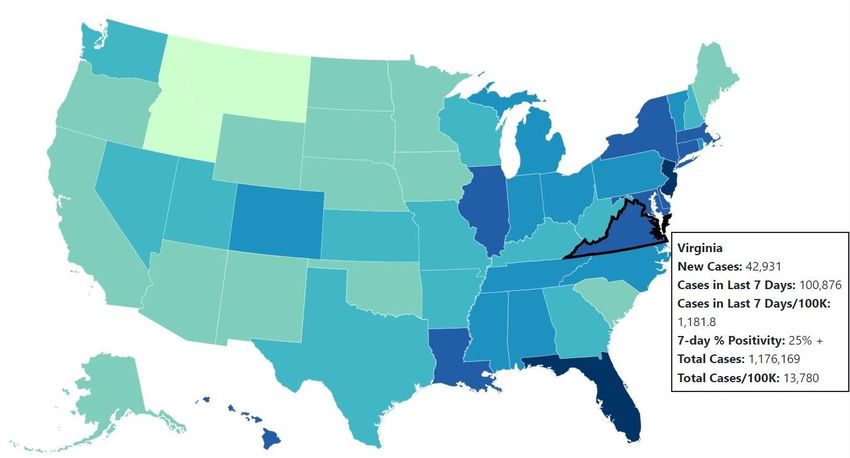
National: Weekly COVID-19 Case Rate
                                                                                                                                                                                         Updated 1/5/22

                                                                                                                                                                                 Cases in the Last 7
                    US COVID-19: 7-Day Case Rate per 100,000, by State/Territory                                                                                                       Days
                                                                                                                                                                                 Per 100k Population

                                                                                                                                                             Virginia            1,181.8 (+89.4%)

                                                                                                                                                                U.S.             1,036.6 (+74.5%)

                                                                                                                                                       New York City*            3,215.1 (+41.6%)
                                                                                                                                                         New York                2360.8 (+166.8%)
                                                                                                                                                          New Jersey             2152.5 (+77.7%)

                                                                                                                                                   District of Columbia           2,086 (+1.6%)

                                                                                                                                                                        Our Neighbors

                                                                                                                                                               Rates Higher than Virginia
                                                                                                                                                            District of Columbia, 2086 (+1.6%)
                                                                                                                                                                Maryland, 1498.3 (+65.6%)

                                                                                                                                                                 Rates Lower than Virginia:
                                                                                                                                                                Tennessee, 1056.4 (+136.9%)
                                                                                                                                                               North Carolina, 904.2 (+178.2%)
                                                                                                                                                               West Virginia, 828.1 (+107.5%)
                                                                                                                                                                  Kentucky, 731.4 (+91.5%)

Source: United States - COVID-19 Overview - Johns Hopkins (jhu.edu): CDC COVID Data Tracker Please note rate change comparisons are from the previous week’s data.                                        2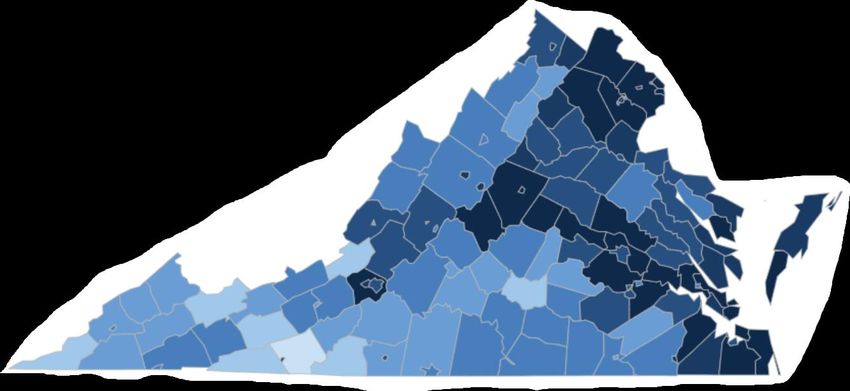
National: Cases, Hospitalizations, and Deaths                                             Updated 1/5/22

                                                   • Compared to last week, cases increased to 491,652
                                                     (7-day MA) per day (+98%)
                                                        • 97% higher than the January peak of 2021
                                                        • 199% higher than the September high of 2021
                                                   • Hospitalizations increased to 14,776 (7-day MA)
                                                     per day (+62.9%)
                                                   • Deaths increased to 1,165 (7-day MA) per day
                                                     (+5.3%)

Source: CDC COVID Data Tracker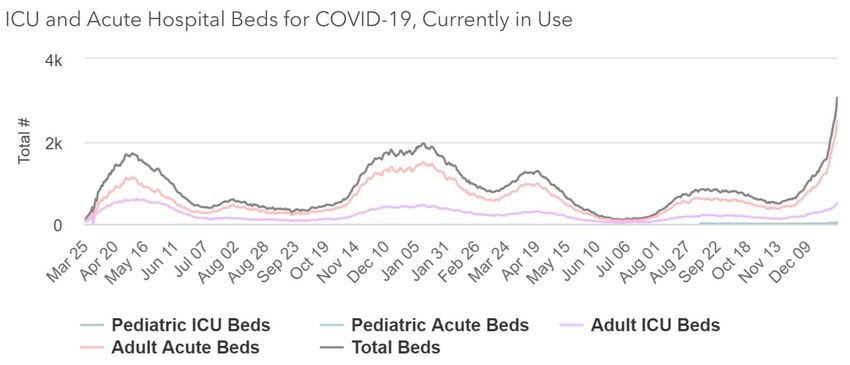
National: Early Estimates of US and Virginia Omicron Prevalence                     Updated 1/4/22

  National Omicron Prevalence: 77 to 95.4% in a week

                                                                    Projected 93.8% of specimens
                                                                    collected in Region 3 (DE, DC,
                                                                    MD, VA, WV) are Omicron

Source: CDC COVID Data Tracker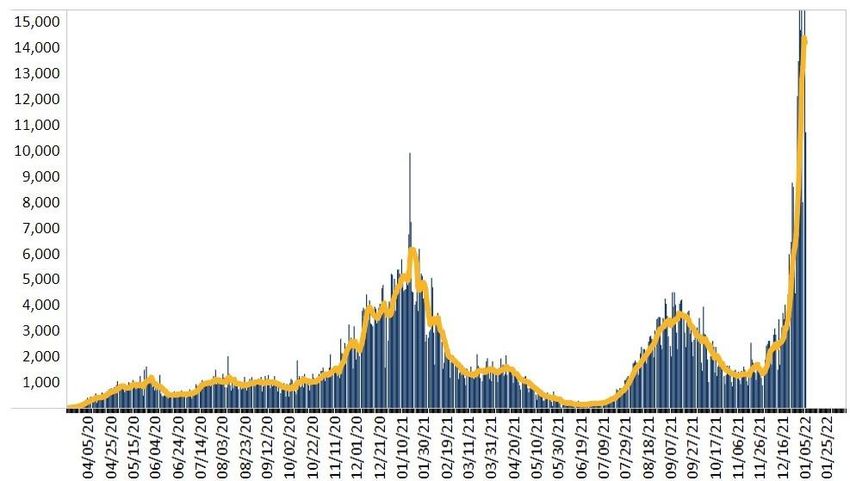
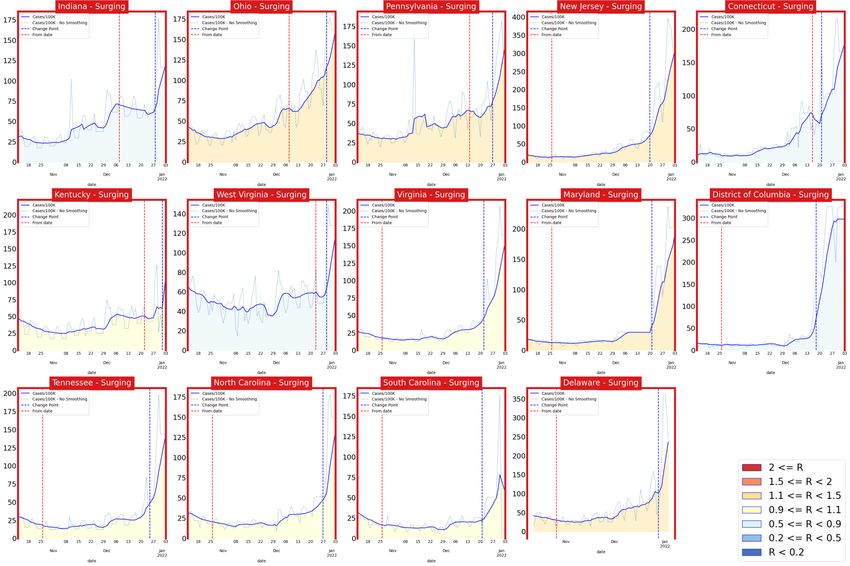
Virginia and Her Neighbors

• All of Virginia
  and neighbors
  experiencing
  rapid growth of
  case rates

• Nearly all
  experiencing
  more than
  100/100K daily
  incident case
  rates

      6-Jan-22               5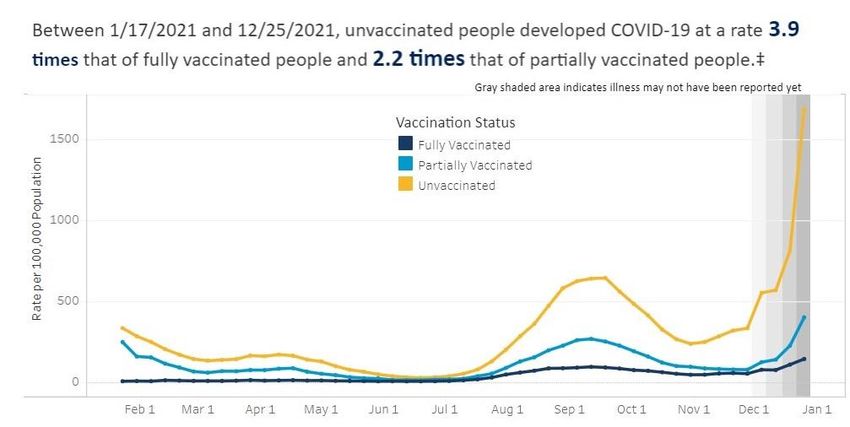
Maryland: Cases & Hospital Rates                                                Updated 1/4/22

                                                      Maryland is having significant increases in
                                                      COVID-19 case rates that far exceed
                                                      previous pandemic highs.

                                                      Compared to last week, cases increased to
                                                      213.71 (7-day MA) per day (+89%)

                                                      Compared to last week,
                                                      hospitalizations increased
                                                      to 3,057 from 1,826 (+67%)
                                                           • 57% higher than the January high
                                                              of 2021

Source: Coronavirus - Maryland Department of Health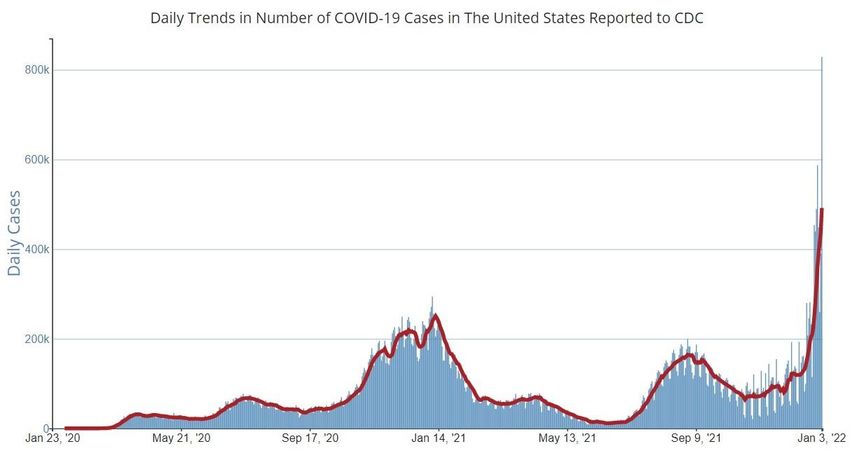
Virginia: Cases, Hospitalizations, and Deaths                                                                                                                   Updated 1/5/22

                                                                                                          Compared to last week, cases increased to 14,212 (7-day MA)
             Cases by Date of Symptom Onset, Past 13 weeks                                                from 7,613 per day (+86.7%)
                                                                                                               • 131% higher than the January peak of 2021
                                                                                                               • 285% higher than the September high of 2021

                                                                                                          • Hospitalizations increased to 2,479 per day (+34.4%)
                                                                                                          • *Deaths decreased to 25 confirmed deaths last week (-57%)
                                                                                                               *Death is now measured by date of death which is recorded by week

                                                                                                               Cases by Date Reported, All Reporting Timeline

                                                Gray shaded area illness may not have been reported yet

*VDH received cumulative death data on 12/28 totaling 185 deaths
Source: Cases – Coronavirus (virginia.gov), Cases and Deaths - Coronavirus (virginia.gov), VHHA
Hospitalizations – Coronavirus (virginia.gov), Data represent a 7-day moving average                                                                                                7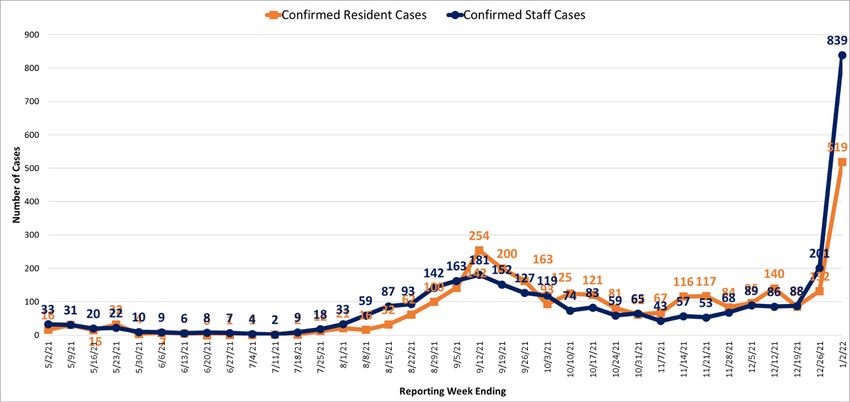
Virginia: Rate of Hospitalizations Per 100,000 by Vaccine Status (1/17/21-12/25/21)   Updated 1/5/22

Source: VDH Hospitalizations by Vaccine Status
Virginia Hospitalization Trends                                                                              Updated 1/5/22

                                            COVID-19 in Virginia Hospitals

                                                                             Compared to last week hospitalizations
                                                                             increased to 2,479 (7-day MA) from
                                                                             1,650 (+34%)
                                                                             •   14% higher than the September high of
                                                                                 2021
                                                                             Compared to last week, ICU
                                                                             hospitalizations have increased to 499
                                                                             from 412 (+21%)
                                                                             280 patients are currently on ventilator
                                                                             support
                                                                             •   20% lower than the September high of
                                                                                 2021

Source: VHHA Hospitalizations - Coronavirus (virginia.gov)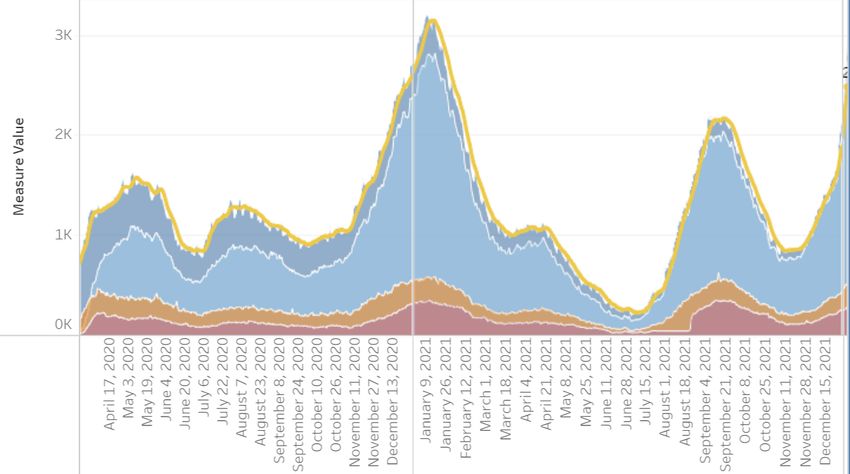
Daily Hospitalized
Virginia: Outcome Projections

                                   Confirmed Cases

                                                                            Daily Deaths

6-Jan-22 UVA Biocomplexity Institute                 Death ground truth from VDH “Event Date” data, most recent dates are not complete 10
Virginia: SARS-CoV-2 Variants of Concern
Omicron o - Lineage B.1.1.529 Delta d - Lineage B.1.617.2
6-Jan-22 11COVID-19 Burden in Virginia LTCFs Questions can be directed to: hai@vdh.virginia.gov Updated 1/4/2022
Key Trends Number and Region of LTCF COVID-19 Outbreaks by Date VDH Notified
• There were 101 LTCF COVID-19 outbreaks reported in the past 30 days: 32 in Eastern,
26 in Northwest, 15 in Central, 14 in Southwest, and 14 in Northern (see figure top right).
• The number of reported resident and staff cases have dramatically increased in the past
two weeks (see figure bottom right).
• For the reporting week ending January 2, 2022, 519 resident and 839 staff cases
were reported to NHSN. Data for this reporting week are preliminary.
• For reporting week ending December 26, 2021, data reported from 280 nursing homes
showed 89% of residents were fully vaccinated; data reported from 280 nursing homes
showed 88% of staff were fully vaccinated (see figures bottom left).
• Of the 19,198 residents eligible to receive an additional dose or booster, 13,389 (70%)
have received an additional dose or booster of COVID-19 vaccine.
• Of the 24,601 healthcare personnel eligible to receive an additional dose or booster,
9,432 (38%) have received an additional dose or booster of COVID-19 vaccine.
• Sixteen (6%) nursing homes reported that no eligible residents have received an
additional dose or booster of COVID-19 vaccine at the time of reporting.
Outbreaks reported from nursing homes, assisted living facilities, and multicare facilities to VDH with a confirmed or suspected
etiologic agent of SARS-CoV-2. Data are from the Virginia Outbreak Surveillance System as of 1/3/2022 and are subject to change.
Nursing Home Resident and Staff COVID-19 Cases
COVID-19 Booster Vaccination in Virginia Nursing Homes (n=286)
Nursing Home Residents Nursing Home Staff
Data are from the National Healthcare Safety Network (NHSN) as of 1/4/2022 and are subject to change, including booster eligibility per
updated vaccine guidance. In Virginia, 280 nursing homes reported resident vaccination data for reporting week ending 12/26/2021; 280 nursing Data are from NHSN as of 1/4/2022 and are subject to change. For reporting information,
homes reported staff vaccination data for reporting week ending 12/26/2021. For staff type definitions, refer to NHSN Table of Instructions. please refer to the NHSN data collection forms: residents, staff.Virginia: Regional Metric Summary Updated 1/5/22
Metrics date: 1/2/2022
Central Eastern Far Southwest Near Southwest Northern Northwest
New cases per 100k
within the last 7 1,100 1,022 521.8 648.7 1,323.3 952.9
days
% Positivity 7-day
moving average 29.0% 38.7% 19.5% 27.3% 32.0% 31.0%
COVID-like ED visits
rate per 100k 82.5 67.3 33.6 42.5 44.1 46.0
Symbol Trend
Burden Level 0 Level 1 Level 2 Level 3 Level 4 Please note: the methods used this
Increasing week have changed slightly; data is now
New Cases 100
% Positivity 10 Decreasing compared from Sunday to Sunday
CLI ED 6 instead of Wednesday to Wednesday
Fluctuating
Visits
Source: Region Metrics – Coronavirus
*Data represents a 7-day moving average, trends compared to 1 week ago comparing end of week totals from Sunday to Sunday 13Virginia: Vaccination by Age Groups Updated 1/5/22
Virginia Vaccination by Age
88.9% (+1.2%) of the Adult (18+) Population Vaccinated with at Least One Dose
72.0% (+1.0%) of the Eligible (5+) Population Fully Vaccinated
67.8% (+1.0%) of the Total Population has been Fully Vaccinated
49.3% (+8.9%) of the Eligible Population and 24.7% (+11.3%) of Total Population Vaccinated with 3rd Dose/Booster
• Green percent represents percent increase from two weeks prior
Source: COVID-19 in Virginia: Vaccine Summary, Keep Virginia Safe Tournament | Metaculus 14Virginia: Vaccine Demand by Dose Number Updated 1/5/22
First Dose, Second Dose, and Booster Administrations Are Slightly Increasing
• Third Dose/Booster administrations have increased in the past few days after seeing a large decline over the winter holidays
• First Dose and Second Dose administrations have slowly increased over the past week
Federal doses not included in this number
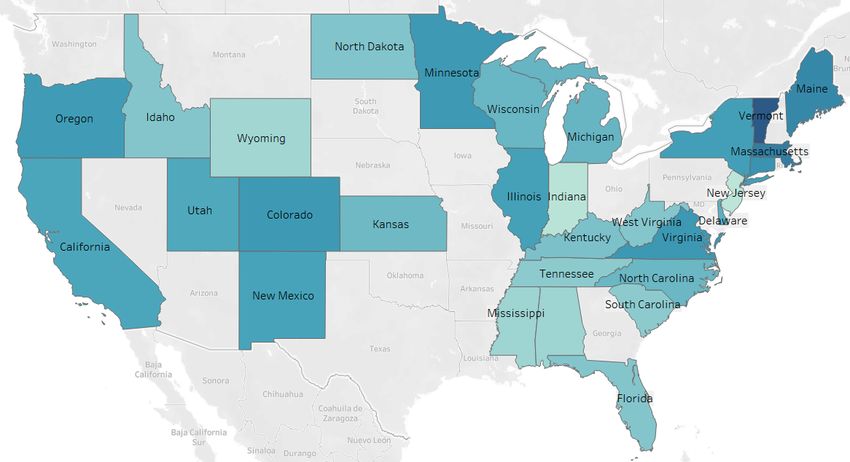
Source: COVID-19 Vaccine Summary – Coronavirus (virginia.gov) 155 to 11 First Dose Vaccination Rates by State (31/50 State Health Departments Reporting) Updated 1/5/22
State Uptake
Virginia has the 5th highest 5 to 11 first dose vaccination rates out of 31 reporting states Vermont 55.0%
• These data are self reported by state health departments, rather than the usual CDC data comparisons Massachusetts 42.0%
Maine 38.1%
Connecticut 34.0%
Virginia 32.4%
Minnesota 32.0%
Colorado 31.9%
Oregon 31.0%
New York 30.1%
Illinois 29.4%
New Mexico 28.5%
California 27.5%
Utah 26.8%
Delaware 23.8%
Hawaii 22.3%
Michigan 22.0%
Wisconsin 21.4%
North Carolina 21.0%
Kansas 20.1%
Kentucky 17.0%
North Dakota 15.6%
Florida 15.0%
Idaho 15.0%
West Virginia 14.9%
Tennessee 13.1%
South Carolina 13.0%
Alabama 9.1%
Mississippi 9.0%
Wyoming 8.1%
Indiana 3.1%
New Jersey 2.6%Virginia: Vaccination by Race/Ethnicity and Age Updated 1/5/22
Source: COVID-19 Vaccine Summary – Coronavirus (virginia.gov)
17Virginia: Vaccination across the Commonwealth by Geography Updated 1/5/22
Percent of the Total Population with at Least One Dose by
Locality First Dose Vaccination Rate by
Region for Total Population
1st Dose
Region Name
Vaccination
Central 67.4%
Eastern 71.3%
Northern 81.3%
Northwest 64.9%
Southwest 56.4%
• 10 out of 133 Localities have a first
dose vaccination rate below 50%
2013 SRHP Isserman Classification 5 to 11 12 to 17 16 to 17 18 to 30 31 to 50 51 to 64 65+ Grand Total • 30 out of 133 Localities have a first
Mixed Urban 36% 71% 76% 73% 73% 84% 87% 65% dose vaccination rate above 70%
Urban 33% 73% 79% 65% 77% 85% 96% 75%
Mixed Rural 23% 51% 58% 57% 63% 74% 83% 61% • There is a disparity across Urban
Rural 14% 42% 48% 51% 57% 70% 93% 74% and Rural areas by Age Groups, with
Grand Total 29% 65% 71% 63% 71% 80% 90% 71% Rural Adolescents the Lowest
Vaccinated group
Federal doses not included in this number
Source: COVID-19 Vaccine Summary – Coronavirus (virginia.gov) 18Virginia and Neighbors: Vaccination Rates Updated 1/5/22
At Least One Dose
> 80%
70-79.9% At Least One Fully
60-69.9% Dose* Vaccinated*
50-59.9% Nationwide 73.8% (+1.7%) 62.2% (+1.0%)
0.1-49.9% D.C. 89.2% (+2.9%) 67.8% (+1.3%)
0%
Kentucky 62.7% (+1.3%) 54.4% (+1.1%)
Maryland 80.8% (+1.6%) 70.6% (+1.0%)
North Carolina 77.1% (+3.4%) 56.9% (+1.2%)
Tennessee 59.0% (+1.2%) 51.5% (+1.0%)
Virginia** 79.5% (+1.8%) 68.2% (+1.0%)
West Virginia 62.2% (n/a) 55.2% (n/a)
*Total population, includes out-of-state vaccinations
**Differs from previous slide because all vaccination
sources (e.g., federal) are included
*** Green percent represents percent increase from
two weeks prior
Source: https://covid.cdc.gov/covid-data-tracker/#vaccinations
19You can also read