Two models for the control of sea lice infections using chemical treatments and biological control on farmed salmon populations - Population ...
←
→
Page content transcription
If your browser does not render page correctly, please read the page content below
Population Approach Group in Europe
              (www.page-meeting.org)
             Glasgow 11-14 June 2013

  Two models for the control of sea lice
infections using chemical treatments and
   biological control on farmed salmon
               populations
     George Gettinby

     Maya Groner
     Ruth Cox
     Crawford Revie

     Chris Robbins
                                              1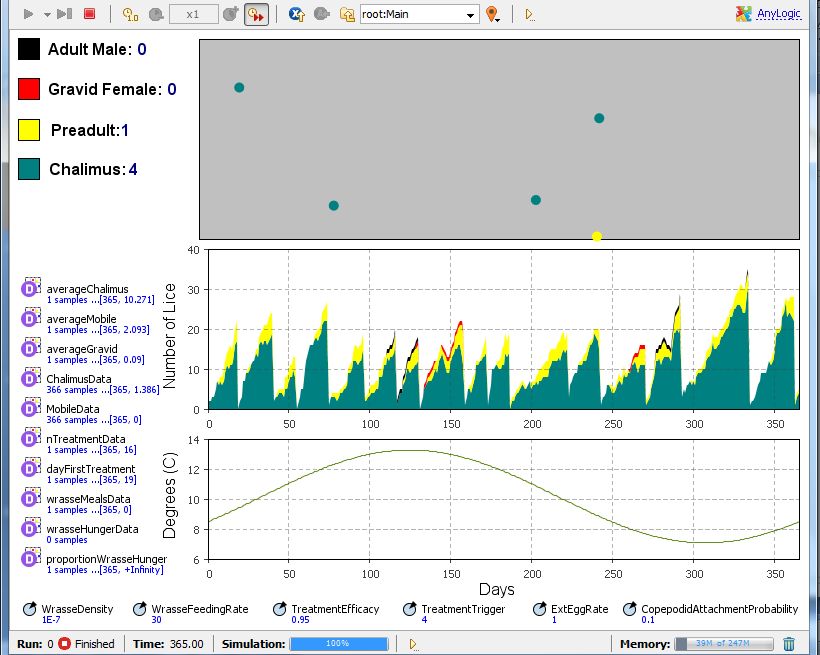
Salmon production - background
In Scotland 14 tonnes in 1971, 158000 tonnes
in 2012
Scotland’s largest food export and goes to
over 60 countries
Scotland's National Marine Plan is for 210000
tonnes by 2020
Other leading producers are Norway, Chile,
Canada, USA and Ireland
Major constraint is sea lice
2Sea lice - background
Parasitic copepods
Heavy infestation – fish health problems
Enormous cost to European, North and South
American salmon industries
treatment costs
mortalities
down-grade at harvest
poor growth / low Feed Conversion Ratio
Implications for wild salmon and sea trout
3Sea lice - species
Lepeophtheirus salmonis (Scotland, Ireland,
Norway, North America)
Caligus elongatus (multiple hosts)
Caligus clemensi (BC / western Canada)
Caligus rogercresseyi (Chile)
in Scotland L. salmonis C. elongatus
on farm external
re-infestation pressure
endemic epidemic
4Typical sea lice population growth on
European salmon farms
Abundance of mobile lice
25 L. salmonis
C. elongatus
Mean weekly abundance
20
15
10
5
0
1 Q1 Q2 26 Q3 Q4 51 Q1 Q276 Q3 Q4101
Year 1 Year 2
5Modelling the sea lice life-cycle
6First Model: Compartmental
population model for L. salmonis
Initially considered a ‘full’ 10-stage biological
model
Too complex, didn’t work, too many parameters
to fit, too many unknowns!
Simplified to 6 stages (chalimus, pre-adult,
adult, gravid female, egg, external infection)
7Population model simple structure
External
Infective
Pressure
Chalimus Pre-
I-IV Adult
Eggs and
Planktonic
Stages
Gravid Adult
Female
8Population model mathematical equations
dn1 t
R1 t R1 t 1 e b11 b1 t n1 t (1)
dt
dn 2 t
R 1 t 1 e b11 R 1 t 1 2 e b11 b22 b 2 t n 2 t (2)
dt
dn 3 t
R 1 t 1 2 e b11 b22 R 1 t 1 2 3 e b11 b22 b33 b 3 t n 3 t (3)
dt
dn 4 t (4)
R 1 t 1 2 3 e b11 b22 b33 b 4 t n 4 t
dt
n1 is the number of chalimus per fish, b1 is the mortality rate in the chalimus stage,
n2 is the number of pre-adult female per fish, b2 is the mortality rate in the pre-adult stages,
n3 is the number of adult female per fish, b3 is the mortality rate in the adult stage,
n4 is the number of gravid female per fish, b4 is the mortality rate in the gravid female stage,
t1 is the time spent in the chalimus stage, R1 is the population feedback and external source term,
t2 is the time spent in the pre-adult stages, h is the fraction of the pre-adult population that develop
t3 is the time spent in the adult stage, into females.
9Implementation of population model
for L. salmonis
SLiDESim (Sea Lice Difference
Equation Simulation)
Equations implemented in software with
estimated parameters for:
- development and mortality rates
- background infection pressure
- treatment timings and efficacy
10Making the SLiDESim model operational
11Using chemical and other treatments
to control sea lice infections
Hydrogen peroxide
Bath treatments – Excis (cypermethrin)
In-feed treatment – Slice (emamectin
benzoate)
Constraints: commercial and environmental
Use of synchronised treatment within area
management agreements
When and how often to treat?
Use Infection Pressure (IP) as measure of
effectiveness
12What the model predicts when using
FOUR Excis treatments i.e. treat in
weeks 42,48,69,75
70 42,48,69,75 - IP = 256.5 (Optimal)
39,54,69,85 - IP = 346.3
60
48,63,71,80 - IP = 541.6
50 National EXCIS average - IP = 330.5
40
IP
30
20
10
0
0 3 6 9 12 15 18 21 24
Month
13What the model predicts when using
FIVE Excis treatments i.e. treat in
weeks 39,46,64,78,87
70 39,46,64,70,87 - IP = 157.0 (Optimal)
43,50,65,70,87 - IP = 180.3
60
46,52,64,70,85 - IP = 203.3
50 National EXCIS average - IP = 330.5
40
IP
30
20
10
0
0 3 6 9 12 15 18 21 24
Month
14Results from compartmental modelling
You can find effective combinations of
treatment numbers and timing for different
compounds
You can carry out multifactorial investigations
You cannot easily include stochasticity
You cannot easily include water temperature
effects and stage development
You cannot easily include pulses of external
infections
You cannot easily adapt to new ways of
controlling sea lice
15Sea lice - the use of cleaner fish
Bay
Management
Areas
Monitoring, Chemical
reporting Treatments
Decrease
sea lice
Coordinating Fallowing
salmon
cohorts
Wrasse
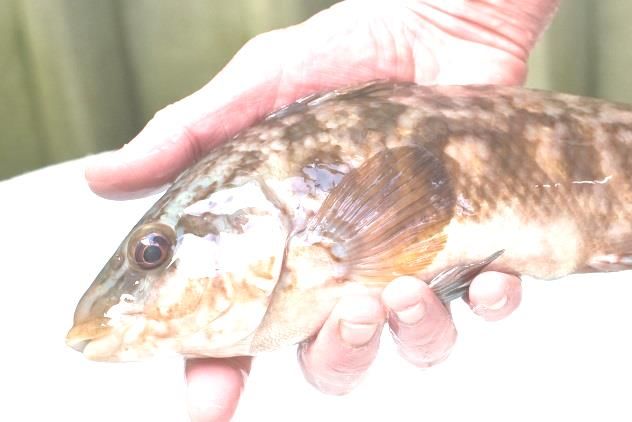
16Sea lice - the use of “cleaner” fish
Increasing use of wrasse
Interest in Norway, Ireland, Scotland and
Atlantic Canada
In 1990s 1 wrasse per 50 salmon. Currently 1
wrasse pre 25 salmon. Trials undergoing on 1
wrasse per 10 salmon.
Increasing use of wrasse on salmon production
units in Norway and Ireland with development
of wrasse aquaculture
Photo: Alan Dykes
17Second Model: Individual-Based Model
formulated in Anylogic
18Development and survival of lice
depends on water temperature
15
1996
14
1997
13
1998
12
1999
11
0C
Sine Curve
10 0C
9
8
7
6
0 13 26 39 52
Weeks
19Individual-Based Model formulated in
Anylogic
Effect of temperature on stage development
and survival based on meta-analysis by Stein
et al 2005
Fish inspected weekly and if mobiles exceed
a limit e.g. 4 lice per fish then a chemical
treatment applied
Treatment effectiveness flexible e.g. 95%
Wrasse predate at a constant rate e.g. 30 lice
per day
Ratio of wrasse to salmon flexible e.g. 1:200,
1:100, 1:50, 1:25, 1:10, 0
20Results for low reinfection and high
external infection
http://www.runthemodel.com/models/k-oketzEcHJltLMX4KZ5Zs/External
infection
Low = 0.1 lice/ day
High = 1 lice/day
Reinfection
Low = 10% of
copepodids find a host
High= 100% of
copepodids find a hostResults for low reinfection and high external
infection at different wrasse ratios
No control of sea lice
Wrasse: Salmon 1:50
Treated if mobiles > 4 lice
15
treatments
required
Treated if mobiles > 4 lice and Wrasse: Salmon is 1:50
10
treatments
required
Time (days)Individual-Based Model findings
Individual- based models are useful for
mimicking complex, stochastic processes with
dynamic and pulsed effects
Cleaner fish have the potential to reduce the
average number of chemical treatments in
salmon production systems
Wrasse can be effective at controlling
infestations that arise from both external and
internal sources
24Finally… which model is better -
Compartmental Population or Individual-
Based ?
“errors using inadequate data are much less
than those using no data”
Charles Babbage (1792-1871)
“essentially, all models are wrong, but some are
useful.”
George Box (1919-2013)
“The purpose of models is not to fit the data
but to sharpen the questions.”
Samuel Karlin (1924-2007)
25Acknowledgements
Funding:
DEFRA (Link ENV12; VM02134)
Industrial / Research support:
Marine Harvest (Scotland) Ltd / Nutreco Aquaculture
(Chris Wallace / Gordon Ritchie)
Grallator Modelling, Simulation & Software
(Chris Robbins)
Scottish Association for Marine Science
(Jim Treasurer)
NVI, Oslo, Norway
National Veterinary
Institute
26You can also read