VITAL METALS TO SUSTAIN AN URBANIZING PLANET - COMING SOON: 8 BILLION OF US - ROBERT FRIEDLAND - CLEAN TEQ
←
→
Page content transcription
If your browser does not render page correctly, please read the page content below
Vital metals to sustain
                         an urbanizing planet
                            Coming soon: 8 billion of us.

ROBERT FRIEDLAND
Co-Chair & Non-Executive Director
“RAPID URBANIZATION IS LIKELY TO CONTINUE FOR DECADES” – WORLD BANK, EAST ASIA REPORT, JANUARY 2015. AN AGE OF UNPRECEDENTED CHANGE, WITH PROFOUND IMPLICATIONS FOR METALS MARKETS, MINERS AND INVESTORS.

In 2007, the people on earth crossed a historic divide.
 There was no Big Bang in the middle of the night. But, say UN number
 crunchers, 2007 is when we first had more people around the planet
 living in urban areas than in rural areas. Get used to it.
 Urbanization – with its demands and opportunities – is inexorable.

Source: United Nations
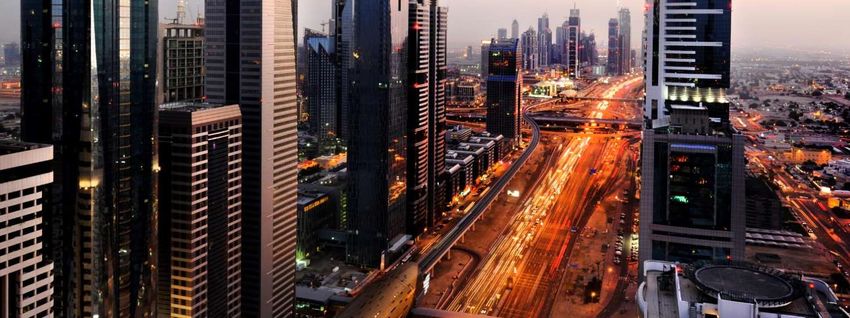
Our world is gaining about 83 million people every year.
  By 2030, Earth will have a projected 8.5 billion people.
  About 5 billion are expected to live in urban areas.
  That would total 1 billion more urban residents
  than we have today.
    Shanghai’s emergence as one of the world’s super-cities was assured
    when its population virtually tripled, to 23 million, between 1990 and 2010.

1990                                      2010

Source: United Nations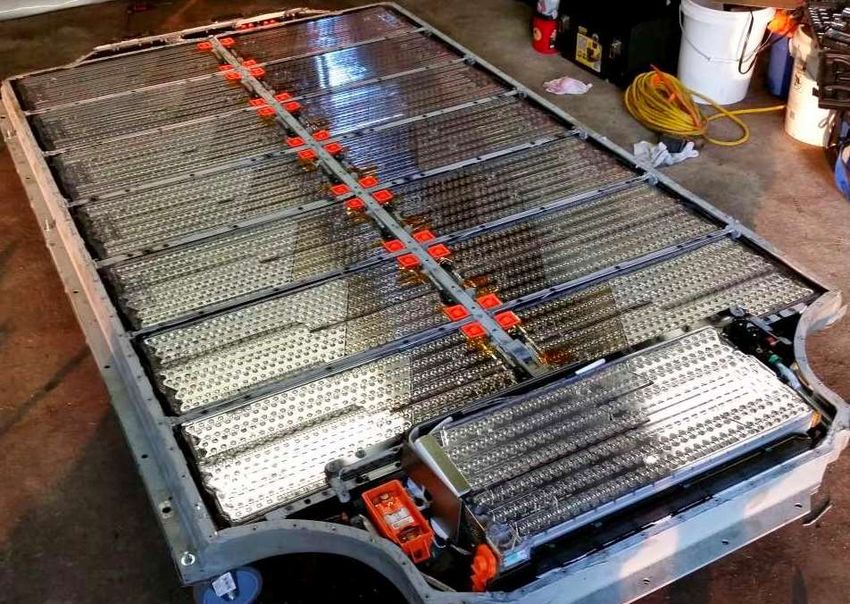
By 2050, 6.3 billion people could live in urban areas.
 That would be around 2.5 billion more than today.
  Today’s top 4 megacities
  (each with more than 10 million people)

                                                    2. Delhi: 1990, 9.7 million; 2014, 24.9 million;
                                                    2030 (est.), 36.0 million.
1. Tokyo: 1990, 32.5 million; 2014, 37.8 million;
  2030 (est.), 37.1 million.

3. Shanghai: 1990, 7.8 million;
   2014, 22.9 million; 2030 (est.), 30.7 million.
                                                           4. Mexico City: 1990, 15.8 million;
                                                              2014, 20.8 million;
                                                              2030 (est.), 23.8 million.
Sources: United Nations; Wikipedia.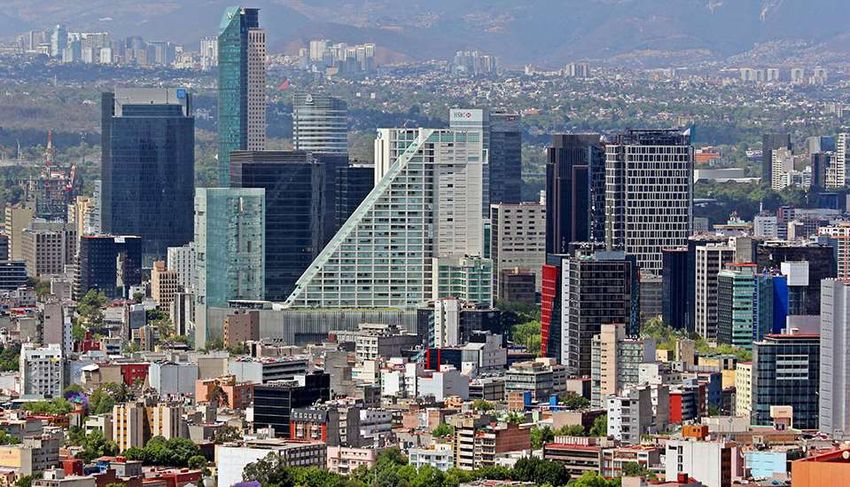
56% of China’s people lived in urban centres in 2015.
   It was just 26% in 1990 – then doubled, to 51%, in 2011.
    Urban projections: 60% in 2020 (with 100 million people
    moving to cities) and rising further to 76% in 2050.

                   China’s megacities (10m+)    2014 population
                               Shanghai           22.9 million
                                Beijing           19.5 million
                              Chongqing           12.9 million
                         Guangzhou, Guangdong     11.8 million
                                Tianjin           10.8 million
                              Shenzhen            10.6 million

 Chongqing on the Yangtze

Source: United Nations
A high price: Sickened cities
Toxic smog clouds future of urbanizing Earth
Outdoor air pollution linked to 3 million deaths each year.
 – International Energy Agency, June 2016

Ambient air pollution is the greatest environmental risk to health.
 – UN World Health Organization, May 2016

More than 80% of inhabitants of urban areas are exposed
to unsafe levels of air pollution.
 – Professor Stephen Hawking, June 2016

Air pollution deaths cost the global economy $5 trillion annually.
 – World Bank, August 2016

                         From Asia…to the USA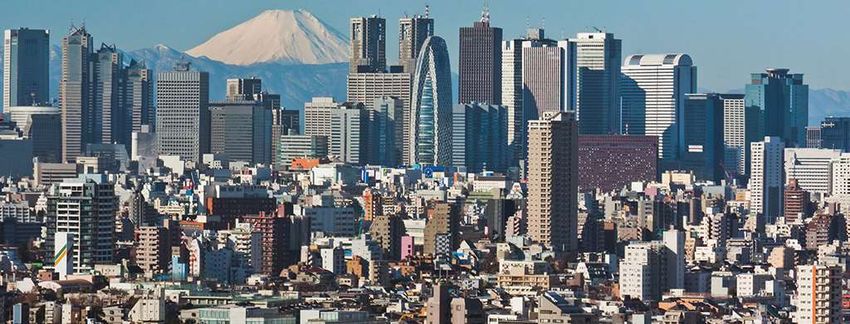
Survival masks: Grim fashion statements
 share public stage with industrial safety gear
 Successions of sickly, smoggy days, with very high levels of harmful
 airborne particles generated largely by heavy industry and motor
 vehicles, have spawned new markets for mask makers.

 One reported estimate put the value of China’s booming mask market
 at US$600 million in 2015.

Panda sighting                        Beijing bus stop

                            China

                                                                        AP
Humans are vulnerable to air pollution
seeping into the bloodstream and brain
The miniscule size of particles are less likely to be trapped by hairs
and the mucus that line our noses – our body’s natural barrier.

                                                Sources: US EPA, BBC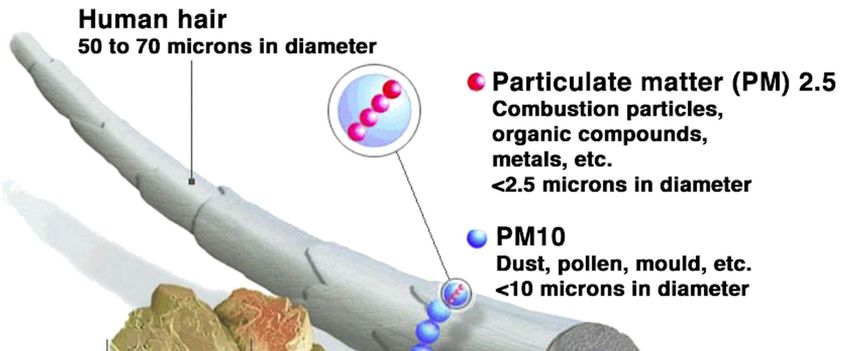
92% of the world’s population lives with outdoor
air quality that fails to meet WHO guidelines
Map by World Health Organization showing annual concentration of PM2.5
(micron/m3).

                               China

PM2.5 includes pollutants such as sulfate, nitrates and black carbon, which penetrate
deep into the lungs and cardiovascular system, posing the greatest health risks.
                                                                                        AP
Airpocalypse: Scenes of an urban scourge
“Mexico City’s smog is so bad, “Paris institutes weekday ban
it wants 40 percent of cars on cars built before 1997
to stay off the road” in battle against air pollution”
2 May 2016 2 July 2016
Photo: Ronaldo Schemidt/AFP/Getty Images Photo: ReutersAirpocalypse…
“A 2017 program would charge “New Delhi begins second
£10 pounds ($13) to the most round of car restrictions
polluting vehicles entering to limit air pollution”
central London” 15 April 2016
5 July 2016
Photo: John Esslinger Photo: Hindustan Times/GettyDisruption can happen quickly.
It’s 1900: Can you spot the car?
5th Avenue, NYC, April 15, 1900
Source: Tony Seba, US National ArchivesDisruption did happen – and quickly.
Now it’s 1913: Can you spot the horse?
Source: Tony Seba, from US National Archives 5th Avenue, NYC, March 23, 1913
(7 months later, Ford revolutionized auto making with the industry’s first moving
assembly line, slashing a Model T’s building time to 93 minutes from 12.5 hours.)Around 400,000 would-be buyers said to have paid US$1,000 deposits for 2017’s Tesla 3 all-electric car Unprecedented worldwide market enthusiasm generated 115,000 paid reservations even before the car was unveiled last March. Within a month, orders had more than tripled. Tesla 3 could become the most successful electric-car launch in automotive history. (U.S. electric & hybrid registrations totalled 116,000 in 2015; Japan, 25,000; Britain, 28,000.) Price US$35,000; range 346 km (215 miles); 5-seater; 0-97 km (0-60 mph) in 6 seconds. Highly advanced, efficient, copper induction motors, with copper rotors (inset).
VW repents (and pays) after lying to consumers
 & regulators over tailpipe emissions & fuel usage
   “We’ve totally screwed up,” admitted VW’s U.S. CEO Michael Horn
   during the company’s Dieselgate crisis (he resigned in March 2016).
   Part of the price of deception: US$14.7 billion – a record penalty
   in the auto world. The limited settlement, covering just the U.S.,
   was approved by a U.S. court on October 25.
                                            Payments will cover vehicle buybacks,
                                            compensation for owners and infrastructure
                                            support for zero-emission vehicles.

                                            VW’s earlier U.S. settlements total an additional
                                            $1.8 billion; pending U.S. actions could cost billions
                                            more. And then there’s the rest of the world…
                               (Wikiwand)

A 2010 VW “Clean Diesel”: A cheater
in green disguise at a U.S. auto show.
A “defeat device” fitted to 11 million VW
and Audi diesel vehicles over 6 years
reduced emissions during testing but
then released up to 40 times more
nitrogen oxide during real-world driving.
Cobalt Sulphate (CoSO4.7H2O) & Nickel Sulphate
(NiSO4.6 H2O) at heart of lithium battery technology
Hybrid & all-electric vehicles use 200% to 300%
more copper than conventional gasoline-powered autos
Lithium battery core
Layers of:
Copper foil used in lithium batteries
Copper
Lithium cobalt
oxide
Plastic
Graphite
Lithium nickel
oxide
Photos: National Geographic; GM.Inside Tesla’s Model S batteries Tesla battery pack weighs 540 kg, equal to about 26% of the car’s total weight Photo: Tesla Motors club user [wk057]. Figure: visualcapitalist.com
Each new generation of car
   needs more copper wiring

                    165 lbs. / 75 kg
                                                                   Electric BMW i3

          110 lbs. / 50 kg
                                                          Hyundai Hybrid

    55 lbs. / 24 kg
                                            Ford Mustang V8
Sources: Visual Capitalist; U.S. Global Investors
SYERSTON PROJECT
NICKEL AND COBALT
SULPHATE
FOR THE LITHIUM-ION
BATTERY INDUSTRY
AGM, 22 NOVEMBER 2016
(ASX:CLQ)DISCLAIMER
IMPORTANT INFORMATION
This presentation has been prepared by the management of Clean TeQ Holdings Limited (the ‘Company’) in connection with meetings with
investors and potential investors and not as specific advice to any particular party or person. The information is based on publicly available
information, internally developed data and other sources. Where any opinion is expressed in this presentation, it is based on the assumptions
and limitations mentioned herein and is an expression of present opinion only. No warranties or representations can be made as to the origin,
validity, accuracy, completeness, currency or reliability of the information. The Company disclaims and excludes all liability (to the extent
permitted by law) for losses, claims, damages, demands, costs and expenses of whatever nature arising in any way out of or in connection
with the information, its accuracy, completeness or by reason of reliance by any person on any of it.
Certain statements in this presentation are forward looking statements. By their nature, forward looking statements involve a number of risks,
uncertainties or assumptions that could cause actual results or events to differ materially from those expressed or implied by the forward
looking statements. These risks, uncertainties or assumptions could adversely affect the outcome and financial effects of the plans and events
described herein. Forward looking statements contained in this presentation regarding past trends or activities should not be taken as
representation that such trends or activities will continue in the future. You should not place undue reliance on forward looking statements,
which apply only as of the date of this presentation.
Actual results and developments of projects and nickel, cobalt and scandium market development may differ materially from those expressed
or implied by these forward looking statements depending on a variety of factors.
This presentation does not constitute or form part of any offer or invitation to sell, or any solicitation of any offer to purchase any shares in the
Company, nor shall it or any part of it or the fact of its distribution form the basis of, or be relied on in connection with, any contract or
commitment or investment decisions relating thereto, nor does it constitute a recommendation regarding the shares of the Company. Past
performance cannot be relied upon as a guide to future performance.
Please refer to the back of this presentation for information concerning the calculation of reserves and resources referred to herein, and the
consents provide the respective Competent Persons.
For further details on the content of this presentation, please refer to the ASX releases on the Company’s website.
SYERSTON PA G E 2WHAT WE PLAN TO DO
FOCUS IS GLOBAL ENERGY AND TRANSPORTATION MARKETS
Develop one of the world’s largest sources of high-purity cathode raw
materials for the global lithium-ion battery industry
Build the world's first scandium mine to service the transport sector’s need for
lighter and stronger aluminum alloys
Use our ion-exchange processing capability to extract metals at lower cost,
more sustainably and with better environmental outcomes
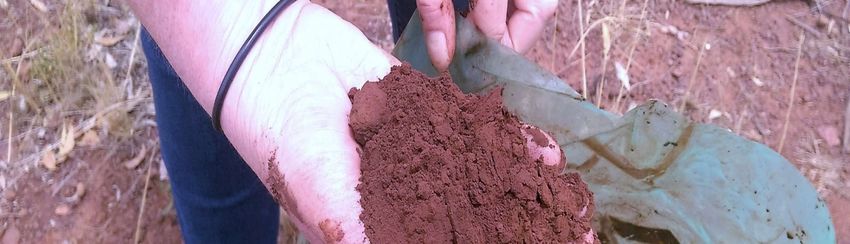
SYERSTON PA G E 3SYERSTON ORE
SYERSTON PROJECT
OVERVIEW
The Syerston Project is a laterite (iron-hosted) mineral resource, rich in nickel, cobalt and scandium,
located 350km west of Sydney and 100% owned by Clean TeQ
Uniquely positioned as one of the largest and highest grade sources of cobalt outside Africa
Syerston will be the first mine developed to exclusively supply the global lithium ion battery industry with
high-purity nickel and cobalt sulphate, the key raw materials in the production of battery cathodes
SYERSTON PA G E 4LiB MARKET SYERSTON PA G E 5
LITHIUM ION BATTERY MARKET
       GROWTH FORECASTS VARY WIDELY BUT ARE SUBSTANTIAL

                                                                          Historic and Forecast Global LiB Sales (GWh)
                                                                      Phones & Portable PCs               Other (Non-Auto)             Automotive

                                                                                                                                                   193
                                                                     Other forecasts:
       20% CAGR in LiB sales over last decade                        Credit Suisse:
                                                                     294 GWh by 2025

Auto industry interest in EVs has now reached a                      Goldman Sachs:
                                                                     386 GWh by 2025                                       127
                              crucial tipping point
                                                                     Benchmark Minerals:
                                                                     500 GWh by 2025
     Forecasts vary considerably but all support
                                                                     Deutsche Bank:
               strong growth, especially in EVs                      535 GWh by 2025                   56

                                                                                   23
                                                               10

                                                              2005                 2010                2015                 2020                   2025

                                                           Source: Avicenne Energy Analysis 2014, internal estimates. Avicenne estimates include
                                                           China Auto Upside case.

                                                      SYERSTON        PA G E 6
EV SALES FORECASTS
DRIVETRAIN ASSUMPTIONS ARE KEY
Forecast Global x-EV Sales (2014 – 2025)
Fundamental to raw material forecasts are the
adoption rates for each drivetrain
BEV Sales Forecasts:
Deutsche Bank:
Drivetrain Battery Size per EV 3.0m BEV pa by 2025
HEV ~1kWh Avicenne Upside Case:
PHEV ~12kWh 2.6m BEV pa by 2025
BEV ~45-90kWh Goldman Sachs:
4.0m BEV pa by 2025
Consumer acceptance of BEV is strong, with UBS:
6.0M BEV by 2025
BEV’s comprising 60% of total global EV sales
in 20151
Pending emissions and fuel efficiency
regulations
Government subsidies are also driving EV
demand, particularly in China
1. OECD/IEA, Global EV Outlook 2016 Source: Deutsche Bank research, 2016
SYERSTON PA G E 7CHINA’S EV DEMAND
IMPACT OF GOVERNMENT SUBSIDIES
China Sales of Alternative Energy Passenger Cars (units)
2014 2015
60,000
Subsidies are prioritised for EV’s with higher 50,000
battery capacity and greater efficiency
40,000
There is also significant investment in urban
and regional charging infrastructure 30,000
There will be a progressive unwinding of
20,000
consumer subsidies between 2016 and 2020,
because…..
10,000
0
BYD Zotye Kandi BAIC Chery SAIC JAC Geely JMC DENZA
Source: China Passenger Cars Association (CPCA), listing top 10 producers only
SYERSTON PA G E 8..BATTERY COSTS ARE FALLING RAPIDLY
EXPERIENCE CURVE EFFECTS
Battery Costs Falling – Economies of Scale Cost Trajectory – ICE vs EV
SYERSTON PA G E 9EV GOING MAINSTREAM
NOT JUST A TESLA STORY
London -- BMW plans to accelerate its electric vehicle plans, in the wake of an executive shake-up and leading into a
vote planned for the end of this month. The new BMW expanded electric line-up will kindle fully battery-powered
versions of the Mini, the BMW 3 Series and the X4 SUV.
The Volkswagen Group plans to launch over 30 Darrell Etherington, 11 September, 2016, Tech Crunch
fully electric new vehicles by 2025.
“We expect that by then we will be selling about
2 to 3 million pure-electric automobiles a year.
This will account for a significant share – an
estimated 25 percent – of our total sales Ryan Beene, 29 September, 2016, Drive
volume. We are stepping up our efforts
accordingly and will launch a multi-billion euro
investment program,“
- Matthias Müller, CEO Volkswagen, June 2016 Jake Spring, 21 July 2016, Reuters
Christiaan Hetzner, 1 June 2016, Automotive News
SYERSTON PA G E 1 0A RACE TO SECURE RAW MATERIALS
CHINA’S AMBITIONS FOR A STRATEGIC INDUSTRY
A steady stream of acquisitions Cathode Material Market Share (percentage)
Year Asset Purchaser Focus Price
2010 Olaroz Toyota Tsusho / Li US$62M + PF China Japan Korea Other
(ARG) JOGMEC + Comp. Gtee
2012 Greenbushes Chengdu Tinaqui Li A$815M
(AUS) – 100%
11.1 10.6 10.9
2012 Ruashi Jinshuan Co / Cu US$1,300M
(DRC) 11.0 9.6
12.4
2014 Greenbushes Rockwood Lithium Li US$474M
(AUS) – 49%
2015 CMSK Huayou Cobalt Co / Cu US$52M 25.7 24.3
(DRC) 27.7
2015 Mt Marion Jiangxi Ganfeng Li US$46.6M
(AUS)
2016 Tenke (DRC) – China Molybdenum Co / Cu US$2,650M
56%
2016 Kokkola China Molybdenum Co US$150M
(Finland)/ 52.7 55.2
48.8
Kisanfu (DRC)
2016 SQM – 2.1% Tianqui Lithium Li US$210M
2017 Altura Mining Shaanxi J&R Li A$42M
(AUS) – 20% Optimum Energy
2012 2013 2014
Source: KDB Daewoo Securities, 2015
SYERSTON PA G E 11SANYO, JAPAN, 2010 NISSAN, USA, 2013 TESLA, USA, 2017
INVESTMENT IN NEW BATTERY CAPACITY IS LARGE AND REAL
SAMSUNG, CHINA, 2015 LG CHEM, CHINA, 2015 LG CHEM, USA, 2013-15
Between 2011 and 2014 ~US$10-12B was invested in new battery capacity, adding ~50GWh
Between 2014 and 2017 another ~US$7B will be invested
With increasing scale, capital intensity is forecast to fall from ~$250/kWh to $150/kWh
Key question: what is the impact of this growth on raw material demand and supply?
Source: Avicenne Energy Analysis, 2014
SYERSTON PA G E 1 2CATHODE MARKET
SYERSTON PA G E 1 3CHEMISTRY BY MARKET
DOMINANT CHEMISTRIES FOR EV REQUIRE NICKEL AND COBALT
39% 22% 11% 19% 9%
41ktpa 23ktpa 12ktpa 20ktpa 9ktpa
LCO NCM NCA LMO LFP
(Lithium-Cobalt-Oxide) (Nickel-Cobalt-Manganese) (Nickel-Cobalt-Aluminium) (Lithium-Manganese-Oxide) (Lithium-Iron-Phosphate)
Still one of the highest Experiencing fastest Extremely high energy Relatively low energy Reasonable energy
energy density growth with a good mix of density, power and density (one-third of density but lower power;
chemistries, but expect to energy density, power, manufacturing experience LCO), but the absence of lower cost raw materials
see only steady growth as cost and safety for make it a good candidate cobalt makes this a low- are offset by poor
automotive and utility- automotive applications; for automotive, such as cost alternative cathode conductivity and higher
scale applications grow new chemistries the A18650 material unit costs from assembly
constantly developing process
Source: Avicenne Energy Analysis 2014
SYERSTON PA G E 1 4CATHODE – THE KEY TO COST
NICKEL AND COBALT PRICES DRIVE CELL COST
Raw Materials Manufacturing Costs Producer Margin Raw Material Cost Breakdown Metal Cost in Cathode Active Material
100% 100%
Housing and
feedthrough Lithium ~4% of total
cell cost
5% 80%
Separator
80%
Manganese
Electrolyte Cobalt
60% 60%
US$23/cell 58% Anode
(~US$240/kWh) 40% 40% ~20% of total
37%
cell cost
Nickel
Cathode
20% 20%
0% 0%
Source: Roland Berger (2012) and internal analysis. Assumes a 96Wh PHEV cell (26Ah, 3.7W) using NCM622 cathode chemistry. Cathode cost includes non-metallic materials (carbon
black, binder, foil). Internal assumptions concerning split of costs assumes average long-term prices of Ni US$7.00/lb; Co US$12.00/lb; Mn US$1.00/lb; Li US$6.50/kg (as LCE).
SYERSTON PA G E 1 5“The main determinants on the cost of
the cell are the price of the nickel in the
form that we need it … and the cost of
the synthetic graphite with silicon oxide
coating.”
Elon Musk, Tesla CEO
NICKEL & COBALT
SULPHATE
EV CATHODE REQUIRES SULPHATE
METAL UNITS ARE REPROCESSED TO CHEMICAL FORM
The battery industry requires metal supplied in chemical form to manufacture its cathode precursors
Currently, that requires final (or intermediate) Ni and Co metal units to be reprocessed to produce hydrated
nickel and cobalt sulphate products
The cost of converting metal units to sulphate form is often represented in the market price by a ‘sulphate
premium’ paid over and above the contained metal value
SYERSTON PA G E 1 6CATHODE DEMAND FORECAST
IMPLICATIONS FOR RAW MATERIAL DEMAND
Cathode Raw Material Demand (‘000 tonnes)
LCO NCM NCA LMO LFP
560
18% CAGR
If NCM and NCA chemistries dominate for EV’s, Contained Metal:
then Ni and Co are key raw materials Nickel: ~142ktpa
Cobalt: ~90ktpa
Anode (C): ~385ktpa
Of the 10 top selling Chinese EV’s using LFP LCE: ~220ktpa
chemistry, 6 are already converting to NCM
Contained Metal:
Nickel: ~14ktpa
Significant new mines, like Syerston, will need Cobalt: ~29ktpa
to be developed to provide the battery industry Anode (C): ~80ktpa
105
with sufficient raw materials LCE: ~35ktpa
2015 2025
Source: 2015 data based on Avicenne Energy Analysis. 2025 case based on internal company estimates, utilising an
EV adoption rate based on the average from five banks and industry consultant forecasts: HEV 5.7m, PHEV 2.7m,
BEV 3.6m. EV applications forecast at 215 GWh. Non-EV applications forecast at 135GWh. Assumes an average
battery size of 50kWh/BEV.
SYERSTON PA G E 1 7SYERSTON PROJECT
SYERSTON PA G E 1 8WHY SYERSTON IS IMPORTANT
PROTECTION AGAINST SUPPLY CHAIN AND REPUTATION RISK
100% auditable High volume
raw materials cathode quality
supply chain CoSO4.7H2O
Low risk country
High volume Sc2O3 for light-
with minimal
cathode quality weighting in
mining and
NiSO4.6H2O transport
processing risk
SYERSTON PA G E 1 9VALUE DRIVERS
LARGE, LOW-COST AND READY
1 2 3 4
RESOURCE COBALT ACID CLEAN-iX®
A shallow, multi-decade High grade cobalt, in a Low acid consumption, Highly selective mineral
resource with low strip safe mining jurisdiction reducing operating costs extraction provides a
ratio and low operating and 100% auditable back significantly direct processing route to
costs to the mine source battery-grade sulphate
materials
SYERSTON PA G E 2 0MINERAL RESOURCE
LOW MINING RISK
Over 1,300 drill holes to define a significant nickel /
cobalt / scandium resource
The resource is shallow (5m to 40m) and extends over a
2km horizon; simple and low risk strip-mining
Mining accounts for ~20% of total average operating
costs
A high-grade scandium resource to the NW provides the
option to develop a dedicated scandium mine
NICKEL MINERALISATION
SYERSTON PA G E 2 12016 PREFEASIBILITY STUDY
LARGE, LOW-COST AND WITH HIGH COBALT CREDITS
26-28
GWh p.a.#
500,000
Electric Vehicles p.a.*
Definitive Feasibility Study due for
completion in Q4 2017
Significant scandium credits modelled
separately
# Assumes NCA chemistry with Ni and Co content by wt% within cathode active
material of 48% and 9% respectively, and energy density at 1.39kg/kWh
* Assumes average energy density per battery pack of 50kWh
SYERSTON PA G E 2 2COBALT
A PROBLEMATIC SUPPLY CHAIN “The majority of the cobalt is
heading straight to China. Their
global hold is huge.”
- CRU 2016
Percentage of cobalt produced globally as by-product from
95% copper and nickel mining
Percentage of global cobalt production sourced from the
65% Democratic Republic of Congo
Year-on-year increase in Chinese imports of cobalt raw
30% materials in 2015
Source: Darton Cobalt Market Review 2015-2016
SYERSTON PA G E 2 3PHOTO CAPTION
CHILDREN MINING COLTAN, KIVU REGION, DRC
“While the occasional [analyst] questions the availability of enough lithium or flake graphite to
satisfy soaring demand from the battery industry, everybody has overlooked or ignored the most
critical mineral constraint – Cobalt. It’s a truly gargantuan challenge. A Gigarisk!”
- investorintel.com, March 2016
SYERSTON PA G E 2 4COBALT
HIGH GRADES AND LARGE PRODUCTION VOLUMES
Undeveloped Cobalt-Bearing Nickel Projects (excl Africa and seabed mining)
Cobalt Grade vs Contained Co Resource
Syerston represents one of the best
undeveloped cobalt resources in the
world outside central Africa
Twenty-year average feed grade to
autoclave of 0.14%, with the first ten
years averaging ~0.2%
Cobalt is a significant co-product
revenue stream, circa 25%
Scandium is expected to progressively
add value as the market is developed
Source: SNL global database. Comparator group comprises undeveloped nickel projects with
declared cobalt resources, excluding African and seabed mining projects. Figures represent latest
reported resources (inclusive of reserves) of cobalt. Syerston figures based on Updated Resource
Estimate to JORC 2012.
SYERSTON PA G E 2 5ACID
LOWER ACID CONSUMPTION = LOWER OPERATING COST
Acid Consumption
600
Syerston is forecast to consume less
H2SO4 consumption range, kg / tonne ore
500
acid than existing operating HPAL nickel
mines today 400
Mineralogy is low in acid-consuming
300
elements, such as Ca and Mg
At Syerston a reduction of acid 200
consumption of 100-150kg/tonne
reduces opex by 10-15% 100
0
Comparators Syerston
Comparator analysis taken from public data relating to operations such as Moa (Cuba), Goro (New
Caledonia), Coral Bay (Philippines), Murrin Murrin (Australia), Ravensthorpe (Australia), etc.
Syerston data based on extensive historic hydrometallurgical and leaching test work.
SYERSTON PA G E 2 6CLEAN-IX®
FIT FOR PURPOSE FLOWSHEET
The metal-rich The extracted
solution is injected metals are then put
into a Clean-iX® through a
Resin-in-Pulp purification circuit to
system where the produce high purity
leachate contacts nickel sulphate,
with polymer resins cobalt sulphate and
scandium oxide
An ionic charge on
the resin selectively
Crushed ore is Acidic waste is then
attracts the metals
leached with acid in neutralised and
to the surface of the
a HPAL vessel to placed in a tailings
resin – the resins
move the metals into facility for storage
are then removed,
solution
cleaned, and
recirculated
SYERSTON PA G E 2 7CLEAN-IX®
SULPHATE FROM PRIMARY EXTRACTION
Nickel Concentrate Low Nickel High Nickel Matte High Concentration
PYROMETALLURGY
Ore
Matte Nickel Solution
NiSO4
Beneficiation Smelting Converter Dissolution Purification /
SX
Ore Leach Low Concentration Mixed Sulfide High Concentration Nickel NiSO4 +
Slurry Nickel / Cobalt Solution Product / Cobalt Solution CoSO4
HPAL CCD Precipitation Dissolution Purification /SX
HYDROMETALLURGY
Ore Leach High Concentration Nickel NiSO4 +
Slurry / Cobalt Solution CoSO4
HPAL Ion Purification /
Exchange SX
SYERSTON PA G E 2 8NEXT STEPS
SSY
Y EER
RSS TO
T ON
N PA
PA G
GEE 2299PROJECT IS DEVELOPMENT READY
KEY PERMITTING COMPLETED
STUDIES INFRASTRUCTURE EIS POWER & GAS WATER
Prefeasibility Study All key infrastructure is Environmental Impact Power and gas are The Project has a
completed, with available, including Statement completed within close proximity 3.2GLpa water
Bankable Feasibility road and rail access and approved by to the Project allocation granted by
Study due for Government the NSW Government
completion in Q4
2017
SYERSTON PA G E 3 0PILOT PLANT
SYERSTON
OVERVIEW
Clean TeQ has a large scale pilot plant located in Perth, Western Australia to simulate the entire leaching and RIP
extraction process at scale
A pilot campaign in October 2016 to process 20 tonnes of Syerston ore will produce nickel and cobalt sulphate
samples for customer sampling and testing
SYERSTON PA G E 3 1INVESTMENT TAKEAWAYS
A large High grade
Geared to PFS
resource with cobalt in a safe Key
emerging EV demonstrates
decades of mining permitting in
and ESS robust
production jurisdiction and place
growth economics
capacity 100% auditable
SYERSTON PA G E 3 2RESERVES AND RESOURCES
COMPETENT PERSON CONSENTS
The information in this document that relates to nickel-cobalt Mineral Resources is based on information compiled by Diederik Speijers and John McDonald,
who are Fellows of The Australasian Institute of Mining & Metallurgy and employees of McDonald Speijers. There was no clear division of responsibility
within the McDonald Speijers team in terms of the information that was prepared – Diederik Speijers and John McDonald are jointly responsible for the
preparation of the Mineral Resource Estimate. Diederik Speijers and John McDonald have sufficient experience that is relevant to the style of mineralisation
and type of deposit under consideration and to the activity which they are undertaking to qualify as Competent Persons as defined in the 2012 Edition of the
‘Australasian Code for Reporting of Exploration Results, Mineral Resources and Ore Reserves’. Diederik Speijers and John McDonald, who are consultants
to the Company, consent to the inclusion in the report of the matters based on their information in the form and context in which it appears.
The information in this document that relates to scandium Mineral Resources is based on information compiled by Sharron Sylvester, who is a Member and
Registered Professional of the Australian Institute of Geoscientists and is an employee of OreWin Pty Ltd. Sharron Sylvester has sufficient experience that is
relevant to the style of mineralisation and type of deposit under consideration and to the activity which she is undertaking to qualify as a Competent Person
as defined in the 2012 Edition of the ‘Australasian Code for Reporting of Exploration Results, Mineral Resources and Ore Reserves’. Sharron Sylvester, who
is a consultant to the Company, consents to the inclusion in the report of the matters based on their information in the form and context in which it appears.
The information in this document that relates to Ore Reserves is based on information compiled by Michael Ryan, MAusIMM (109558), who is a full time
employee of Preston Valley Grove Pty Ltd, trading as Inmett Projects. Michael Ryan has sufficient experience that is relevant to the style of mineralisation
and type of deposit under consideration and to the activity which he is undertaking to qualify as a Competent Person as defined in the 2012 Edition of the
‘Australasian Code for Reporting of Exploration Results, Mineral Resources and Ore Reserves’. Michael Ryan, who is a consultant to the Company,
consents to the inclusion in the report of the matters based on his information in the form and context in which it appears. Michael Ryan holds options in
Clean TeQ Holdings Limited, the ultimate parent entity of Scandium21 Pty Ltd, the owner of the Project.
For further details on the content of this presentation, please refer to the ASX releases on the Company’s website.
SYERSTON PA G E 3 3CONTACT
Sam Riggall
Co-Chairman & CEO
Clean TeQ Holdings Limited
12/21 Howleys Road
Notting Hill VIC 3168
AUSTRALIA
www.cleanteq.com
M: +61 3 9797 6700
E: sriggall@cleanteq.com
SYERSTON PA G E 3 4You can also read