Vulnerability Profile of Kiribati - Committee for Development Policy 20th Plenary Session - the United Nations
←
→
Page content transcription
If your browser does not render page correctly, please read the page content below
CDP2018/PLEN/6.b

Committee for Development Policy
      20th Plenary Session

             United Nations
       New York, 12‐16 March 2018
          Conference Room 6

Vulnerability Profile of Kiribati

                   1
Contents

Kiribati: graduation road map at a glance

1.     Introduction: historical and institutional context

2.     Kiribati and the per capita income criterion

3.     Kiribati and the human assets criterion

       Percentage of population undernourished
       Child (under five) mortality rate
       Secondary school enrolment rate
       Adult literacy rate

4.     Kiribati and the economic vulnerability criterion

       Geographical remoteness
       Environmental vulnerability
       Population living in low-lying areas
       Merchandise export concentration
       Natural shocks
       Victims of natural disasters
       Instability of agricultural production and of exports of goods and services

5.     Conclusion

Annex: The graduation criteria and the graduation rule

                                               2
Kiribati: graduation road map at a glance

March 2012:         Kiribati, for the first time, met two of the three thresholds of graduation from
                    LDC status with substantial margins (see pages 7 and 9). The Committee for
                    Development Policy (CDP) accordingly found Kiribati pre-eligible for
                    graduation. This finding brought no immediate change to the country's
                    entitlement to LDC treatment.

March 2015:         The CDP re-examined the potential graduation case of Kiribati and the
                    question of full eligibility for graduation from LDC status. The Committee
                    decided not to recommend Kiribati for graduation. Instead, it deferred its
                    decision to the next triennial review of the list of LDCs in 2018.

March 2018:         If the CDP finds the country fully eligible for graduation, it will normally
                    recommend graduation from LDC status in its report to the Economic and
                    Social Council (ECOSOC). The CDP may also delay its decision to
                    recommend graduation.

July 2018:          ECOSOC will normally endorse the CDP's recommendation to graduate
                    Kiribati from LDC status if such recommendation has been made. ECOSOC
                    may also delay its action on the recommendation.

December 2018: The UN General Assembly, in turn, will normally endorse the
               recommendation to graduate Kiribati, through a resolution formally stating the
               UN decision to take the country out of the list of LDCs. On the day of
               adoption of such a resolution, Kiribati will enter the standard (normally three-
               year) grace period during which the country retains its LDC status and is
               expected to negotiate, with its development partners, a "smooth transition" to
               post-LDC status.

                    The General Assembly may avail itself of the possibility of delaying its
                    endorsement of the recommendation to graduate Kiribati. If it endorses the
                    recommendation, the General Assembly may decide to grant the country a
                    grace period of a duration different from the standard three-year prescription.

December 2021: At the end of the grace period, Kiribati will officially graduate from LDC
               status. Yet it may continue, for a period of time, to have the benefit of LDC
               treatment under "smooth transition" measures. There are broadly speaking two
               types of smooth transition measures: (i) those that are negotiated with
               development partners on a case-by-case basis; and (ii) those that are systemic,
               i.e. established for all graduating LDCs and automatically extended to them.

   1.        Introduction: historical and institutional context

                                                   3
Kiribati was added to the United Nations list of Least Developed Countries (LDCs) in
1986, seven years after the country had gained its independence.
The 2003 review of the list of LDCs was the first occasion when the country
technically exceeded two graduation lines, at 103% and 111% of the thresholds relevant to
per capita income and human assets, respectively. However, the Committee for Development
Policy (CDP), in its triennial review of the list in April 2003, questioned the stability of per
capita income in Kiribati (with a significant decline between 1998 and 2001), while
recognizing that the country was one of the "two economically most vulnerable countries" in
the light of the Economic Vulnerability Index (EVI) 1 . For these reasons, the Committee
decided that Kiribati "should not be considered"2 as pre-eligible for graduation.
In 2006, the CDP had a different reading of Kiribati's situation: it observed an
unchanged performance under the per capita income criterion (at 102% of the graduation
threshold), and a much improved score under the Human Assets Index (at 141% of the
graduation line), while recognizing the extreme vulnerability of Kiribati under the EVI. The
Committee, accordingly and for the first time, considered Kiribati "eligible for graduation"3.
The next review of the list in 2009 was again a time of reservation on the question of
Kiribati's graduation. The CDP noted that the performance under the graduation threshold
relevant to the per capita income criterion had marginally deteriorated, enough to bring back
the country under the graduation threshold (at 96.5% of the line). The Committee analyzed
the borderline case of Kiribati with caution and concluded that the country now was meeting
only one of the criteria for graduation, and accordingly was no longer eligible for graduation4.
In its 2012 review of the list of LDCs, the CDP found Kiribati "eligible" [for
graduation] as it met the GNI per capita and HAI criteria". The Committee recalled that
Kiribati "had already been found eligible for graduation in 2006, but not in 2009" 5 . In
accordance with the graduation procedure, it stated that the potential graduation case of
Kiribati would be re-examined in the next review of the list of LDCs in 2015. The 2012
observation of pre-eligibility for graduation was equivalent to a first occasion of this kind,
though Kiribati had technically met two graduation thresholds twice, in 2003 and 2006.
1
The Committee noted that: (i) the country exceeded the graduation threshold only marginally with regard to
the per capita income criterion; (ii) Kiribati's GNI per capita had been continuously decreasing between 1998
and 2001 (latest data available); and (iii) the country's economic vulnerability as measured through the EVI was
one of the highest in the world.
2
Committee for Development Policy, Report on the fifth session (7-11 April 2003), Economic and Social
Council, Official Records, 2003, Supplement No. 13, E/2003/33, para. 23. The Committee, in the next triennial
review of the list three years later (March 2006), will remember that the technical eligibility had been noted but
not acted upon in 2003, due to "uncertainty at that time regarding the quality of the data". Yet the 2003 decision
not to consider Kiribati as qualifying for graduation had been explicitly grounded in the Committee's
observation of a severe decrease in the country's per capita income over a number of years, and of a per capita
GNI score only marginally above the threshold, not in reservations about the the quality of data.
3
Committee for Development Policy, Report on the eighth session (20-24 March 2006), Economic and Social
Council, Official Records, 2006, Supplement No. 13, E/2006/33, para. 21.
4
Committee for Development Policy, Report on the eighth session (9-13 March 2009), Economic and Social
Council, Official Records, 2009, Supplement No. 13, E/2009/33, para. 23.
5
Committee for Development Policy, Report on the fourteenth session (12-16 March 2012), Economic and
Social Council, Official Records, 2012, Supplement No. 13, E/2012/33, para. 95.
4In the 2015 review of the list of LDCs, the CDP observed that Kiribati was meeting
the same two graduation thresholds (per capita income and human assets) for the second
consecutive time. At the same time, it noted that "Kiribati continued to be the most
vulnerable country in the world" 6 in the light of the EVI, and it recognized that the
sustainability of the level of income of the country was questionable in the context of
Kiribati's exposure to the risk of "large negative shocks". The Committee also took note of
the country's exceptionally high gross national income (GNI) to gross domestic product ratio
(1.84 in 2014, a world record), a fact which had brought national authorities to raise questions
about the possibility of an overvalued GNI. The CDP also recognized that, assessing the
anticipated impact of a loss of LDC treatment was "subject to heightened uncertainty",
notably in respect of the critical issue of the financing of adaptation to climate change. The
Committee accordingly decided that it would reconsider the question of Kiribati's graduation
at the 2018 triennial review.
This updated Profile was prepared in accordance with General Assembly resolution
59/209 of 20 December 2004, which decided that after a country has met the criteria for
graduation for the first time, UNCTAD is mandated to prepare a vulnerability profile on the
identified country, to be taken into account by the Committee for Development Policy at its
subsequent triennial review7.
Sections 2, 3 and 4 summarily examine the performance of Kiribati under the
graduation thresholds relevant to the three criteria for identifying LDCs, namely the per
capita income criterion, the human assets criterion, and the economic vulnerability criterion,
respectively. Section 5 offers a set of concluding remarks, with a particular focus on the
"island paradox" resulting from the conjunction of apparent prosperity and high vulnerability.
Graphs 1, 2 and 3 illustrate Kiribati's evolution, since 1991, under or above the
graduation thresholds relevant to the per capita income criterion, the human assets criterion,
and the economic vulnerability criterion, respectively. The data indicate the country's
distance to the graduation threshold, as well as the distance from/to the admission threshold
(the level for admitting new countries into the list). All data through the nine triennial reviews
of the list of LDCs since 1991 (1991, 1994, 1997, 2000, 2003, 2006, 2009, 2012, 2015) have
been standardized in index form, with the graduation threshold standing out as the 100 basis.
For example, a score of 131 observed in 2015 under the second criterion indicates that
Kiribati was standing at 131% of the relevant graduation threshold. Each graph indicates the
evolving distance to or from the graduation threshold under the reviewed criterion. It does not
purport to measure the evolution of the performance of the country under that criterion.
2. Kiribati and the per capita income criterion
The sharp rise to 103% of the graduation threshold in 2003 (from 59% in 2000) was
almost entirely explained by a change of income indicator in 2003 (from gross domestic
product/GDP per capita to gross national income/GNI per capita). GNI has been consistently
6
Committee for Development Policy, Report on the seventeenth session (23-27 March 2015), Economic and
Social Council, Official Records, 2015, Supplement No. 13, E/2015/33, para. 59.
7
General Assembly resolution A/RES/59/209, Smooth transition strategy for countries graduating from the list
of least developed countries, para. 3(b), 20 December 2004.
5higher than GDP in Kiribati (by 55% on average between 2008 and 2016). The 2015 peak at
200% of the graduation line was explained by sustained real growth (between 5% and 6%) in
2012 and 2013, and the provisionally estimated further peak at 248% of the graduation
threshold in 2018 largely reflects the high economic growth recorded in 2015 (10% real GDP
growth), notably as a result of the historically high revenue derived from fishing licenses in
that year, nearly equivalent to 100% of GDP.
Despite their volatility, fishing license fees (FLF) have been the leading source of
revenue for the Treasury, and accordingly a vital source of livelihood for households (through
the wages and salaries of civil servants, in total accounting for 28% of fishing revenue). In
2015, FLF were equivalent to six times the total amount of tax revenue in the country, and
were twice the level of external grants. Fishing revenue has a critical impact on the country's
Revenue Equalization Reserve Fund (RERF), the sovereign fund for intergenerational
savings. There are also indications that the way FLF have been dealt with in Kiribati's
national accounts underpins a significant overestimation of Kiribati's GNI.
This issue was highlighted in UNCTAD's 2015 Vulnerability Profile of Kiribati; it
remains three years later, without invalidating the finding of a Kiribati performance well
above the graduation threshold in 20188.
Table 1
KIRIBATI: Gross national income per capita in US $
2007 2008 2009 2010 2011 2012 2013 2014 2015 2016
1,330 1,880 1,880 1,990 2,010 2,450 2,840 3,300 3,350 2,270
Source: World Bank, World Development Indicators database online (GNI: Atlas method), December 2017
Income distribution
The 2006 Kiribati Household Income and Expenditure Survey revealed relatively
small contrasts, among the various groups of islands making up the country, in terms of
annual per capita income, ranging from A$1,053 in the Southern Gilbert group to A$1,531 in
Southern Tarawa where the capital is located. The survey also revealed that households in
Kiribati spend more than they earn (are indebted), and that a large majority of the islanders
are financially supported by the small minority with a regular income.
Estimates of the Gini coefficient of Kiribati, as reflected in the 2006 Household
Income and Expenditure Survey (HIES), indicated a lower degree of inequality in South
Tarawa than in the rest of the Gilbert group of islands, by 17%. Overall, Gini coefficient
figures indicate relatively low levels of inequality in the country "by Pacific standards9", with
a national coefficient of 0.39 (0.35 for South Tarawa). The Poverty Gap Index used in the
8
Box 1 explains that fishing license fees are primary income to the State, and as such, are naturally accounted
for in the calculation of the gross domestic product (GDP). Accordingly, fishing license fees should not be
counted as secondary income (factor income generated outside the economic territory), therefore should not be
added to GDP in the calculation of the gross national income (GNI).
9
Kiribati National Statistics Office and UNDP Pacific Centre, Kiribati: Analysis of the 2006 Household Income and
Expenditure Survey, March 2010, p. 34.
6same HIES reveals a greater depth of poverty below the basic needs poverty line in the rest of
the Gilbert group than in South Tarawa10.
Graph 1
KIRIBATI: distance from the graduation threshold
under the per capita income criterion
NB: data up to 2015 are based on actual CDP findings; the 2018 projection is provisional
Source: UNCTAD, based on CDP data up to 2015
Box 1
The question of the treatment of fishing license fees in calculating GDP and GNI,
and its implications for Kiribati
10
The Poverty Gap Index is one of the indicators recommended by the United Nations to measure the fulfilment of
Millennium Development Goal 1 (Reducing extreme poverty and hunger by half).
7GDP is the total value added generated by a country on its domestic economic territory, irrespective
of the nationalities of income beneficiaries. "Net factor income" (the difference between GDP and
GNI), if considered on the "credit" side, is the remuneration of all factors of production outside the
domestic economic territory, accruing to "national" factors, i.e. persons or entities who are nationals,
have been producing outside the domestic territory, but have not been permanently based abroad (less
than a year). Seamen's wages are a typical example of Kiribati's factor income. Factor income in "net"
terms designates what flows in (belonging to nationals) minus what flows out (income accruing in the
domestic economy to non-nationals who do not reside in the country permanently).
The National Accounts of Kiribati show the components explaining the difference between
GDP and GNI: net "compensation of employees", and net "property income". Net compensation of
employees is small compared with net property income --the latter was seven times greater than the
former in 2012. The IMF uses a different breakdown: "remittances", "investment income", and
"fishing license fees".
Recognition of (net) factor income, the key to GNI calculation, implies that two necessary
conditions be met:
(i) the relevant income (remuneration of production factors) would have been generated outside the
domestic economic territory (to be subsequently injected into it); and
(ii) this income would have accrued to production factors (workers or capital owners) who at that time
were nationals abroad but not permanently based abroad (absent from the domestic territory less than
a year). Remittances to Kiribati from iKiribati people permanently residing outside of Kiribati would
not be regarded as factor income, whereas remittances from Kiribati seamen on contract overseas, say,
for 6 months, are genuine factor income entering GNI.
Fishing license fees (FLF) do not meet the first of these two conditions and cannot be
regarded as part of "factor income". They are the remuneration of capital situated within the domestic
economic territory, which therefore differs from externally generated income. This domestically
situated capital, the territorial waters of Kiribati, are "rented out" to foreign fishing companies, the
same way a bungalow in Kiribati could be rented out to foreign tourists, thereby generating a rental
income that is essentially an exported service. Yet FLF appear to be part of the net factor income used
by the Government of Kiribati for GNI calculation purposes. FLF in the Government's national
accounts are the bulk of the estimated net factor income, thereby inflating the GNI estimate
considerably.
FLF are conventionally classified as part of "current transfers" (though they could also be
regarded as a form of service export). In a footnote attached to Table 4 of its 2014 Staff Report
(Kiribati Balance of Payments), the IMF admits that the net Factor Income segment of the Balance of
Payments "includes fishing license fees, which should be shown as current transfers under
conventional international guidelines".
The direct consequence of having FLF accounted for within the net factor income is a double
counting of FLF, which as a large non-tax revenue to Government is already accounted for in GDP.
Given the size of FLF (the country's leading revenue earner), the overestimation is of no small
proportion (about 30% in 2012).
3. Kiribati and the human assets criterion
Kiribati was standing well above the graduation line relevant to human assets at the
time of the 2015 review of the list of LDCs, with a score at 131% of the graduation threshold.
8A provisional estimate for 2018 (depicted through the dotted segment) places the country at
127% of the graduation line, thereby indicating stability in the country's technical eligibility
for graduation.
Graph 2
KIRIBATI: distance from the graduation threshold
under the human assets criterion
(based on the Human Assets Index)
NB: data up to 2015 are based on actual CDP findings; the 2018 projection is provisional
Source: UNCTAD, based on CDP data up to 2015
With the exception of child mortality (58 deaths per 1,000 live births, as opposed to
an average 25 per 1,000 in other Pacific LDCs), all components of the Human Assets Index
score of Kiribati rank high among LDCs, with an unequalled secondary school enrolment
ratio of 86%. This level of human capital development is more the consequence of good
governance and proper targeting of social investment with external support than a dividend of
structural economic progress. It would not be sufficient to significantly enhance productive
capacities in Kiribati, given the acute geographical constraints and difficulties faced in
developing the physical infrastructure. Only massive, lasting efforts toward human capital
development and infrastructural development could pave the way for a greater economic
momentum, notably through diversification into economic activities with greater value
addition.
Kiribati, in 2015, fared better than other small island developing States (SIDS) that
are LDCs, or ex-LDCs, or low-income non-LDCs: (i) by 66% in its undernourishment ratio;
(ii) by 39% in secondary school enrolment; and (iii) by 14% in adult literacy. The success
achieved in fighting the mortality of children under five (with a 19% decrease in the relevant
ratio within the 2000 decade) brought an end to the lasting delay Kiribati had recorded, in this
9area, behind countries of the same comparative group. Maintaining a sustained momentum of
human assets development is a considerable challenge to the dispersed Kiribati nation.
Percentage of population undernourished (component of the Human Assets Index)
CDP estimate in 2015: 5%
The 2006 Household Income and Expenditure Survey indicated that 4.9% of the
population had difficulties to meet their basic food needs. The Health Information Unit of the
Ministry of Health, in August 2017, revealed rates of malnutrition (including stunting) of 4.7%
in 2015 and 5.9% in 2016 among children under age five. In 2004, a WHO survey had noted
that 70% of adults between 25 and 44, and 75% of adults between 45 and 64 were affected by
dietary imbalances (often overweight or obese).
The number of serious cases of malnutrition (cause of morbidity) has always varied
sharply in Kiribati (e.g., from 191 cases in 2004 to 318 in 2005 and 527 in 2006). The
number of admitted malnutrition cases in 2013 was 61, 15 of which were recorded as
"severe", while 13 related to low birth weight.
Child (under 5) mortality rate (component of the Human Assets Index)
CDP estimate in 2015: 58 per 1,000
The Kiribati Annual Health Bulletin 2016 indicates an under-5 mortality rate of 52.4
per 1,000 live births, and recognizes that the number of unde-5 deaths is under-reported. This
estimate is based on the 2016 Kiribati Household Income Survey. Measles has been one of
the leading causes of child mortality in the country, despite progress in the proportion of
children immunized against that infectious disease. The same source provides a maternal
mortality rate of 179.3 deaths per 100,000 live births, a figure resulting from 5 deaths in the
country in 2016.
Secondary school enrolment rate (component of the Human Assets Index)
CDP estimate in 2012: 86.4%
2014 data from the Kiribati Ministry of Education indicate, for 2013, gross secondary
school enrolment rates of 86% for junior secondary school students (Forms 1 to 3), and 44%
for senior secondary school students (Forms 4 to 7). The overall (weighted) gross secondary
school enrolment rate (with 7,038 junior students and 4,745 students in that year) is estimated
at 69.1%. It should be noted that the gender imbalance in secondary school enrolment is
largely in favour of female students, with gross enrolments rates of 94% and 53% at female
junior level and female senior level, respectively, and 78% and 36% at male junior level and
male senior level, respectively.
Adult literacy rate (component of the Human Assets Index)
CDP estimate in 2012: 92%
10The 2010 Kiribati population census defined literacy as a person's ability to read and
write in either Kiribati language, or English, or other languages. Kiribati's overall literacy rate
at that time (2010) was estimated at 97.7%, with marginal differences between urban areas
(98.6%) and rural areas (96.9%). The female rate, in 2010, was consistently higher than the
male rate between teenage and age 30 (by 6% on average). There is no gender-based
difference between age 30 and age 40, and males still demonstrate a higher adult literacy rate
above age 40.
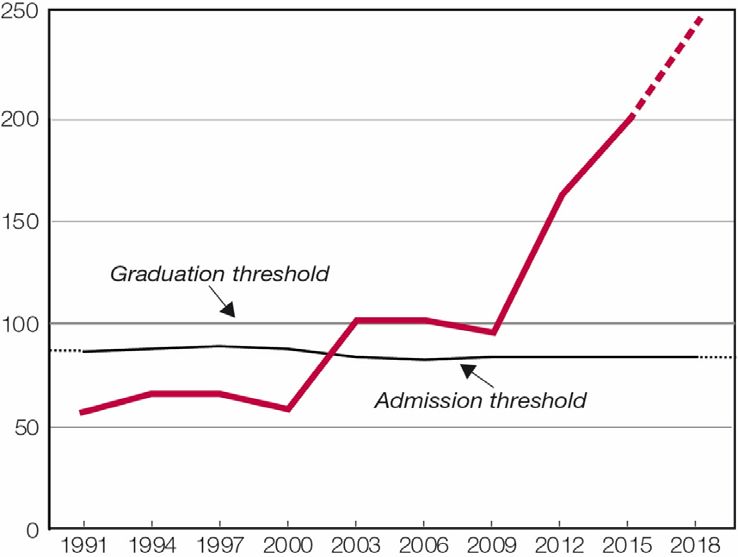
4. Kiribati and the economic vulnerability criterion
At only 45% of the graduation threshold under the economic vulnerability criterion in
2015, and a provisionally estimated 43% in 2018, Kiribati continues to be recognizable as the
economically most vulnerable country in the world. Detailed examination of the country's
score under the Economic Vulnerability Index (EVI) reveals that, smallness in population
terms, geographical remoteness, physical exposure to sea-related risks for people living in
low-lying areas, and a high ratio of victims of natural disasters are the four EVI components
weighing most heavily in the EVI score of Kiribati. On the other hand, there is little to say
about agricultural production instability in the absence of consistently measurable agricultural
production. In short, Kiribati is more a permanently fragile economy as a consequence of its
geography than an unstable economy, and there is little scope for improvement of its EVI
score under the graduation line.
Graph 3
KIRIBATI: distance to the graduation threshold
under the economic vulnerability criterion
(based on the Economic Vulnerability Index)
NB: data up to 2015 are based on actual CDP findings; the 2018 projection is provisional
Source: UNCTAD, based on CDP data up to 2015
Geographical remoteness (component of the Economic Vulnerability Index)
The remoteness index within the 2015 EVI indicates that Kiribati is 34% more remote
than other LDCs. This makes remoteness one of the EVI components weighing most heavily
11in the measurement of Kiribati's economic vulnerability. As in most other Pacific States,
economic remoteness is a major structural handicap for Kiribati, an obstacle to
competitiveness for merchandise trade, and a disincentive for potential investors as well as
international tourists.
Environmental vulnerability (component of the Economic Vulnerability Index)
Kiribati is among the environmentally most fragile countries in the world. Climate
change and the ensuing sea level rise phenomenon increasingly affect coastal areas (therefore
the living conditions of most people); access to fresh water; farming (which accounts for a
decreasing share of GDP); and the people's health.
Population living in low-lying areas (component of the Economic Vulnerability Index)
With more than 80% of its population living in low-lying (coastal) areas, Kiribati not
surprisingly demonstrates a score considerably (11 times) higher than the average of other
LDCs with regard to this particular component of the Economic Vulnerability Index in 2015.
Merchandise export concentration (component of the Economic Vulnerability Index)
One observes a degree of merchandise export concentration 80% higher in Kiribati
than in other LDCs. Kiribati-originating export goods have remained limited to coconut
products, sea cucumber, shark fins, and tuna products. It was reported by the Customs
Department that in 2015, fish exports began to exceed coconut product exports. From a
statistical viewpoint, the narrow export base has been a determining factor of the economic
vulnerability of Kiribati (the more concentrated the export base, the higher the EVI score, i.e.
the higher the country's economic vulnerability).
Natural shocks (component of the Economic Vulnerability Index)
The adverse impact of climate change on Kiribati has been considerable, largely as a
result of the nature and geography of the islands (atolls). The main issues severely faced by
Kiribati, largely in relation to the consequences of climate change, are: coastal erosion,
coastal inundation, loss of mangroves and coral reefs, serious impacts on fresh water
resources, serious impacts on agriculture, and serious impacts on public health.
Over the past 80 years, 13 major drought events took place in Kiribati, with an
average duration of 20 months and consequences ranging from ground water contamination
to fatal illnesses (see Table 2). Five major tropical cyclones and four extreme tide events also
caused severe damage to all regions of the country.
Table 2
KIRIBATI: History of natural disasters since 1938
Events Date Comments
12Events Date Comments
Drought Jun 1934 to Sep The prolonged drought caused coconut and fruit crops to be depleted
1938 (51 months) (information retrieved under UNFCCC in Sep 1999)
ENSO-neutral condition
Drought Jun 1950 to Jun Undocumented
1951 (12 months) ENSO-La Niña condition
Drought May 1956 to Feb Resettlement of people from the Phoenix Islands had to be organized because
1958 (21 months) water was seriously salinized, and drought caused fatal illnesses.
ENSO-La Niña condition
Drought Mar 63 to Jan 1964 Undocumented
(10 months)
Drought Apr 1971 to Apr Undocumented
1972 (12 months) ENSO-La Niña condition
Drought Dec 1975 to Dec Undocumented
1976 (12 months) ENSO-La Niña condition
Tropical cyclone 1978/1979 Tropical cyclone struck the south islands severely.
Gordon
Drought Nov 1985 to Apr Undocumented
1987 (17 months) ENSO-neutral condition
Tropical cyclone 1987/1988 Tropical cyclone struck the south islands severely.
Anne
Drought Feb 1989 to Feb Undocumented
1990 (12 months) ENSO-La Niña condition
Drought Mar 1996 to Jan Government declared the state of emergency after ground water was affected.
1997 (10 months) ENSO-La Niña condition
Drought Mar 1998 to Mar Government declared the state of emergency after coconut trees and breadfruit
2001 (36 months) trees were dying, particularly in South Tarawa and the outer islands. When rain
came, widespread diarrhoea struck Tarawa and claimed some lives.
ENSO-La Niña condition
Drought Feb 2001 to Aug Undocumented
2002 (18 months) ENSO-La Niña condition
Drought Feb 2008 to Aug Government declared the state of emergency, and water was transported to
2009 (18 months) Banaba Island (raised coral island).
ENSO-La Niña condition
Swell 9 Dec. 2008 Damage was incurred by crops, coastal installations and buildings as a result of
strong winds and destructive waves. One resident was injured during a surfing
event.
Extreme spring tide 29 Jan to 1st Feb Inundation took place near shore infrastructure and crops.
2010
Drought Apr 2011 to Oct A shortage of rainfall depleted the fresh water supply.
2012 (18 months) ENSO-La Niña condition
Extreme spring tide 28 Feb to 2 Mar Widespread damage was incurred across western Kiribati, namely Makin,
and swell 2014 Marakei and Onotoa. Vegetation and water sources (wells) were deteriorated.
Households were damaged, and coastal residents were forced to move inland.
Inundation and major damage near causeways and households were also
experienced on Tarawa.
Extreme spring tide 10-13 Aug 2014 Considerable damage was inflicted on sea walls and causeways in South
Tarawa.
Extreme spring tide 20-23 Jan 2015 Inundation and major damage were incurred by crops, coastal installations and
buildings as a result of destructive waves. The lives of two children were lost
through drowning during the event.
Tropical cyclone Pam, Mar 2015 Inundation and erosion caused deterioration of food crops, water sources,
Tropical storm Bavi homes and infrastructure on many islands around western Kiribati. In Tarawa,
the Nippon causeway had to be closed. In the southern parts of western
Kiribati, residents were forced to evacuate their homes as waves surged in.
Tropical cyclone Pali 9 Jan 2016 Four casualties were reported from Kiritimati when a cargo container was
and low pressure carried ashore from the jetty. Major inundation was also experienced.
system
Source: Government of Kiribati, through Mr. Martin Tofinga ENSO: El Niño - Southern Oscillation
Victims of natural disasters (component of the Economic Vulnerability Index)
13The ratio of victims of natural disasters, an EVI component and an indicator of
exposure to shocks since 2012, is higher in Kiribati than in other LDCs by 125%, thereby
corroborating the country's exposure to adverse natural events. While casualties from violent
events such as tropical cyclones or sea swells have been few, growing numbers of homeless
people have been suffering from poverty as a result of coastal erosion and related
environmental degradation. For many households, the lack of sanitation in this context has
been a critical facet of lasting poverty.
Instability of agricultural production and of exports of goods and services (components of
the Economic Vulnerability Index)
Instability of agricultural production has been lower in Kiribati than in other LDCs by
2%, though copra production and seaweed production always fluctuated (for example, copra
production rose from 5,165 tonnes in 1997 to 12,334 tonnes in 2004, while seaweed
production dropped from 1,167 tonnes in 2001 to 147 tonnes in 2006).
The 2015 Economic Vulnerability Index indicates that, exports of goods and services
have been more unstable in Kiribati than in other LDCs by 18%. One also observes that
exports have been three times more unstable in Kiribati than in other small island developing
States. Export instability has been caused by supply-related factors and price-related factors
alike. Tourism has also undergone sharp fluctuations associated with the international
demand (e.g., 4,700 visitor arrivals in 2006; 9,200 in 2016).
Because of its very small size and the severe geographical and environmental
constraints it is faced with, Kiribati's economy can hardly specialize beyond the few existing
crops (copra, seaweed, etc.) and the limited tourism industry. The latter has remained a small
sector of the economy (accounting for 0.5% of GDP at market prices). Kiribati is
continuously constrained by price and demand-related shocks (e.g., food and oil prices in
2008) in addition to the serious socio-economic effects of global environmental shocks.
5. Conclusion
At 200% of the graduation threshold relevant to the per capita income criterion in
2015 and 248% in 2018, Kiribati statistically demonstrates a level of continued relative
prosperity. The 2012 review of the list of LDCs by the United Nations was the point of
history when an impression of irreversible prosperity in Kiribati began to percolate
internationally, with a surge in the country's score above the same graduation threshold in
that year (before further peak effects in 2015 and 2018). Yet in the absence of significant
productive capacities and of commensurate progress in the standards of living of Kiribati
nationals, the impression of prosperity is fallacious. Rental income sources (notably fishing
license fees), aid and private remittances are the main monetary wealth of Kiribati, and that
wealth is barely sufficient for meeting the high costs associated with the challenges of
smallness, remoteness, and climate change.
With an overestimated GNI and a performance under the economic vulnerability
criterion that shows more symptoms of fragility than signs of structural progress, Kiribati
quintessentially illustrates the "island paradox" of apparent prosperity combined with extreme
vulnerability, a long-standing concern in the international discourse on small island
developing States. The case, in 2018, raises questions not less disturbing than the issues that
14caught the CDP's attention, for good reasons, in the five latest reviews of the list of LDCs
(2003, 2006, 2009, 2012, 2015).
The quest for productive capacity-building is presently being rewarded by the
promising fish export performance of Kiribati. Given the importance to the country of
gaining or retaining international support in respect of supply capacities and market access
(and to costly, vital public policy areas such as climate adaptation), the question of country
status is likely to remain justified in Kiribati in the near future. As President Anote Tong of
Kiribati remarked in a high-level panel organized by UNCTAD on 2nd September 2014 in
Samoa, "we would gladly lose LDC status if only we could count on alternative avenues for
special treatment to support our efforts, particularly on special measures by virtue of our
proclaimed small island developing State status…".
ANNEX
The graduation criteria and the graduation rule
15The question of graduation from LDC status was conceptualized by the United Nations in
1991, when the first major revision of the criteria for identifying LDCs took place. The
methodological elements of the graduation rule were also adopted in that year, a move that
has paved the way for five cases of graduation from LDC status: Botswana in 1994, Cabo
Verde in 2007, Maldives in 2011, Samoa in 2014, and Equatorial Guinea in 2017.
In 1990, the Second United Nations Conference on the Least Developed Countries in Paris
had envisaged graduation from LDC status as a natural prospect for countries that would
eventually demonstrate enough economic progress to be able to remain on the same
development path with a lesser need for concessionary treatment. In 2001, the Third United
Nations Conference on the Least Developed Countries in Brussels contemplated graduation
as a criterion on the basis of which the success of the Programme of Action for the Least
Developed Countries for the Decade 2001-2010 would be "judged"11. An unprecedented leap
forward was made by UN member States ten years later, at the Fourth United Nations
Conference on the Least Developed Countries in Istanbul (May 2011), with a bold
pronouncement on the matter, namely, “the aim of enabling half the number of Least
Developed Countries to meet the criteria for graduation by 2020”12.
The rationale for graduation
Graduation from LDC status is naturally synonymous with the recognition of structural
economic progress. A graduating country will necessarily be expected to have demonstrated,
through a convincingly improved economic and social performance, enough structural
progress to be able to pursue its development efforts with less external support. If the
decision to take a country out of the list of LDCs is well founded, the graduating country,
with enhanced institutional capacities, will be expected to remain undisturbed while
development partners may deny it privileged access to a special treatment.
The graduation rule
The graduation rule applies specific thresholds to the indicators relevant to the three criteria
(gross national income per capita; human assets index; economic vulnerability index). For
each of these indicators, there is a margin between the threshold for adding a country to the
list and the threshold for graduating a country. The margin is considered a reasonable
estimate of the additional socio-economic progress that ought to be observed if one assumes
that the graduating country is effectively engaged on a path of improvement: not only is the
graduating country expected to have risen to the threshold under which non-LDCs would be
admitted into the category, but it is additionally expected to exceed this threshold by a
significant margin. This dispels the risk that graduation be dictated by temporary or
insignificant economic circumstances.
Two other elements of the graduation rule also imply durable structural progress in
the graduating country:
11
UN General Assembly, Third United Nations Conference on the Least Developed Countries, Brussels,
Belgium, 14-20 May 2001, Programme of Action for the Least Developed Countries for the Decade 2001-2010,
para. 21(e)
12
United Nations, Programme of Action for the Least Developed Countries for the Decade 2011-2020, May
2011, para. 28.
16• at least two of the three graduation thresholds must normally be met for the relevant LDC
to qualify for graduation, whereas a symmetrical application of the admission rule and
graduation rule would imply that, ceasing to meet one of the three criteria under which the
country was once identified as an LDC would be a sufficient reason for that country to
qualify for graduation (see the "income only" exception to the graduation rule in the table
below);
• a recommendation to graduate a country will not be made until the relevant graduation
thresholds have been met by the country in at least two consecutive reviews of the list of
LDCs.
The graduation criteria which were used by the United Nations in the 2015 review of the list
of LDCs are summarized in the following table.
Graduation criteria and indicators
17Graduation criteria used Relevant indicators
in the 2015 review
of the UN list of LDCs
Per capita income criterion Gross national income (GNI) per capita:
* based on a 3-year average (2011-2013 in the 2015 review)
* graduation threshold in 2015: US $1,242
* "income-only" graduation threshold: US $2,484
Human assets criterion Human Assets Index (HAI):
A composite index based on the following 4 indicators:
* percentage of undernourished people in the population
* under-five mortality rate
* gross secondary school enrolment rate
* adult literacy rate
Economic vulnerability criterion Economic Vulnerability Index (EVI):
A composite index based on the following 8 indicators:
* population
* remoteness (average distance from major markets)
* share of population living in low-lying areas
* share of agriculture, forestry and fisheries in GDP
* merchandise export concentration index
* share of victims of natural disasters in the population
* index of instability of agricultural production
* index of instability of exports of goods and services
For all three criteria, different thresholds are used for identifying cases
Summary of the graduation rule
of addition to, and cases of graduation from, the list of LDCs. A
country will qualify to be added to the list if it meets the addition
thresholds on all three criteria and does not have a population greater
than 75 million. Qualification for addition to the list will effectively
lead to LDC status only if the government of the relevant country
accepts this status. A country will normally qualify for graduation from
LDC status if it has met graduation thresholds under at least two of the
three criteria in at least two consecutive triennial reviews of the list.
However, if the per capita GNI of an LDC has risen to a level at least
double the graduation threshold and is deemed sustainable, the country
will normally be found pre-eligible or eligible for graduation regardless
of its performance under the other two criteria.
18You can also read