Water quality assessment of Bukit Merah Reservoir, Malaysia using mathematical modeling
←
→
Page content transcription
If your browser does not render page correctly, please read the page content below

IOP Conference Series: Earth and Environmental Science

PAPER • OPEN ACCESS

Water quality assessment of Bukit Merah Reservoir, Malaysia using
mathematical modeling
To cite this article: M Z Mokhtar et al 2020 IOP Conf. Ser.: Earth Environ. Sci. 535 012023

View the article online for updates and enhancements.

                                This content was downloaded from IP address 46.4.80.155 on 06/09/2021 at 14:51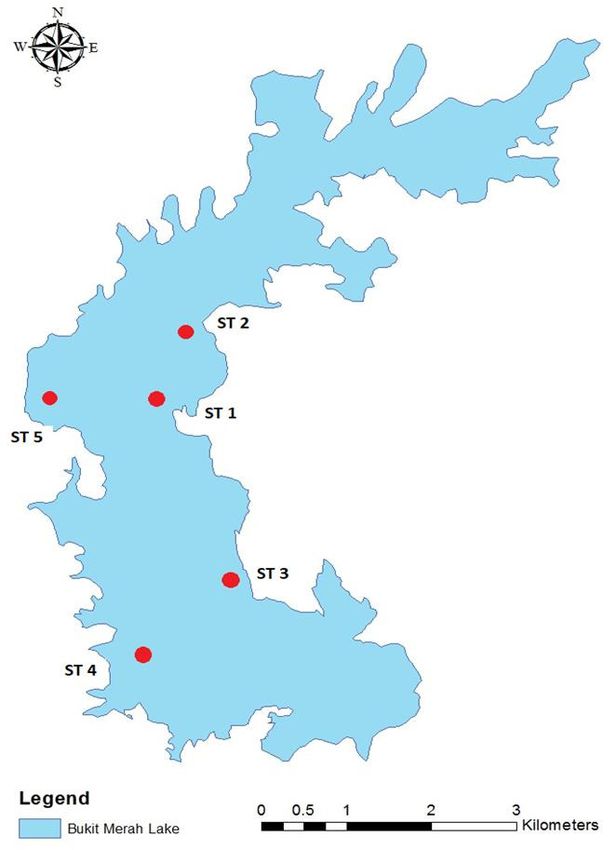
International Conference on Tropical Limnology 2019                                                            IOP Publishing
IOP Conf. Series: Earth and Environmental Science 535 (2020) 012023                        doi:10.1088/1755-1315/535/1/012023

Water quality assessment of Bukit Merah Reservoir, Malaysia
using mathematical modeling

                     M Z Mokhtar1, M S Sofiana 1, W O Wan Maznah 1,2,3* and S Y Teh4
                     1
                       School of Biological Sciences, Universiti Sains Malaysia, 11800 Penang, Malaysia
                     2
                       Centre for Marine and Coastal Studies, Universiti Sains Malaysia, 11800 Penang, Malaysia
                     3
                       River Engineering and Urban Drainage Research Centre, Engineering Campus, Universiti
                     Sains Malaysia, 14300, Nibong Tebal, Pulau Pinang, Malaysia.
                     4
                       School of Mathematical Sciences, Universiti Sains Malaysia, 11800 Penang, Malaysia.

                     *Corresponding author
                     Email: wmaznah@usm.my

                     Abstract. Bukit Merah Reservoir (BMR), Perak is the oldest man-made reservoir in Malaysia,
                     situated in Kerian District, northern part of Perak, Malaysia, purposely to provide irrigation water
                     to Kerian Irrigation Scheme (KIS) for rice cultivation. Thus, a study focuses on the determination
                     of the current water quality status of the reservoir was conducted in November 2018 and
                     February 2019 as a representative for the wet and dry season, respectively, in order to assist the
                     prediction of the water quality in BMR and its impact towards the ecosystem. Five sampling
                     stations were chosen to provide a general overview of physico-chemical profile in BMR.
                     Physico-chemical parameters (i.e.: temperature, dissolved oxygen, conductivity, total dissolved
                     solids, pH, and water transparency) were measured in situ whereas in the laboratory, total
                     suspended solids, chlorophyll-a, and nutrient analysis were done in accordance to APHA (2005).
                     The concentration of dissolved oxygen (DO) and biological oxygen demand (BOD) were
                     simulated in a graph using Water Quality Analysis Simulation Program (WASP). Based on the
                     analysis conducted throughout the study, the result indicated that the temperature, pH,
                     chlorophyll-a, orthophosphate, and nitrate-nitrogen were higher in November 2018 compared to
                     February 2019 which is 31.3°C, 6.8, 0.0533 µg/L, 0.0158 mg/L, and 0.1731 mg/L, respectively.
                     One-way ANOVA showed that temperature and pH were significantly different between stations
                     (p
International Conference on Tropical Limnology 2019 IOP Publishing
IOP Conf. Series: Earth and Environmental Science 535 (2020) 012023 doi:10.1088/1755-1315/535/1/012023
Water quality status in most water resources, however, is deteriorating from natural and
anthropogenic activities. External inputs, for instance, the organic and inorganic pollutants, and nutrient
loading entered the water bodies, thus deteriorating the water quality [2]. Due to the growth of the human
population and urbanization in the watersheds, it has finally triggered the land use activities surrounding
the water bodies. Unrestrained land-use could impact the lakes and reservoirs through the runoff from
any anthropogenic activities. According to Sharip and Zakaria [1], Akinbile et al [3], and Qin et al [4],
the most common deterioration in water quality is sedimentation, eutrophication and weed infestation.
Eutrophication occurs due to the substantial increase of fertilizer needed by plants which usually
contains nutrients, for instance, nitrogen and phosphorus, which increase the productivity of aquatic
microorganisms.
Bukit Merah Reservoir (BMR) is facing a major threat to its water quality due to sand mining, land
clearing and multiple land conversions including oil palm plantation. Hence, this study focuses on the
determination of the current water quality status of the reservoir in order to assist in the prediction of
the water quality in BMR and its impact towards the ecosystem. A mathematical model using Water
Quality Analysis Stimulation program (WASP) based upon data collected during the research conducted
in the lake was developed to assess the nature of the water quality degradation by simulating the graphs
of DO and BOD concentrations.
2. Methodology
2.1 Study sites
Bukit Merah Reservoir (BMR) is a well-known oldest man-made lake in Malaysia and was built as a
modified homogenous embankment, situated in Kerian District, northern part of Perak State, Peninsula
Malaysia. Built in 1902 for the Kerian Irrigation Scheme (KIS) and was operated since 1906, BMR has
the capacity of 70 million m3, with the length of 13.8 km and the width of 4.5 km [5]. According to
Drainage and Irrigation Department [6], the maximum depth of the lake is 5.3 m while the mean depth
is 2.5 m. The water sources that flow into the reservoir came from two main catchment areas specifically,
Kurau River Basin and Merah River Basin including some tributaries that link up with the reservoir.
The main purpose of BMR is for the irrigation to KIS especially for rice cultivation that covers
approximately 23,560 hectares of paddy field and to channel water supply for Kerian and Larut Matang
District and for the sanctuary of Scleropages formosus, a commercially valuable freshwater fish also
known as Arowana Malayan gold [6]. BMR is divided into 2 sections which are the northern part and
the southern part of the reservoir by a 4 km railway-line that is constructed across the reservoir, by
Keretapi Tanah Melayu Berhad (KTMB). Bukit Merah Dam consisted of a main dam, 2 saddle dams, a
gated service spillway, a gated auxiliary spillway, and an intake structure. Land use of BMR was mainly
made up of the virgin and primary forests (46.29%), agriculture (palm oil plantation), and a breeding
farming industry (national boar breeding centre) for economical purposes (48.80%) [7, 8]. Five sampling
stations (ST1, ST2, ST3, ST4, and ST5) around BMR were established (figure 1). The description of the
surrounding areas of each sampling site is shown in table 1.
2International Conference on Tropical Limnology 2019 IOP Publishing
IOP Conf. Series: Earth and Environmental Science 535 (2020) 012023 doi:10.1088/1755-1315/535/1/012023
Figure 1. Location of five sampling stations (Station 1 –
Station 5) in Bukit Merah Reservoir (BMR)
700
600
500
400
Rainfall (mm)
300
200
100
0
Feb-09
Sep-13
Feb-14
Sep-18
Feb-19
Aug-11
Nov-12
Aug-16
Nov-17
Oct-10
Jul-14
Oct-15
Jul-09
Jun-12
Mar-16
Dec-09
Mar-11
Dec-14
Jun-17
May-10
Jan-12
Apr-13
May-15
Jan-17
Apr-18
Month
Figure 2. Monthly variation of average rainfall at Bukit Merah Reservoir (BMR) station from February
2009 to February 2019 in 10 years period.
3International Conference on Tropical Limnology 2019 IOP Publishing
IOP Conf. Series: Earth and Environmental Science 535 (2020) 012023 doi:10.1088/1755-1315/535/1/012023
Table 1. GPS coordinate and description of each sampling stations in Bukit Merah Reservoir
Stations Coordinate Description of station
ST1 N 05° 01’ 56.8” E 100° 39’ 54.9” Located near to the inlet of Sungai Kurau
Basin.
ST2 N 05° 02’ 20.6” E 100° 40’ 10.3” Considered as the upper northern area and
located near to the new railway line of
Bukit Merah Reservoir.
ST3 N 05° 00’ 39.9” E 100° 40’ 26.3” Located near to the Orang Utan Island and
considered as the southern part of the
reservoir.
ST4 N 04° 59’ 59.5” E 100° 39’ 51.3” Located in between the Orang Utan Island
and the lakefront resort and waterpark.
ST5 N 05° 02’ 08.0” E 100° 39’ 10.6” Located near to the spillway of Bukit
Merah Reservoir.
2.2 Sampling design of Bukit Merah Reservoir
The measurement of the water quality parameters in-situ and the water samples collection were done in
November 2018 (663.1 mm) and February 2019 (298.3 mm) as the representative of the wet and dry
season, respectively. Figure 2 showed the monthly variation of rainfall at Bukit Merah Reservoir (BMR)
station from February 2009 to February 2019 in 10 years period. The sampling stations were chosen
based on their vicinities to human activities and land use nearby in order to provide an overview of the
physico-chemical profile of the water. Therefore, five sampling points in Bukit Merah Reservoir (BMR)
were chosen and the coordinate of each sampling point were marked by using a handheld GPS (table 1).
Station 1 was chosen based upon its location which situated at the river mouth of Kurau River where
the water source came from the river into the reservoir. Station 2 is considered as the upper northern
area of the reservoir and it is located near to the railway line of BMR. There was less water movement
in this area since it is shaded with the railway line. Station 3 is situated at the southern part of the
reservoir, near to the Orang Utan Island. Station 4 is located in between the Orang Utan Island and just
200 m away from the Bukit Merah Laketown and Bukit Merah Laketown Resort. Riparian vegetation
consists of Rasau tree, Hanguana malayana and bushes, present nearby the station while station 5 is
located near to the spillway of Bukit Merah Reservoir. Station 3 and 4 were also chosen as it is situated
in the embayment area. Embayment areas are classified by a large diameter of surface water which is
exposed to the wind turbulence directly. Station 1 is located near to the riverine zone whereas Station 2,
Station 3, Station 4 and Station 5 are located in the transition zone.
2.3 Measurement of physico-chemical parameters and nutrient analysis
Temperature (°C), dissolved oxygen (DO, mg/L), pH, electrical conductivity (S/m) and total dissolved
solids (TDS) were recorded in-situ using a multi-probe meter (YSI 6,600 MPS). Measurement of the
parameters was carried out slightly under the water surface. Water transparency provides information
on the underwater light condition and was measured by using a Secchi disc and a measuring tape. In
triplicate, 250 ml of water samples were collected at the sampling sites to carry out nutrient analyses,
chlorophyll-a (chl-a) and total suspended solids (TSS) while another triplicate of water samples were
collected using BOD bottles and were covered with aluminum foil to prevent the penetration of sunlight
for biological oxygen demand determination (BOD5). The concentration of NH4-N was determined by
using the low indophenol method where the reaction between ammonium with the phenol reagent and
hypochlorite solution produced blue indophenol colour [9]. Diazotization method was used to determine
the NO2-N concentration in which a pink colour compound was formed during the reaction of nitrite,
sulphanilamide reagent and N-(1-naphthyl)-ethylenediamine dihydrochloride [9]. Additionally, the
4International Conference on Tropical Limnology 2019 IOP Publishing IOP Conf. Series: Earth and Environmental Science 535 (2020) 012023 doi:10.1088/1755-1315/535/1/012023 NO3-N concentration was determined by the cadmium-reduction method using a cadmium column system [9]. In order to determine the ortho-phosphate concentration, Boyd and Tucker [10] method was used. A blue colour solution formation was observed when a reaction occurs between sulfuric acid, potassium antimonyl tartrate, ammonium molybdate and ascorbic acid [11]. As for the BOD determination, BOD5 was done in which the DO level of the water samples that were stored in the dark place inside the wood box to avoid sunlight penetration and were checked using DO meter after 5 days. The reading of DO after 5 days were compared to the initial DO to find the value of BOD. 2.4 Statistical analysis Prior to analysis, parametric univariate analyses (One-Way ANOVA test, Tukey’s HSD) using SPPS version 22 were used to determine the significant difference of water quality parameters among stations. 2.5 Water Quality Analysis Simulation Program (WASP) Water quality modeling is a tool used to observe the natural phenomenon of water bodies and to simulate a model to represent the environmental situation since the whole actual environment is too complex to be described fully. With the help of modeling, any threats or pollutant intrusion which would transform the water quality condition in the aquatic environments could be predicted and simulated. Water Quality Analysis Simulation Program (WASP) is constructed by the eutrophication model which was implemented in WASP 7.3 [12]. In this study, DO and BOD were taken into consideration to be simulated using this model. Simulation of the BOD and DO parameters using WASP can be used as a prediction tool in order to reflect the current condition and to predict the future condition of the DO and BOD levels in the reservoir [12]. Physical parameters of BMR data for instance reservoir surface area (km²), mean depth (m), reservoir volume (mil m³) and the maximum depth (m³) were obtained from the Department of Irrigation and Drainage for the calibration and validation purposes. An analytical model which involved basic steady-state equation developed by Streeter and Phelps was used for dissolved oxygen (DO) and biological oxygen demand (BOD) simulation [13]. The equation was as follows: BOD (mg/L) / = − ! + " DO (mg/L) # / = − ! + $ (%&−%) where, l = BOD mean concentration, mg/L C = DO mean concentration, mg/L Cs = DO saturation level, mg/L t = time, day $ = reaeration rate, dayˉ¹ " = BOD loading, mg/L/day ! = BOD decay rate, dayˉ¹ 3. Results and Discussion 3.1 Water quality parameters Mean water temperature was ranged between 29.3 ± 0.94°C and 31.3 ± 0.94°C during sampling on November 2018 and February 2019. The lowest temperature was recorded at Station 2 whereas the highest temperature was recorded at Station 3 and 4. There was a significant difference between the mean of water temperature among sampling stations (One-way ANOVA, p
International Conference on Tropical Limnology 2019                                       IOP Publishing
IOP Conf. Series: Earth and Environmental Science 535 (2020) 012023   doi:10.1088/1755-1315/535/1/012023

observed at certain stations especially Stations 1 and 2 due to the time factors in which the samplings
were carried out before noon. The water temperature reading shows the highest at Station 5 as the
collection of samples were carried out during the higher radiation adsorption and degree of exposure to
sunlight.
    Based on table 2, Station 2 showed the lowest reading of dissolved oxygen with the value of 5.3 ±
0.688 mg/L in November 2018 whereas the highest reading of 15.2 ± 3.159 mg/L was recorded at Station
5 on February 2019. Based on one-way ANOVA test, there was no significant difference of DO among
the stations (p>0.05). The mean concentration of DO was higher in February 2019 compared to
November 2018 (table 2). This could be due to the algal productivity level that carries out more
photosynthesis and produced more oxygen which causes the high DO in water. According to Mollah et
al [14], photosynthetic activity, respiration, and decomposition of aquatic organism and process of
oxygen diffusion from the atmosphere are some of the factors that could influence the DO concentration
in water. Boyd [11] noticed that whenever any water bodies were covered with shade or situated at any
shady area, it can experience a huge drop in DO during the phases of warm weather thus explained the
lowest reading of dissolved oxygen at Station 2 which were located near to the railway line. Station 2
recorded the lowest (26.8 ± 0.559 S/m) and the highest (30.2 ± 0.750 S/m) mean conductivity reading
in November 2018 and February 2019, respectively. Ismail and Najib [5] identifies that higher water
conductivity could be due to the water discharges from Kurau River that carried along with sediments
and a high level of inorganic pollutants based on non-point sources. There was an insignificant
difference in the mean conductivity among the sampling stations (p>0.05).
    From table 2, the result indicated the range of mean TDS reading between 16.26 ± 0.98 to 18.2 ±
0.98 mg/L in November 2018 and 18.2 ± 0.58 to 19.5 ± 0.58 mg/L in February 2019. The highest mean
TDS was recorded at Station 1, 2, 3 and 5 in February 2019 whilst the lowest was found at Station 5.
The higher mean of TDS reading obtained from the study could be due to the non-point sources pollution
which includes industrial effluent and wastewater transported along Kurau River changed the water
balance due to the limiting inflow or increased precipitation which can cause changes in TDS
concentration [15]. Based on one-way ANOVA test, no significant difference in the TDS concentration
among sampling stations (p>0.05). From the data in table 2, it is apparent that February 2019 recorded
the lowest pH reading in Station 2 while November 2018 showed the highest reading in Station 1. Verma
and Singh [16] suggested that due to acid rains or any surface run-off discharged from nearby industries
or agriculture as well as sewage tends to change the pH of the water bodies. From the study, the pH
mean was significantly different among stations (One-way ANOVA, p0.05). The mean of water transparency was ranged between 31.0 ± 16.2 and 95.7 ± 13.55
cm. The highest mean of water transparency was recorded at Station 4 in February 2019 whereas the
lowest reading was recorded at Station 1 in November 2018. Run-off from the surrounding areas near
BMR including residential areas and urban development causing the increase of organic and inorganic
suspended solids, sediments, debris and silts in water bodies, thus contributed to the low water
transparency [17]. Thus, Station 1 recorded the lowest reading of water transparency as it was located
at the inlet of Kurau River carrying the inflow of run-off water. A study finding proves that Kurau River
is the major contributor of large sediment and nitrogen loading as it is the largest catchment area
compared to the other three river inlets [5].
    The mean TSS analyzed was ranged between 14.4 ± 2.12 to 43.73 ± 2.41 mg/L and 35.33 ± 2.81 to
71.73 ± 5.22 mg/L in November 2018 and February 2019, respectively. Station 3 in November 2018
recorded the lowest mean TSS while Station 2 in February 2019 recorded the highest mean TSS. This
could be probably due to the nearby development planning that causes high total suspended solids in
domestic discharges. There was no significant difference of TSS mean among sampling stations
(p>0.05). From table 2, Station 1 showed the lowest reading of mean chlorophyll-a concentration with
the value of 0.0003 ± 0.0003 μg/L while the highest was recorded at Station 2 with the value of 2018

                                                     6
International Conference on Tropical Limnology 2019 IOP Publishing
IOP Conf. Series: Earth and Environmental Science 535 (2020) 012023 doi:10.1088/1755-1315/535/1/012023
0.0544 ± 0.0937 μg/L, both in November 2018. There was an insignificant difference of the mean
chlorophyll-a concentration among the sampling stations (p>0.05). Artificial lakes received more
sediment loading due to increased shore erosion caused by higher fluctuations of water level [18, 19].
Consequently, lake turbidity was increased which then influenced the light penetration, Secchi depth
reading, and chlorophyll-a concentration. Thus, it explained the highest reading of mean chlorophyll-a
concentration in Station 2 as it located nearby to the development planning area. There is a significant
correlation between chlorophyll-a and phytoplankton density [20]. Eutrophication is related to high
productivity while nutrients especially nitrogen and phosphorus promote algal growth which causes high
chlorophyll concentration [21].
The mean orthophosphate concentration analyzed from the water collected in each station were
calculated and was ranged between 0.0132 ± 0.0007 mg/L to 0.0158 ± 0.0009 mg/L. Station 1 in
February 2019 recorded the lowest reading of mean orthophosphate concentration while Station 1 in
November 2018 showed the highest reading of mean orthophosphate concentration. Based on one-way
ANOVA test, there was no significant difference between the mean orthophosphate concentration
among sampling stations (p>0.05). Phosphate can enter the reservoir either being directly deposited in
the sediment as particulate form or integrated into organic matter by primary producers as dissolved
phosphate that eventually subsides into the water [22, 23]. Thus, explain the higher reading of mean
orthophosphate concentration in November 2018 due to the rainfall during the sampling period and
causing phosphate to enter the reservoir from the Kurau River inlet.
The mean of ammonia-nitrogen concentration in November 2018 ranged between 0.0042 ± 0.0065
to 0.3054 ± 0.2276 mg/L while in February 2019 ranged between 0.0158 ± 0.0085 to 0.3108 ± 0.4099
mg/L with the lowest mean of ammonia-nitrogen was recorded at Station 5 in November 2018 while the
highest reading was recorded at Station 4 in February 2019. Ammonia-nitrogen can enter the water body
through the residential sewage, industrial sewage, and animal wastes. Moreover, through the process of
denitrification, nitrate is converted to ammonium or free nitrogen (N 2) by bacterial activity that may
diffuse into the water phase and to the atmosphere and thus varnished from the system [23]. The amount
of ammonia in BMR is lower compared to the amount of nitrite and nitrate. In that study, the observation
showed that nitrite and nitrate remained in the reservoir while ammonia was removed from the reservoir
through the process of nitrification where bacteria present in the water break down the ammonia thus,
release the nitrogen gas into the atmosphere [5]. There was an insignificant difference of the mean
ammonia-nitrogen concentration among the sampling stations (One-way ANOVA; p>0.05).
Station 1 in February 2019 showed that the lowest mean of nitrite-nitrogen concentration recorded
reading which is 0.0169 ± 0.0003 mg/L and Station 4 showed the highest reading of 0.0373 ± 0.0314
mg/L in February 2019. As suggested by Ismail and Najib [5], the uptake by vegetation, denitrification
process and sedimentation are among the factors that lead to the increase amount of nitrite-nitrogen
especially in Station 4 where it is situated near to the Bukit Merah Laketown where sedimentation
activities due to soil erosion transported by the water from the laketown. Based on one-way ANOVA
test, there was no significant difference of nitrite-nitrogen concentration among the stations (p>0.05).
The mean of nitrate-nitrogen concentration in November 2018 ranged between 0.1235 ± 0.0157 to
0.1731 ± 0.0053 mg/L while in February 2019, mean of nitrate-nitrogen concentration ranged between
0.0943 ± 0.0060 to 0.1224 ± 0.0044 mg/L. Station 1 in February 2019 indicated the lowest mean
concentration of nitrate-nitrogen whilst the highest mean of nitrate-nitrogen concentration was recorded
at Station 1 in November 2018. In this study, the concentration of nitrate-nitrogen was the highest at all
sampling stations in November 2018. The variations in nitrate concentration were due to human
activities nearby the reservoir and its watershed which results from the leaching and run-off from the
nearby agricultural area and oil palm plantations near BMR [17]. This study showed that the rainy season
is the peak of agricultural activities near BMR also leads to an increase in the concentration of nitrate.
During the rainy season, the nitrate is soluble enough to get carried away by surface run-off, thus
increasing the concentration of nitrate in water bodies. Based on One-way ANOVA test, there was a
significant difference between the nitrate-nitrogen concentration among sampling stations (pInternational Conference on Tropical Limnology 2019 IOP Publishing
IOP Conf. Series: Earth and Environmental Science 535 (2020) 012023 doi:10.1088/1755-1315/535/1/012023
The mean of biological oxygen demand was ranged between 2.88 ± 0.60 mg/L and 11.27 ± 0.15
mg/L. The highest mean of biological oxygen demand was recorded at Station 5 in February 2019 while
the lowest mean concentration of BOD was recorded at Station 3 in November 2018. A study by
Akinbile et al [3] showed the concentration of BOD was in the range of 6 to 12 mg/L in the water
samples from Merah River and Jelutong River which also nearly similar in range with this recent study
in BMR. High BOD indicates a high number of microorganisms which suggest a high level of pollution
in the area. Thus, suggesting that Station 5 recorded a high mean of biological oxygen demand due to
its location at the outlet of the reservoir. It indicates that the water was rich with nutrients, mainly nitrates
and phosphates, before being outflowed from the reservoir. One-way ANOVA test indicated that there
was no significant difference between the BOD concentration among sampling stations (p>0.05).
8Table 2. The mean reading of all measured parameters during wet (November 2018) and dry season (February 2019)
Parameters November 2018 February 2019
Temperature (°C) 29.3 ± 0.94 to 31.3 ± 0.94 29.7 ± 0.34 to 30.5 ± 0.34
Dissolved Oxygen (mg/L) 5.3 ± 0.69 to 7.1 ± 0.69 7.1 ± 3.16 to 15.2 ± 3.16
Conductivity (S/m) 26.8 ± 0.56 to 28.1 ± 0.56 28.3 ± 0.75 to 30.2 ± 0.75
Total Dissolve Solid (ppm) 16.26 ± 0.98 to 18.2 ± 0.98 18.2 ± 0.58 to 19.5 ± 0.58
pH 5.99 ± 0.36 to 6.8 ± 0.36 5.89 ± 0.26 to 6.52 ± 0.26
Water transparency 31.0 ± 16.2 to 69.0 ± 16.2 61.8 ± 13.55 to 95.7 ± 13.55
Total Suspended Solid (mg/L) 14.4 ± 2.12 to 43.73 ± 2.41 35.33 ± 2.81 to 71.73 ± 5.22
Chlorophyll-a (μg/L) 0.0003 ± 0.0003 to 0.0544 ± 0.0937 0.0050 ± 0.0029 to 0.0230 ± 0.0172
Orthophosphate (mg/L) 0.0140 ± 0.0015 to 0.0158 ± 0.0009 0.0132 ± 0.0007 to 0.0137 ± 0.0007
International Conference on Tropical Limnology 2019
Ammonia-nitrogen (mg/L) 0.0042 ± 0.0065 to 0.3054 ± 0.2276 0.0158 ± 0.0085 to 0.3108 ± 0.4099
9
Nitrite-nitrogen (mg/L) 0.0171 ± 0.0019 to 0.0318 ± 0.0187 0.0171 ± 0.0019 to 0.0318 ± 0.0187
Nitrate-nitrogen (mg/L) 0.1235 ± 0.0157 to 0.1731 ± 0.0053 0.0943 ± 0.0060 to 0.1224 ± 0.0044
Biological Oxygen Demand (mg/L) 2.88 ± 0.60 to 4.19 ± 0.46 3.87 ± 0.30 to 11.27 ± 0.15
IOP Conf. Series: Earth and Environmental Science 535 (2020) 012023
IOP Publishing
doi:10.1088/1755-1315/535/1/012023International Conference on Tropical Limnology 2019 IOP Publishing
IOP Conf. Series: Earth and Environmental Science 535 (2020) 012023 doi:10.1088/1755-1315/535/1/012023
3.2 Water Quality Analysis Simulation Program (WASP)
Table 3 showed the physical parameters of BMR including reservoir surface area (km²), mean depth (m),
reservoir volume (mil m³) and maximum depth (m³) which were obtained from DID [6] for the calibration
and validation purposes. An analytical model which involved basic steady-state equation developed by
Streeter and Phelps [13] was used for dissolved oxygen (DO) and biological oxygen demand (BOD). The
value of reaeration rate, BOD loading, and BOD decay rate were obtained by substituting BOD mean
concentration, DO mean concentration and DO saturation level in the steady-state equations for data input
in the eutrophication model. By using the eutrophication model in WASP, the graph of DO and BOD
concentration were simulated. Although the sampling was done for one day, the simulation was run to one-
month period to predict DO and BOD variation for a longer time by adjusting the time range for the start
date and end date in the data set.
Table 3. Brief information and technical data of Bukit Merah Reservoir, Perak, Malaysia [6]
Reservoir surface area (km²) 41
Mean depth (m) 2.5
Reservoir volume (mil m³) 83
Maximum depth (m) 5.3
Table 4 shows all the value of parameters for dry and wet seasons which need to be input in the
appropriate section in WASP model. DO saturation level and BOD decay rate are constant value while DO
and BOD mean concentrations were taken from the field data. The value of the reaeration rate and BOD
loading were obtained from the calculation.
Table 4. Value of parameters for the dry and wet season
Value (wet season) Value (dry season)
BOD mean concentration, mg/L (l) 3.33 8.11
DO mean concentration, mg/L (C) 6.3 11.48
DO saturation level, mg/L (Cs) 6.3 7.54
Reaeration rate, dayˉ¹ ($) 1.0742 -0.8223
BOD loading, mg/L/day (") 1.332 3.24
BOD decay rate, dayˉ¹ (!) 0.4 0.4
Data were obtained when the WASP model was executed, and the results were displayed in the form of
graph (x/y plots). The graph configuration menu which creates an x/y plot was obtained along with the data
that is being plotted in x/y window. In the x/y plot, the predicted values of DO and BOD in November 2018
and February 2019 in one segment were presented in BMR.
The DO and BOD mean concentrations in BMR were input into the model and the output for the daily
concentrations of the DO and BOD were provided by the model for one segmentation in November 2018
and February 2019 which represented the wet and dry seasons, respectively. In order to make the predicted
value equal to the actual value, the parameters were adjusted.
Figure 3 shows that in November 2018, the mean DO concentration increased to 6.35 mg/L and
converged to the mean value of 6.31 mg/L. Figure 4 shows that in November 2018, BOD concentration
increased and converged to the mean value of 3.33 mg/L. Figure 5 shows that in March 2018 the mean DO
concentration increased and converged to the mean value of 11.48 mg/L. Figure 6 shows that in February
2019, BOD concentration decreased and converged to 3.33 mg/L.
WASP was used to validate the calculation to make sure that other parameters including DO saturation
level, BOD loading, BOD decay rate and reaeration rate values are reflected in the simulation graph. In the
wet season, which is represented by figure 3 shows that the mean DO concentration increased to 6.35 mg/L
and converged to the mean value of 6.31 mg/L; while, according to figure 4, BOD concentration increased
10International Conference on Tropical Limnology 2019 IOP Publishing
IOP Conf. Series: Earth and Environmental Science 535 (2020) 012023 doi:10.1088/1755-1315/535/1/012023
and converged to the mean value of 3.33 mg/L. Hence, it is proven that the calculation and the values
obtained for DO saturation rate, BOD loading, BOD decay rate and reaeration rate of this study in table 4
are correct as it reflects the exact data obtained from the field. Although the sampling was done for one
day, the simulation was run to one-month period to predict DO and BOD variation for a longer time.
Figure 3. The x/y plot of the concentration of DO (mg/L) in BMR from November 2018 to December 2018
(wet season).
Figure 4. The x/y plot of the concentration of BOD (mg/L) in BMR from November 2018 to December
2018 (wet season)
As for the dry season, which is represented by figure 5 shows that the mean DO concentration increased
and converged to the mean value of 11.48 mg/L, while according to figure 6, BOD concentration decreased
and converged to 3.33 mg/L. The high value of DO and BOD may be affected due to the high rate of
11International Conference on Tropical Limnology 2019 IOP Publishing
IOP Conf. Series: Earth and Environmental Science 535 (2020) 012023 doi:10.1088/1755-1315/535/1/012023
photosynthetic activity by algae productivity during the dry season because present study shows that the
chlorophyll-a concentration was higher in February 2019 compared to November 2018.
Figure 5. The x/y plot of the concentration of DO (mg/L) in BMR from February 2019 to
March 2019 (dry season)
Figure 6. The x/y plot of the concentration of BOD (mg/L) in BMR from February 2019 to
March 2019 (dry season)
In this study, only the values of DO and BOD were used to simulate data. For the simulation of
chlorophyll-a and other parameters including phosphorus and nitrogen, longer period are required and more
samplings are needed to be done in order to interpret and predict the long term water quality responses
towards the natural phenomena that take place along with manmade pollution and it is beyond the scope of
this project.
12International Conference on Tropical Limnology 2019 IOP Publishing
IOP Conf. Series: Earth and Environmental Science 535 (2020) 012023 doi:10.1088/1755-1315/535/1/012023
Moreover, the limitation of the model is that it discretizes the lake system into a specific number of
segments in which it depends on the location of sampling sites followed by the prediction of the variations
in the parameters on a segment-wise basis [12]. Different categories of data must be collected separately
including the water volume in different segments, inflow and boundary characteristics, and environmental
constants [12]. Therefore, only one segment is simulated in this study because the data for DO and BOD
are almost constant throughout different locations in the reservoir for the initial study. In addition, only a
limited number of water quality parameters which are orthophosphate, dissolved oxygen and nitrate can be
predicted by WASP. This model reflects the current condition of DO and BOD level in the reservoir, but
in the future there is a need to divide the reservoir into segments in order to obtain a more realistic and
accurate prediction of the Bukit Merah Reservoir.
4. Conclusion
All the physico-chemical parameters measured showed variations among the sampling stations. BMR
provides many essential functions to the surrounding areas including domestic water supply and support
big-scale agriculture activities. However, human activities and urbanization that occur surrounding BMR
could contribute to the degradation of water quality in BMR. Thus, it is important to have regular water
quality monitoring to make sure that the water quality is safe enough to continue providing services.
In the present study, WASP was used to validate the calculation to make sure that other parameters
including DO saturation level, BOD loading, BOD decay rate and reaeration rate values are reflected in the
simulation graph. This model reflects the current condition of DO and BOD level in the reservoir, but in
future there is a need to divide the reservoir into segments in order to obtain a more realistic prediction. The
accuracy of the prediction can be improved with more input of water quality data.
5. References
[1] Sharip Z and Zakaria S 2008 Lakes and Reservoir in Malaysia: Management and Research
Challenges Proceeding of Taal 2007: The 12 th World Lake Conference pp 1349-1355
[2] Huang Y F, Ang S Y, Lee K M and Lee T S 2015 Quality of Water Resources in Malaysia Research
and Practice in Water Quality, INTECH 65
[3] Akinbile C O, Yusoff M S, Talib S H A, Hasan Z A, Ismail W R and Samsudin U 2013 Qualitative
analysis and classification of surface water in Bukit Merah Reservoir in Malaysia Water Science
and Technology: Water Supply 13 (4) 1138
[4] Qin B, Gao G, Zhu G, Zhang Y, Zong Y, Tang X, Xu H and Deng J 2013 Lake Eutrophication and
its Ecosystem Response Chin Sci Bul l. 58 961 – 970
[5] Ismail W R and Najib S A M 2011 Sediment and Nutrient Balance of Bukit Merah Reservoir, Perak,
Malaysia Lake and Reservoirs: Research and Management 16 179-184
[6] Drainage and Irrigation Department (DID) 2012 Kerian, Perak, Malaysia. http//www.water.gov.my
(Accessed 20th September 2018)
[7] Hassan Z A, Hamidon N, Yusof M S and Ghani A A 2012 Flow and Sediment Yield Simulation of
Bukit Merah Reservoir Catchment, Malaysia: A Case study Water Science and Technology 66
(10) 2170-2176
[8] Siti Hidayah B A T 2012 Study on the Influence of Water Quality and Sediment Deposition on the
Delta Formation at Bukit Merah Reservoir PhD Thesis (Pulau Pinang: Universiti Sains Malaysia)
(unpublished)
[9] American Public Health Association 2005 Standard Methods for the Examination of Water and
Wastewater (22nd ed) (Washington D.C: American Water Works Association and Water Pollution
Control Federation)
[10] Boyd C E and Tucker C S 1992 Water Quality and Pond Soil Analyses for Aquaculture
(Alabama: Alabama Agricultural Experiment Station, Auburn University)
[11] Boyd C E 1982 Water Quality Management for Pond Fish Culture Developments in Aquaculture and
Fisheries science 9 (Amsterdam: Elsevier) 318
[12] Moses S A, Janaki L, Joseph S and Joseph J 2015 Water Quality Prediction Capabilities of WASP
13International Conference on Tropical Limnology 2019 IOP Publishing
IOP Conf. Series: Earth and Environmental Science 535 (2020) 012023 doi:10.1088/1755-1315/535/1/012023
Model for a Tropical Lake System Lakes & Reservoirs: Research & Management 20 (4) 285-99
[13] Streeter W and Phelps E B 1925 A Study of the Pollution and Natural Purification of the Ohio River
(Washington D.C: United States Public Health Service)
[14] Mollah M F A, Moniruzzaman M and Rahman M M 2011 Effects of Stocking Densities on Growth
and Survival of Thai Sharpunti (Barbonymus gonionotus) Earthen Ponds 9 (2) 327
[15] Weber-Scannell P K and Duffy L K 2007 Effects of Total Dissolved Solids on Aquatic Organisms:
A Review of Literature and Recommendation for Salmonid Species American Journal of
Environmental Sciences 3 (1) 1–6
[16] Verma A K and Singh T N 2013 Prediction of Water Quality from Simple Field Parameters Environ
Earth Sci 69 821–829
[17] Mustapha M K 2008 Assessment of the Water Quality of Oyun Reservoir , Offa , Nigeria , using
Selected Physico-Chemical Parameters Turkish Journal of Fisheries and Aquatic Sciences 8 (2)
309–319
[18] Wang H J, Wang H Z, Liang XM and Wu S K 2014 Total Phosphorus Thresholds for Regime Shifts
Are Nearly Equal in Subtropical and Temperate Shallow Lakes with Moderate Depths and Areas
Freshwater Biology 59 (8) 1659-167
[19] Wurtsbaugh W A 2014 The Great Salt Lake Ecosystem (Utah, USA): Long Term Data and A
Structural Equation Approach: Comment Ecosphere 5 (3) 36
[20] Aimi S, Najib M, Ismail W R and Omar M A 2017 Suspended Sediment and Phosphorus Budget and
Trophic Status of Bukit Merah Reservoir, Perak, Malaysia Journal of Environmental Geography
10 (3-4)
[21] Sondergaard M, Jensen P J and Jeppesen E 2001 Retention and Internal Loading of Phosphorus in
Shallow, Eutrophic Lakes The Scientific World Journal 1 427-442
[22] Balali S, Hoseini A, Ghorbnia R, Kordi H and Khozani E A 2013 Relationships between Nutrients
and Chlorophyll a Concentration in the International Alma Gol Wetland, Iran International
Journal of Aquatic Biology 1 (2) 68
[23] Talib S H A, Yusoff M S, Hasan Z A, Ismail W R and Abustan M S 2016 Nutrient Concentration
Distribution in Sediment and Overlying Water at Bukit Merah Reservoir, Perak MATEC Web of
Conferences, 47, 05004 https://doi.org/10.1051/matecconf/20164705004
Acknowledgements
The author would like to thank the Kerian District Department of Irrigation and Drainage for their
hospitality during our sampling activities and not forgetting the staff and other researchers who have
contributed in completing this research.
14You can also read