Weekly Construction Update
←
→
Page content transcription
If your browser does not render page correctly, please read the page content below
(Updated – 07 January 2022)

                           Weekly Construction Update

LATEST INFORMATION
    1) IHS Markit/CIPS UK Manufacturing PMI (December 2021):
The IHS Markit/CIPS UK Manufacturing PMI rose to 57.9 in December, marginally above November's
58.1. 50.0 = no monthly change and the PMI has now been higher than this level for 19 months.

Output was underpinned by rising intakes of new business as domestic market conditions strengthened
but the trend in exports remained negative for the fourth month. Manufacturers reported that logistic
issues, Brexit difficulties and the potential for further pandemic restrictions had hit export demand.
Employment increased for the twelfth successive month and firms linked this to meeting improved
demand, rising backlogs of work and efforts to address staff shortages. Capacity remained a serious issue
with a further increase in outstanding business in December.

63% of manufacturers forecast that production would increase over the next 12 months, compared to
only 6% expecting a contraction. The optimism reflected expectations of renewed global economic
growth, planned investment and hopes for less pandemic disruption, Brexit and supply chain issues.
December saw a further increase in average input prices, with the rate of inflation staying amongst the
highest on record with reports of higher costs for chemicals, electronics, energy, food products, metals,
timber and wood. Freight, shipping and air transportation costs were also higher whilst ongoing supply
disruptions, raw material shortages and issues relating to Brexit and the pandemic also led to higher
costs. The rate of increase in factory gate selling prices accelerated to a record high as companies
passed on rising costs to customers.

                                                                                                        1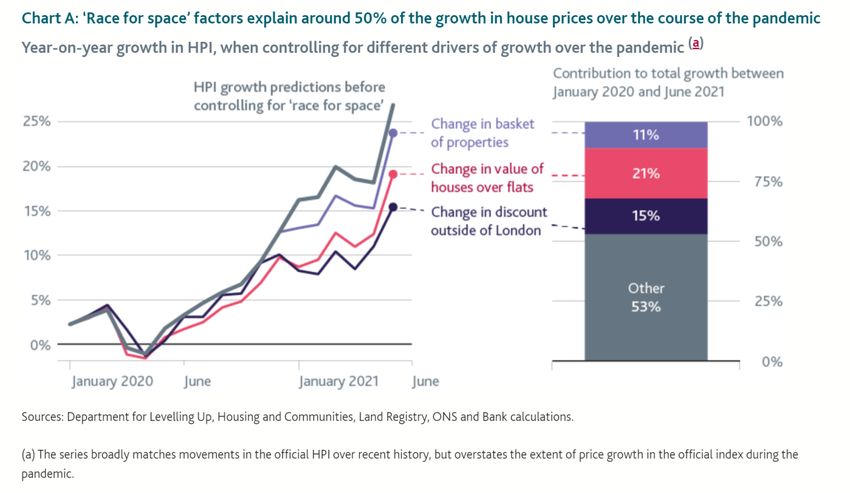
2) IHS Markit/CIPS UK Services PMI (December 2021):
Whist manufacturers benefited from a rise in activity during December, the IHS Markit/CIPS UK
Services PMI fell from 58.5 in November to 53.6 in December. Given that 50.0 = no monthly change,
this still represents monthly growth but at a considerably slower rate than previously.

Services that involve consumer-facing operations such as travel, leisure and hospitality businesses
unsurprisingly reported a sharp fall in activity due to tighter pandemic guidance from the government
and cancelled events during the festive period. Where services growth was reported, this was due to
services that related to other sectors of the UK economy that experienced growth in December.

New orders slowed to their lowest rate since the end of the third national lockdown in March 2021.
Export orders declined for the first time in six months primarily due to renewed travel restrictions.
Companies in services reporting an increase in unfinished business that was often to staff absences and
ongoing supply shortages.

Higher prices for energy, fuel, transport and raw materials led to another sharp increase in average
costs in December. Services firms also reported that increased staff salaries in a highly competitive
labour market conditions led to an increase in costs. As a result, average prices charged by services
firms increased rapidly in December as firms tried to pass cost increases on to clients. Strong
employment growth was maintained across the service economy at the end of 2021, despite shortages
of available candidates. Strong job creation reflected expectations of higher business activity during
December and was in line with levels seen a year earlier.

                                                                                                          2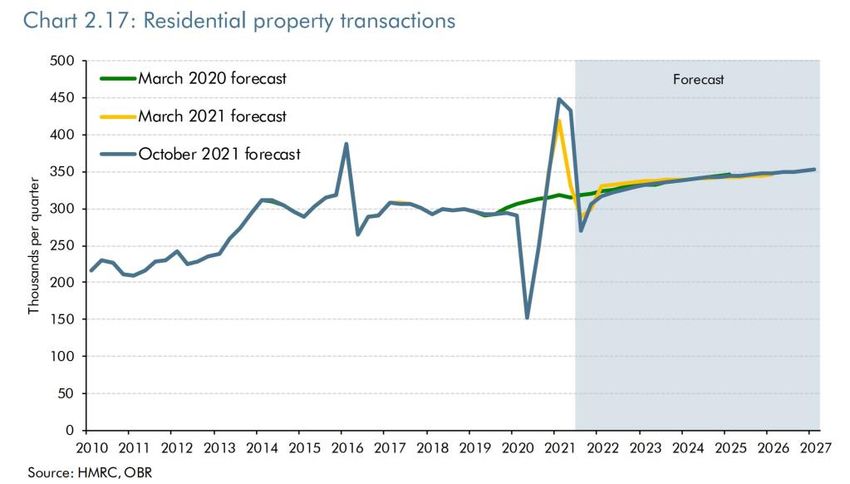
3) IHS Markit/CIPS UK Construction PMI (December 2021):
The IHS Markit/CIPS UK Construction PMI was 54.3 in December, lower than the 55.5 in November.
50 = no monthly change so further growth in construction activity in December but at a slower rate
than a month ago and at its slowest rate since September. Some firms noted that tighter pandemic
restrictions and rising infections and absences had slowed recovery, especially in the commercial sector.

Within the PMI in December, the fastest growth (55.3) was in house building, which accelerated in
December as house builders rushed to complete properties for year-end targets whilst the PMI for
commercial activity was 53.6, still growth in work but at its slowest rate since September. The PMI for
civil engineering activity was 49.1 in December, highlighting falling civils activity after 9 months of growth.

Customer demand was relatively strong in December although some firms reported delayed decision-
making due to the Omicron variant. Higher fuel, energy and raw material prices continued to push up
costs across construction in December but the rate of inflation eased for the fourth month and supplier
lead times lengthened to the least marked extent since November 2020. Where longer wait times were
reported, this was mostly linked to international shipping delays and shortages of haulage drivers.

                                                                                                             3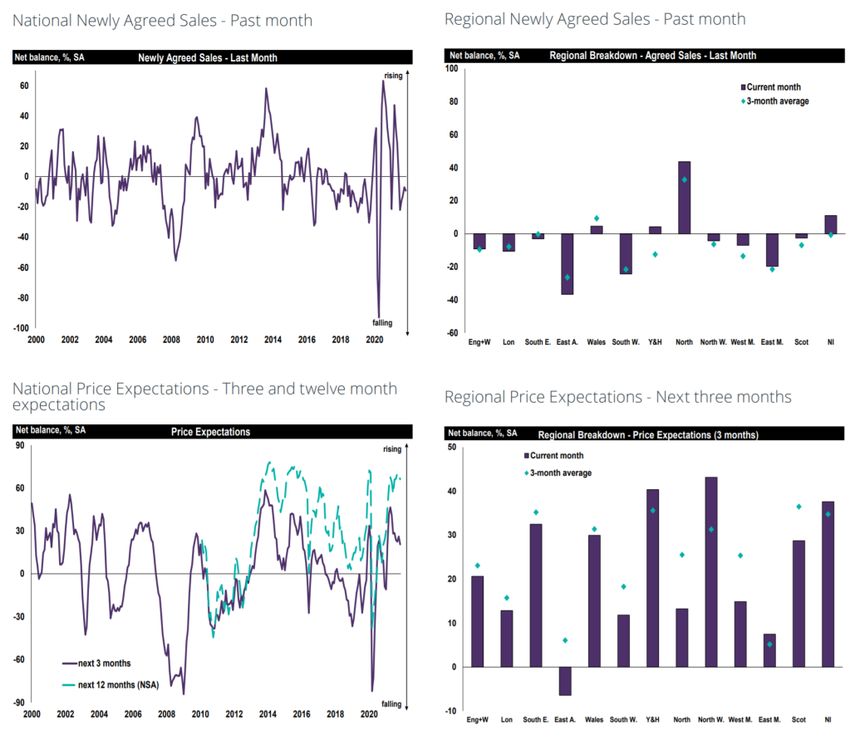
4) Halifax UK House Price Index (December 2021):
Halifax reported that UK house prices rose for the sixth consecutive month in December. The average
house price in the UK was £276,091, 1.1% higher than in November and 9.8% (£24,500) higher than a
year ago. It stated that in 2021 the average house price reached new record highs on eight occasions
“despite the UK being subject to a lockdown for much of the first six months of the year” although
arguably it should be ‘partly because of’ rather than ‘despite’. It also stated that the lack of spending
opportunities afforded to people whilst restrictions were in place helped boost household savings as
well as the Stamp Duty holiday and the race for space as a result of homeworking will have encouraged
buyers to bring forward home purchases they’d maybe planned for this year. The extension of the
Government’s job and income support schemes also supported the labour market and may have given
some households the confidence to proceed with purchases. A lack of available homes for sale, and
historically low mortgage rates, have also helped drive annual house price inflation.

Wales remained the strongest performing nation or region in the UK in December with annual house
price inflation of 14.5%. However, the rate of increase is slightly down from the 14.8% rise recorded in
November. In England, the North West was the strongest performing region (11.8%), followed by the
South West. Despite registering a strong quarterly rise in prices of 2.9%, up from 1.1% in November,
London remained the weakest performing region for annual house price inflation in December at 2.1%.

It also stated that looking ahead, the prospect that interest rates may rise further this year to tackle
rising inflation and increasing pressures on household budgets suggest house price growth will slow
considerably. Halifax’s expectation is that house prices will maintain their current strong levels, but that
growth relative to the last two years will be at a slower pace.

                                                                                                               4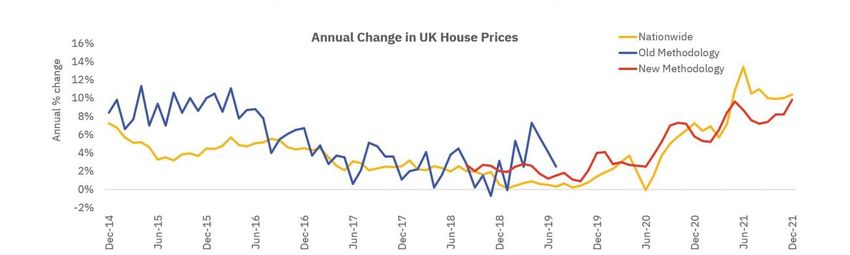
5) Bank of England UK Mortgage Approvals (November 2021):
There were 66,964 UK mortgage approvals in November 2021 (post-stamp duty holiday and with a
more constrained version of Help to Buy), which was 0.2% lower than in October and 35.7% lower than
a year ago (prior to the original deadline for both policies) as UK mortgage approvals return to the pre-
Covid-19 average as expected.

Mortgage approvals in November 2021 were also 2.4% than the average of level of mortgages between
2018 and 2019 as well as being back to the level of mortgage approvals seen between 2014 and 2019.

                                                                                                        5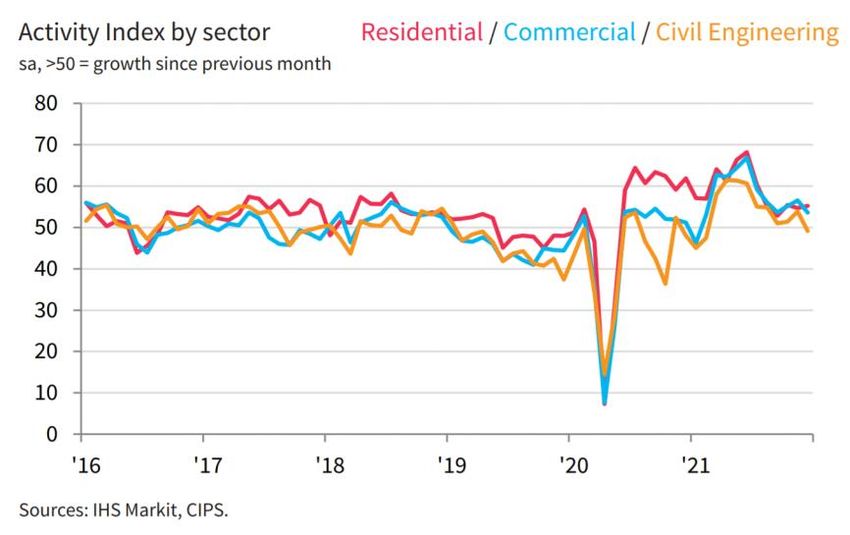
EXISTING INFORMATION – Construction
ONS CPI Inflation (November 2021) and Bank of England Interest Rate Rise (December 2021): UK
Consumer Prices Index (CPI) inflation rose by 5.1% in the 12 months to November 2021, up from 4.2%
in October, it’s highest level since September 2011 and has consistently exceeded macroeconomic
forecasts. At the time that the CPA did its Autumn forecasts, the Bank of England was anticipating that
CPI inflation would peak at just over 4.2% in 2021 Q4 and more recently the Bank estimated that
inflation would exceed 5.0% in Spring 2022. However, now the Bank anticipates CPI inflation hitting 6.0%
in Spring 2022, which would be its highest level since March 1992.

The high rate of inflation and given strong UK employment market data this week would generally point
towards the Bank of England raising interest rates and the Bank raised its base rate from 0.1% to 0.25%.
However, markets were not anticipating this rise (and neither were most forecasters including the CPA)
as the uncertainty regarding the impacts of the Omicron Covid-19 variant on the UK economy
suggested that the Bank may have been cautious and waited until February to raise interest rates after
seeing the impact of the Omicron variant of Covid-19 and any consequent restrictions on the UK
economy. This is particularly the case as raising interest rates may suppress demand side inflation but is
unlikely to assist supply issues currently affecting many sectors and causing cost inflation.

It is worth noting that the ONS stated the main contributors to the rise in inflation were the prices of
petrol and second-hand cars. There were upward contributions to inflation across almost all goods and
services, implying broad price pressures across the economy and one of the reasons inflation has been
high in the goods sector was that manufacturing input prices rising at an annual rate of 14.3% in
November, which meant that prices charged by UK manufacturers rose by 9.1% compared with a year
ago. However, the Bank of England’s preferred measure of underlying services inflation (which excludes
transport, package holidays and education remained at 2.8% in November, only above its average of
2.4% between 2010 and 2020 due a rise in VAT.

ONS Construction Output (October 2021): According to the ONS, construction output in October
2021 fell by 1.8% compared with September (it's sharpest fall since the initial Covid-19 lockdown) and
construction output has fallen for 5 of the 10 months this year. Leaving aside the data measurement
issues that the ONS appears to be facing, the ONS reports that construction output in October 2021
was 3.3% higher than a year earlier but still 3.6% lower than in January 2020 (pre-Covid-19).

                                                                                                           6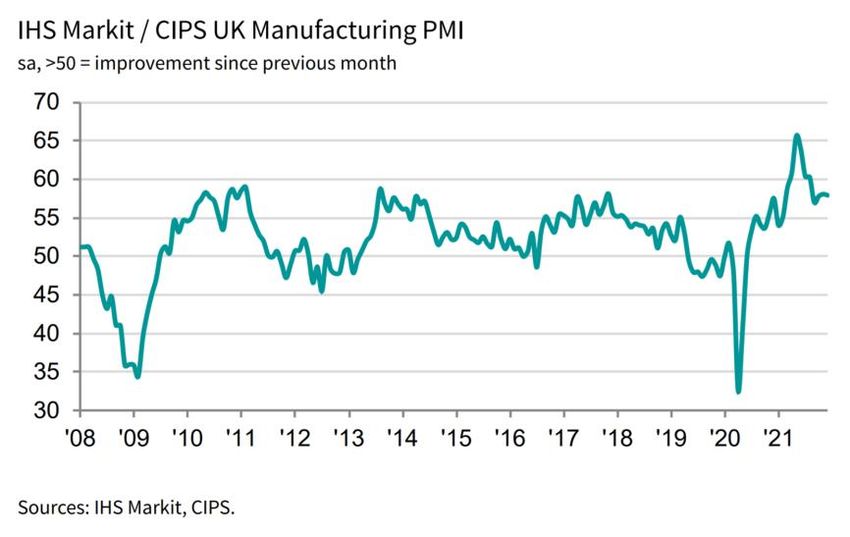
Looking across the sectors since January 2020, according to the ONS in October 2021 output in:
   •   Infrastructure fell by 7.1% but was 40.3% higher than a year ago and 31.7% higher than in January 2020
   •   Private housing rm&i fell by 1.2% and was 5.7% lower than a year earlier but 11.1% higher than in January 2020
   •   Private housing fell by 4.4% and was 3.7% lower than a year ago as well as 12.7% lower than in January 2020
   •   Industrial fell by 8.9% but was 15.0% higher than a year ago although still 9.6% lower than in January 2020
   •   Commercial rose by 0.1% but was 8.0% lower than a year earlier and 27.0% lower than in January 2020

Illustrating the issues that the CPA has with the ONS construction output data currently, according to
the ONS, private housing output has fallen in 5 of the 10 months this year and in October 2021 private
housing output was still 13% lower than in January 2020, which is difficult to square with major house

                                                                                                                        7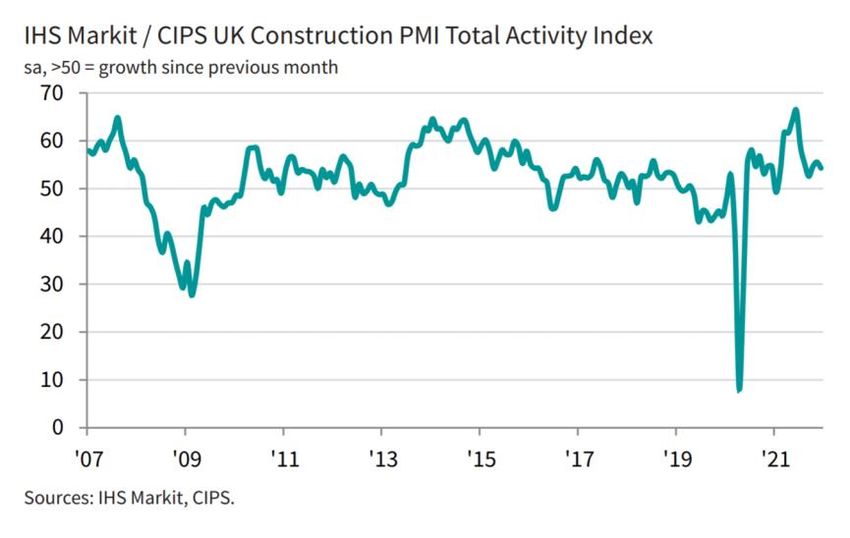
builder trading statements during this year as well as other housing-related data such as brick sales,
which are above pre-Covid-19 levels.

Looking at brick sales and construction output, the general direction of travel has been similar since
January 2020 with similar upticks in activity in March 2021 and a dip in April 2021 although clearly not all
bricks go into house building. However, Since April this year, brick sales have gradually been rising whilst
private housing output has been gradually falling. In October 2021, brick sales were 4.3% higher than in
April whilst private housing output in October was 7.6% lower than in April.

ONS Construction New Orders (2021 Q3): Construction new orders in 2021 Q3 were 9.2% lower
than in Q2 and 5.5% lower than the 2015-18 average but 5.9% higher than the 2019 average (although
construction investment in 2019 was affected by political/economic uncertainty) according to the ONS.

                                                                                                          8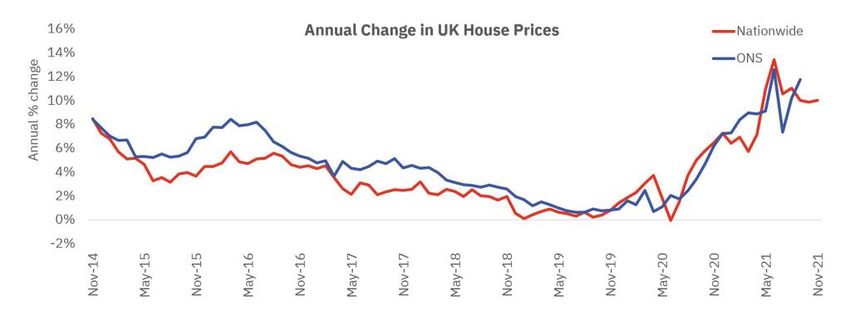
The quarterly decline in 2021 Q3 was primarily due to falls in new orders in commercial (-22.1%) and
industrial (-6.3%), partially offset by rises in new orders in infrastructure (25.5%), housing (5.3%) and
public non-housing, schools and hospitals, (14.2%).

The fall in construction new orders in Q3 compared with the average of 2015-18 is primarily due to the
large HS2 orders in 2017 so infrastructure orders were coming from a high base (and inevitably Q3 had
a sharp decline in infrastructure orders).

                                                                                                            9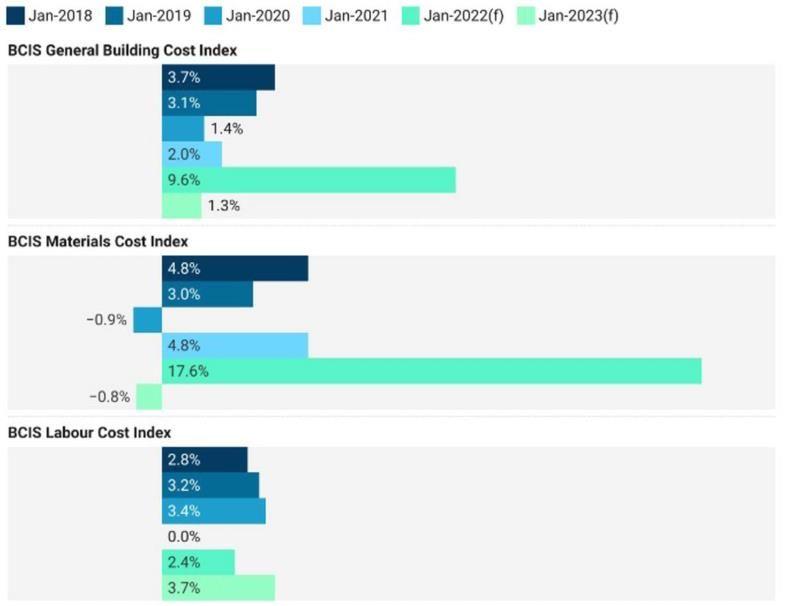
ONS UK Construction Age Demographic Issue (2021 Q2): The CPA has consistently highlighted over
the last few years the age-demographic issues within UK construction, in that the spike in the age-
demographic in UK construction has been in those over 50 years old (blue line), which implies that UK
construction would be losing one-quarter of its workforce in the next 10-15 years. However, looking at
construction employment by age in 2019 Q2 and 2021 Q2.

What is potentially concerning is that the spike in the age-demographic of over 50s in 2019 Q2 is no
longer there (green line) due to a sharp loss (over 90,000) in older construction workers. This could be
because they have retired early, it may also be that older workers have temporarily stopped working as
construction is too much hassle (due to reverse-charge VAT, P.I. insurance inflation, materials cost and
availability issues etc.), it may be they have moved to another sector and/or it may be a data issue.

It will only be entirely clear after data post-furlough and self-employment income support plus as
construction returns to 'new normal' without supply issues but if it is due to early retirement
construction will face major labour availability issues near-term not just over the next 10-15 years.

BEIS UK-EU Trade Volumes in Construction Products (2021 Q3): UK construction products import
volumes from the EU in 2021 Q3 rose by 1.8% compared with Q2 and were 13.8% higher than in Q1,
which was immediately after the end of the Brexit implementation period. Despite this recovery, UK
imports of construction products from the EU remain 6.2% lower than the average level between 2016
and 2018 prior to Brexit deadline uncertainty and Covid-19 issues. This is despite a lack of availability of
some imported construction products. It is, however, in line with indications the CPA has that,
immediately after the end of the implementation period in 2021 Q1, large firms experienced some initial
disruption but had largely sorted out processes to deal with import issues. However, small firms

                                                                                                          10
importing continue to report difficulties and additional costs importing despite full checks not being
implemented on EU imports as yet (due to come in next year).
Initially after the end of the Brexit implementation period, the greater construction products trade
issues were for firms from the UK exporting to the EU (which has implemented full checks). UK
exports to the EU fell by more than half during the first quarter of 2021. However, exports have
recovered during the most recent two quarters. In 2021 Q3, exports to the EU were 19.0% higher than
in Q2 and more than double their level in Q1. Exports to the EU in Q3 were also only 0.5% lower than
the average level between 2016 and 2018.
ONS UK Construction Average Wages Inflation (October 2021): In the 3 months to October 2021, UK
construction total pay was 5.5% higher than a year ago and it has slowed since June whilst building mate-
rials inflation was 23.8% and continued to rise throughout this year. Labour inflation slowing was primar-
ily due to the freeing up of labour as the furlough scheme was phased out (increasingly relying on em-
ployers contributing and then ending in September).
11The continued acceleration of materials inflation is due to a variety of supply issues; the availability and
cost of imports (exacerbated by ports delays and shipping cost rises), the availability of some domestic
materials (exacerbated by input and energy cost rises and a shortage of HGV drivers). The key issue is
which part of the construction supply chain is taking the hit from the sharp cost rises and how
sustainable is it given the weightings of labour and materials in different parts of construction.
Major house builders are best able to deal with the materials cost inflation issues as they have greater
certainty of demand and can plan, purchase and stock in advance. Some majors such as Persimmon and
Redrow reported in November that they had build cost inflation of 'around 5%' this year so double-digit
land/house price inflation means they can absorb cost rises whilst housing renovation firms have so far
been able to pass cost rises on to homeowners but whether this will be the case after homeowners feel
the impacts of rising energy costs and general inflation over the next 3-6 months is another matter.
However, the part of the construction supply chain worst affected by the rising cost inflation is non-
specialist sub-contractors, especially those on fixed price contracts that they signed up to 12-18 months
ago.
BCIS UK Building Cost Inflation Forecasts (November 2021): Building Cost Information Services (BCIS,
the RICS’s cost consultancy division) published its latest forecasts of building, materials and labour costs
in the year to January 2022 and January 2023.
Year to January 2022 Year to January 2023
12Overall Building +9.6% +1.3%
Materials +17.6% -0.8%
Labour +2.4% +3.7%
The cost inflation in the year to January 2022 appears to be an underestimate on both materials and, in
particular, the labour side in my view but, clearly it will vary considerably by construction region and
sector. The cost inflation forecasts in the year to January 2023 will be heavily dependent on the
persistence of high energy costs/oil prices (as inputs to construction products manufacturing) in addition
to the reaction of construction demand to strong cost inflation.
ONS UK Construction Employment (2021 Q3): UK construction employment was 2.2 million in 2021
Q3, 3.7% higher than in Q2 and 3.3% higher than a year ago. However, UK construction employment in
Q3 remained 9.4% lower than at the recent peak of 2019 Q1 despite skills shortages in some key
hotspots, which suggests that we are seeing the impacts of increases in early retirement of construction
trades and the fall in EU construction workers constraining growth construction activity (albeit not as
much as products availability).
13Looking at the gender breakdown, there were 1.89 million men and 0.31 million women in UK
construction. Compared with the recent peak of 2019 Q1, employment in Q3 was 11.1% lower for men
(for whom employment is highly skewed to trades) but it was 2.8% higher for women.
The proportion of women in UK construction has been at its highest on record this year (albeit still only
14.1% in 2021 Q3), which partly reflects a slight rise in the number of women but it also reflects a sharp
fall in men in construction.
14DHLUC Net Additional Homes (2020/21): Net additional homes (UK government's measure for its
300,000 new homes per year by the mid-2020's target) in 2020/21 were 216,490, which is 11% lower
than in 2019/20 according to the Department for Levelling Up, Housing and Communities. This is
unsurprising given the impact of the initial Covid-19 lockdown in Spring 2020 but it means for
government to achieve its 300,000 new homes per year by the mid-2020's target there needs to be a
38.6% rise in house building in the next 4 years.
Looking at the breakdown of net additional homes in 2020/21, there were 11% falls in new housing
completions, conversions (e.g. changing a house into flats) and changes in use (e.g. changing an office into
flats) whilst demolitions fell by 31%. Demolitions have been on a long-term downward trend, As a
proportion of the dwelling stock, last year's demolition rate was just 0.02%, one-fifth of the rate up to
the mid-2000s. At 2006-7 demolition levels, the housing stock would be renewed every 990 years. At
today's rate, it would be renewed every 4,200 years.
15BEIS UK Brick Sales (October 2021): UK brick sales (which are a useful proxy measure for house
building) in October 2021 were 1.9% higher than in September 2021 but 2.0% higher than a year earlier
according to the Department for Business, Energy and Industrial Strategy.
UK brick sales in October 2021 were 4.3% higher than the average during 2019 but appear to be re-
turning to around pre-Covid-19 average levels on a monthly basis and year-to-date (January-October),
UK brick sales in 2021 were 32% higher than during (Initial lockdown affected) 2020 and 3.1% lower
than in 2019.
16Demand for new housing remains high and is likely to do so for at least the next 6-9 months but what
will be interesting to see (i.e. what is uncertain) will be the extent to which further growth is possible
given all the different supply issues that currently exist within the supply chain, which are not going to
get sorted out quickly.
RICS UK Residential Market Survey (November 2021): The November 2021 RICS UK Residential
Survey results point to a lack of supply holding back market activity. Despite new buyer enquiries rising
over the month, a slightly softer trend in agreed sales was again cited alongside a further decline in new
listings.
This constrained supply is underpinning price growth. At the national level, a net balance of +13% of
respondents reported an increase in new buyer enquiries during November, marginally up on reading of
+11% but the agreed sales indicator remains modestly negative, posting a net balance of -9 compared
with -7% last month).
Going forward, respondents remain slightly more upbeat regarding the prospects for sales over the
coming three months, with the near-term expectations net balance registering a value of +15%. Further
ahead, the twelve-month sales expectations series also remains moderately positive, at +12% (slightly
stronger than the figure of +4% returned last month).
The lack of stock available on the market is sustaining competition amongst would-be buyers, with the
upshot being that house prices continue to be pushed higher. During November, a headline net balance
of +71% of survey participants cited an increase prices, identical to October’s reading and the survey
feedback points to house price inflation remaining very consistent at a strong pace over the past four
months.
17All parts of the UK continue to see robust growth in house prices with Wales, the North West of
England and the West Midlands leading the way. Even though house price growth in London appears to
be lagging the rest of the country to a certain degree, the latest net balance of +51% is still well above
the long run average of +12% in the capital. Looking ahead, prices are expected to continue to drift
higher at the national level, both over the near term and further out. At the twelve-month time horizon,
a net balance of +66% of contributors envisage prices rising, with this indicator remaining in a tight range
of between +66% and +70% in each of the past five months.
ONS UK House Price Inflation (October 2021): The average UK house price in October 2021 was
£268,349 according to ONS/Land Registry, 1.1% lower than in September and 10.2% higher than a year
ago (compared to a 12.3% annual rise in September) and 41.2% higher than at the pre-financial crisis
peak. It is worth noting on the Bank of England's interest rate rise that mortgage rates remain considera-
bly lower than even the start of this year so even if lenders pass on the full rate rise (and potentially
more), rates will remain at historic low rates but the key for housing demand (prices) will be the signal-
ling impact and whether purchasers view this is the start of rates rising further and whether this signals
to purchasers that policymakers may not underpin demand in the housing market (house price inflation)
as much as previously.
18Within the 10.2% UK house price growth in the year to October 2021, the regions/nations with the
fastest house price rises were where affordability is high; the Wales (15.5%), East Midlands (11.7%) and
Scotland (11.3%) whilst Yorkshire & Humber (11.1%), the East of England (11.2%) and South East
(10.3%) also saw house prices rise by more than 10% in the year to October 2021 although house prices
rose by 'only' 6.2% in London over the year.
However, in £ rather than % the average UK house price rose by £24,773 in the year to October 2021
with the fastest house price rises in the South East (£34,394), East of England (£33,376) and London
(£30,073) due to higher initial house price levels.
19Compared with their February 2020 (pre-Covid-19) level, the average UK house price has so far risen
by £37,740 with the highest rises in the South East (£48,701), East of England (£43,198), South West
(£42,392) and London (£41,805).
Bank of England – House Price Growth and the ‘Race for Space’ (December 2021): Average UK house
prices in June 2021 were 13% higher than a year earlier, which was the fastest growth rate recorded
since 2004. The Bank of England examined the extent to which an increase in demand for larger
properties outside city centres during the pandemic (a ‘race for space’) may explain this increase in
prices using a model focused on three ‘race for space’ factors that have potentially driven price growth
during the pandemic:
• A shift in the types of properties traded. e.g. transactions of detached homes increased whilst
transactions of flats decreased. The lilac bar in the chart below shows that this change in the
basket of purchased properties explains nearly 11% of the house price growth since January
2020
20• An increase in the price that buyers were willing to pay for a house compared to a flat with sim-
ilar characteristics (e.g. located in a similar area, with a similar number of bedrooms). As shown
by the pink bar, this accounts for around 21% of the price growth
• A reduction in the price gap between identical properties in London and outside of London
since the start of 2021. This accounts for around 15% of the overall house price strength, shown
in purple in the chart
Overall, this means that the Bank of England estimates that just under half (47%) of the recent increase
in house prices can be attributed to the ‘race for space’ as people seek and value larger living spaces
outside city centres.
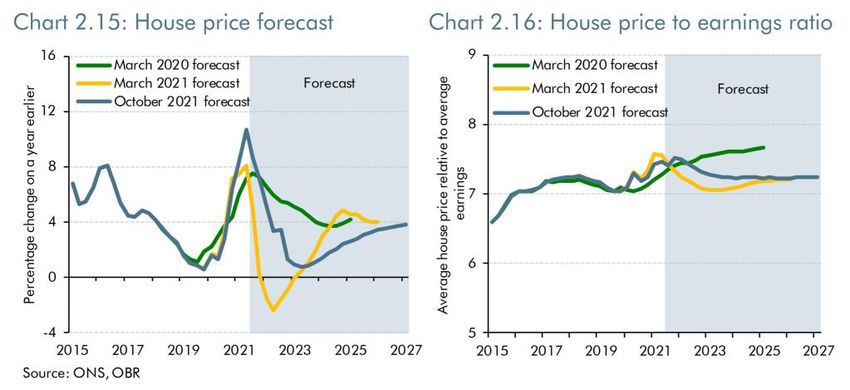
OBR UK House Price Forecast and Property Transactions (October 2021): Alongside Autumn Budget
2021, the Office for Budget Responsibility (OBR) forecasts that UK house price inflation will fall from
11% in 2021 Q2 to 0.5% in mid-2023.
21It is also anticipating that UK property transactions in 2022 will fall by 11% but remain above pre-Covid-
19 levels and continue to grow at long-term growth rates (despite those growth rates not occurring be-
tween 2017 and 2019, pre-Covid-19).
Nationwide UK House Prices (November 2021): According to Nationwide, annual house price growth
remained strong in November 2021 at 10.0%, marginally higher than the 9.9% recorded in October.
Prices rose 0.9% in month-on-month terms, after taking account of seasonal effects. As a result, house
prices are now almost 15% higher than in March 2-2020 when the initial lockdown occurred. Nation-
wide also reports that there have been some signs of cooling in housing market activity in recent
months as housing transactions were down in October but mortgage approvals in October were above
the average in 2019, pointing towards underlying strength in the housing market near-term. However,
22Nationwide stated the outlook is uncertain in 2022 due to the potential impacts of the Omicron variant
and rising inflation on consumer confidence in addition to concerns regarding affordability.
Savills UK Residential Property Market Forecast (November 2021): Savills’s latest forecasts assume that
the Bank of England raises rates twice in 2022, bringing them to 1.5% at the end of 2026 forecast period
before plateauing at 1.75% at the end of 2027 (beyond the forecasting period). For consumers, this
could result in a double impact; an increase in variable rates and a higher premium to secure a fixed
rate, though in part this will depend on the appetite of lenders. It forecasts the average UK house price
to will rise by 13.1% over the next five years with growth of 3.5% in 2022 and 3.0% in 2023 before
growth of 2.5% in 2024 and 2.0% in 2025. Growth beyond that would limit the profile of people able to
buy. Within this, the strongest house price growth is expected to be in the North West and Yorkshire
and Humber, with house prices rising by 4.5% in 2022 and 4.0% in 2023 in both regions. The slowest
house price growth is expected to be in London with house prices forecast to rise by 2.0% in 2022 and
1.5% in 2023 although note that Prime Central London house prices are forecast to rise by 8.0% in 2022
and 4.0% in 2023 as buyers are less dependent on mortgage borrowing and less exposed to rising
interest rates.
23Redrow Year End Results (September 2021): Housebuilder Redrow reported that in the year to 27 June
2021, its completions were 39% higher than in 2020 but 13% lower than in 2019 whilst its revenue was
45% higher than in 2020 but 8% lower than in 2019. Its gross margin was 21.4% compared with 18.1% in
2020 whilst operating margin was 16.6% compared with 11.1% in 2020. It reported that “house price
inflation is more than offsetting build cost increases with long term supplier relationships ensuring a con-
stant build output”. However, it also stated that “the buoyant housing market has moderated in recent
months, and we anticipate sales rates will return to historically average rates over the course of the cur-
rent financial year”.
MJ Gleeson Year End Results (September 2021): Housebuilder MJ Gleeson, which primarily focuses on
house building in the Midlands and North of England reported in the year to 30 June 2021 that its
completions were 69% higher than in 2020 and 18.5% higher than 2019, pre-pandemic. Its revenue
increased by 88.6% to £265.8 million compared with £140.9 million in 2020 of which £1.5 million related
to land sales compared with £0.5 million land sales in 2020. The average selling price for homes sold was
£145,800 compared with £130,900 in 2020, an increase of 11.4%. due to house price inflation of 9.3%, a
mix of site locations and the mix of two, three and four-bed homes sold. Gross profit margin on its
homes sold increased to 28.5% compared with 27.8% in 2020 as it reported that “increases in selling
prices more than offset cost inflation, including the costs of operating under Covid-safe working
practices”.
24Barratt Developments AGM Trading Update (October 2021): The UK’s biggest housebuilder issued a
trading update for the period from 1 July to 10 October 2021with net private reservations per average
week of 281 compared with 288 one year ago and 262 two years ago resulting in a net private
reservations per active outlet per average week of 0.85 compared with 0.87 one year ago and 0.72 two
years ago. Whilst the net private reservation rate was 2.3% below that reported in the prior year
period, this was a particularly active period reflecting both pent-up demand following the initial national
lockdown, and increased Help to Buy reservation activity ahead of its tapering, which excluded existing
homebuyers and introduced regional price caps. Against a more relevant comparative period two years
ago, the net private reservation rate was ahead by 18.1%.
It also reported homes completions of 3,699 compared with 4,032 one year ago and 3,252 two years
ago, 8.3% behind the comparable period in last year, which benefited from the significant increase in
home completions after the disruption created by the initial national lockdown. Reflecting the continued
strength in reservations, total forward sales at 10 October totalled 15,393 homes compared with 15,135
homes one year ago and 12,963 homes two years ago. It stated that it is 71% forward sold compared
with 70% one year ago. The private average selling price in the forward order book was £344,300
compared with £331,400 one year ago and £316,00 two years ago reflecting underlying house price
inflation, diluted by a modest decrease in the proportion of larger family homes and a lower price for
London reservations through mix changes.
It also expects build cost inflation to be between 4%-5% this financial year and that whilst the challenges
around securing sufficient and timely building materials supplies is an issue across the industry, to date it
states that it has not experienced any significant disruption to its own build programme with its sites
continuing to operate successfully throughout the country.
25Bellway Preliminary Results (October 2021): Housebuilder Bellway reported that in the year ending July
2021 revenue rose by 40.3% to £3,122.5 million compared with £2,225.4 million in 2020 and £3,213.2
million in 2019, 2.8% below the record level achieved in financial year 2019. The number of housing
completions rose by 34.8% to 10,138 compared with 7,522 in 2020 and 10,892 in 2019. The private
reservation rate was 169 per week compared with 141 in 2020 and 160 in 2020, an increase of 19.9%
and 5.6% compared to the prior year and 2019 respectively. Supported by a strengthened land bank, it
has targeted annual output of 12,200 homes in 2023, around 20% above the 2021 outturn. It has set
aside a further net £51.8 million to undertake fire safety improvements. This brings the total amount
provided since 2017 in relation to fire safety to £164.7 million. It’s forward order book at 3 October
2021 was £1,966.3 million compared with £1,869.6 million a year ago and £1,311.6 million two years ago
supporting target growth in completions of around 10% weighted towards the second half of the
financial year. The average selling price for the year ahead is expected to be around £295,000 compared
with £306,479 in the year ending July 2021 reflecting changes in product mix in advance of the change in
Help-to-Buy rules leading to the moderation in house price growth.
Taylor Wimpey Trading Update (November 2021): Taylor Wimpey reported that the UK housing
market has remained positive in the second half of 2021. Its sales rate was 0.91 homes per outlet per
week in the second half of the year to date compared with 0.76 in 2020 and 0.93 in 2019. It had at 8
November 2021 a total order book, excluding joint ventures, of £2.8 billion compared with £3.0 billion
in 2020 and £2.7 billion in 2019 representing 10,643 homes currently compared with 11,530 homes in
2020 and 10,486 in 2019. It continued to see house price inflation fully offsetting build cost inflation (due
to certain materials and a general shortage of drivers for haulage). It also reported that market
conditions remained supportive for new build homes, with continued low interest rates, good mortgage
availability, and ongoing Government support for the housing market, particularly for first time buyers. It
stated that it remains on track to deliver an operating margin target of around 21-22% in the medium
term with modest growth in completions in 2022, followed by outlet driven growth in 2023.
Persimmon Trading Statement (November 2021): Persimmon reported that it expects a 10% increase in
legal completions in 2021 compared with 13,575 legal completions in 2020 and £1.15 billion of forward
sales reserved beyond the current year compared with £0.95 billion in 2019. It stated that demand for
newly built homes continues to be healthy and the market has taken the changes in the Government's
Help to Buy scheme and the stamp duty regime in its stride whilst 50% of its private homes were sold to
first time buyers. The fundamentals of the UK housing market remain strong with good levels of
consumer demand and confidence, mortgage availability and low interest rates. It is targeting a return to
2019 volume levels in 2022 and it also reported that build cost inflation this year is around 5.0%.
26Redrow AGM Statement (November 2021): In its AGM statement, house builder Redrow reported that
the value of net private reservations in the 19 weeks to 5 November 2021 was 2% above the prior year
whilst the private revenue per outlet per week was £309,000 compared to £298,000 last year and
reservations per outlet per week for the period were “a more normal 0.68 compared to the unusually
high 0.75 last year”. Help to Buy accounted for only 9% of private reservations in the period. An
increasing desire of customers to personalise their homes, and general house price inflation, resulted in
the average selling price of private reservations for the first 19 weeks being up 14% on the equivalent
period last year at £453,000 (2021: £398,000). It estimated that overall build cost inflation will be around
5% for the current financial year.
Homes turnover for the 19 weeks to 5 November 2021 was 4% below “the exceptional level” last year
at £666 million compared with £690 million in 2021 and the total forward order book is a record £1.51
billion compared with £1.48 billion in 2021. It expects turnover for 2022 to be around £2.1 billion and
operating margin to be around 19%. As a result of a strategy to grow the business outside London, it
expects to deliver results in the 2022 financial year approaching those achieved in 2019.
Travis Perkins Trading Update (2021 Q3): Travis Perkins reported in 2021 Q2 that it had like-for-like
sales growth of 13.1% (13.3% on a 2 year like-for-like basis) with its Merchanting business experiencing
like-for-like sales growth of 15.3% (11.8% on a 2 year like-for-like basis) with end market demand ro-
bust, notably in RMI. Toolstation grew by 1.4% on a like-for-like sales basis (25.2% on a 2 year like-for-
like basis) in Q3 as customer mix normalised after exceptional demand from DIY customers in 2020.
27You can also read