THE LATEST VICTORIAN DAIRY STATE ROUND UP - Agriculture Victoria
←
→
Page content transcription
If your browser does not render page correctly, please read the page content below

Volume 9, Issue 1 – March 2018

                       Welcome to the 2018 autumn edition of Milking the Weather
                              Editor: Maria Rose Dairy Services, Agriculture Victoria Maffra

2017-18 summer rainfall deciles were extremely variable
around Victoria, ranging from as low as decile 1 (very much
below average) in a part of Western Victoria, to as high as 9
(very much above average) in a part of both the northern
irrigation and south Gippsland regions. The majority of climate
models predict an average rainfall but possibly warmer
temperatures this autumn.

THE LATEST VICTORIAN DAIRY STATE ROUND UP
Region
                                                                                                 Summer Rainfall Deciles*
Northern Irrigation and North East                                                                  (Dec 2017 – Feb 2018)
A cooler start to summer in both the northern irrigation region and the north eastern
part of the state meant a longer annual ryegrass growing season. The cooler start             Kerang: 6 with 70.4 mm
also meant lower soil temperatures and later sowing of summer crops. Good rainfalls
                                                                                              Rochester: 9 with 144.8 mm
in isolated events throughout the region assisted farmer to reduce irrigation water
amounts required for adequate perennial pastures and summer crop growth. Water                Shepparton: 7 with 110.6 mm
trade restrictions are still in place and currently in early March, water prices are fairly
stable with the Victorian Murray trading around $110 and the Goulburn trading                 Corryong: 8 with 209.7 mm
around $80. Specifically in the North East region, dryland farms still had milking
quality pasture in the rotation in mid- late December following the rains. In February
farmers were introducing dry cows and heifers onto the milking area to clean up dry
standing feed in preparation for autumn sowing (good problem to have, as the
farmers noted).

South West
It was a warm, dry summer season in general (so pretty normal) for the South West. Terang: 2 with 76.2 mm
Summer fodder crops that have been watered with either effluent or irrigation, or
                                                                                   Warrnambool: 4 with 82.6 mm
were sown early have been able to hold on. Late dryland crops however, have
struggled to produce much dry matter. Pasture growth has been low in most areas Birregurra: 1 with 41 mm
across the region; some areas have had coastal showers which have resulted in
minimal pasture growth.

*Deciles give an element a ranking, compared with the average for a geographical area. A rainfall total in decile range 10
would be in the top 10%, higher than (at least) 90% of previous monthly observations. The highest total on record is at the
very top of decile range 10, while the lowest total is at the bottom of decile range 1. For more on the meaning of deciles and
what the various deciles numbers mean exactly, go to:
http://www.bom.gov.au/climate/cdo/about/definitionsrain.shtml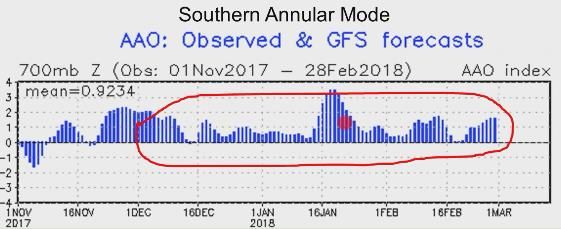
Coastal East Gippsland
After a very poor silage and hay making season in spring, summer rainfall in the              Summer Rainfall Deciles
coastal east region was below average. Rain events in November and December                    (Dec 2017 – Feb 2018)
around Orbost assisted in summer crops getting a reasonable start, but a lack of
                                                                                         Bairnsdale: 3 with 84.5 mm
summer rain overall has meant very low yields. With no rain over the whole of
December, Bairnsdale has been even drier in comparison and failed summer crops Orbost: 4 with 160.2 mm
have been common in dryland areas. Summer growing grasses (Paspalum & Kikuyu)
were the saviour. February was particularly tough around Bairnsdale with hot, dry
winds in addition to very little moisture. Many coastal East Gippsland farmers are
currently buying in off farm feed (good quality vetch hay mostly) to bolster milker feed
and some have culled early; desperately needing early Autumn rain.

Macalister Irrigation District (MID)
Although the summer rainfall total in the MID was above average, the timing of the
rain and small number of rain events resulted in below average pasture production,
due to long dry spells, interspersed with large one off rain events. Additionally due to
below average spring rainfall, Glenmaggie hadn’t spilt until the start of December at
which time many MID dairy farmers had used more than half of their annual water
allocation. Those who irrigated early spring generally achieved greater fodder East Sale: 8 with 178 mm
conservation and pasture growth, compared to those who held off irrigating for fear of
not getting spill allocation. Temporary water prices prior to spill got up to $250/ML,
double the usual water market price, but since water allocation was reset to 100%
HRWS, they’ve settled back to around the $100/ML mark. Hot windy days at the end
of summer and coming into Autumn greatly increased evapotranspiration and
dryness.

South and West Gippsland
Summer in South and West Gippsland was a tale of two halves. The first half was
punctuated with some good falls of rain (very wet in December). In the second half,
temperatures were on the rise but with many windy days, soils which were saturated
                                                                                            Yarram: 9 with 207.6 mm
from the December rain dried out. Periods of high humidity resulted in some areas
receiving rain in thunderstorms while others missed out. Those lucky enough to get a
thunderstorm or two have continued to have quite good summer pasture and crop Wonthaggi: 7 with 175.6 mm
growth. In the main though, most of the red or free draining soils have dried out and
pasture growth has tailed off dramatically. February was not excessively hot but it Drouin: 7 with 212.8 mm
was very windy with little rainfall. Milk production lifted in the early part of summer but
has since come back to more normal summer production levels. The early summer
rain delayed the start of silage and summer crop feeding but both of these are now
being fully utilised as pasture growth dwindles. Many are looking to good autumn rain
so they can get good germination of any resown paddocks.

SEASONAL CLIMATE OUTLOOK
Adapted from: Bureau of Meteorology website http://www.bom.gov.au/;
Milking the Weather Webinar Series – Webinar 1,

Climate models suggest further cooling of the tropical Pacific is likely during the early southern summer but anticipate
it will be a short-lived event, with limited influence on Australian rainfall patterns during summer. Most models suggest
a transition back to ENSO neutral by April 2018. A weak and short-lived La Niña continues to break down, with a
return to neutral conditions expected by mid-autumn. In the past, the break-down of weak La Niña events has seen
drier conditions during autumn.
Rainfall and temperature summaries for summer 2017-18
The eastern half of Victoria has been generally wetter this summer and the western half generally drier, as indicated
by the dotted line, in the following 2 maps. In the quarterly Victorian summer rainfall decile map, the east west
division “mostly above average” and “mostly below average” respectively. In the quarterly Victorian summer rainfall
totals map the east west division was “mostly above 100 millimetres” and “mostly below 100 millimetres” respectfully.

     http://www.bom.gov.au/jsp/awap/rain/index.jsp?colour=colour&time=latest&step=0&map=decile&period=3month&area=vc

       http://www.bom.gov.au/jsp/awap/rain/index.jsp?colour=colour&time=latest&step=0&map=totals&period=3month&area=vc

       The Normalised Difference Vegetation Index (NDVI) grids and maps are derived from satellite data. The data
       provides an overview of the status and dynamics of vegetation across Australia, providing a measure the amount
       of live green vegetation. The satellite data comes from the Advanced Very High Resolution Radiometer (AVHRR)
       instruments on board the National Oceanic and Atmospheric Administration (NOAA) series of satellites that are
       operated by the US (http://noaasis.noaa.gov/NOAASIS/ml/avhrr.html).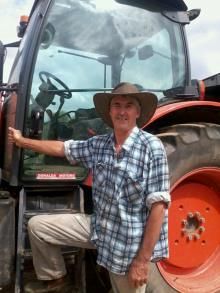
Looking at how green
                                                                                                    Victoria was compared to
                                                                                                    normal this summer, except
                                                                                                    for a few parts in the hills in
                                                                                                    the north, north east and
                                                                                                    west of the state, most of
                                                                                                    Victoria was browner than
                                                                                                    normal (the white areas are
                                                                                                    normal), by quite a way.

                                                                                                    http://www.bom.gov.au/jsp/awap/
                                                                                                    ndvi/index.jsp?colour=colour&tim
                                                                                                    e=latest&step=0&map=ndvianom
                                                                                                    sd&period=month&area=vc

          Live green vegetation absorbs visible light (solar radiation) as part of photosynthesis. At the same time plants
          scatter (reflect) solar energy in the near infrared. This difference in absorption is quite unique to live
          vegetation and provides a measure of the greenness of the vegetation. NDVI is an index which measures this
          difference, providing a measure of vegetation density and condition. It is influenced by the fractional cover of
          the ground by vegetation, the vegetation density and the greenness. It indicates the photosynthetic capacity of
          the land surface cover.

                                                                                                 Temperature wise, this summer
                                                                                                 we had extreme temperatures.
                                                                                                 As the Maximum Temperature
                                                                                                 Anomaly map (appearing to the
                                                                                                 left) indicates, we had vast areas
                                                                                                 in the north-west part of the state
                                                                                                 where maximum temperatures
                                                                                                 were 2 to 3 degrees warmer
                                                                                                 than normal (tan colour).
                                                                                                 Elsewhere in the state the
                                                                                                 anomaly was 1 to 2 degrees
                                                                                                 warmer than normal (yellow
                                                                                                 section of this map).
                                                                                                 http://www.bom.gov.au/jsp/awap/temp/inde
                                                                                                 x.jsp?colour=colour&time=latest&step=0&m
                                                                                                 ap=maxanom&period=3month&area=vc

During this summer, February in particular, was a pretty dry month with
nowhere in the state recording decile ranges above average (the white bits in
the Victoria map on the right). Most of the state was at Decile 2 to 3 (below
average) indicated by the light red shaded parts in the map. Some areas in
West Gippsland and the Western side of Victoria were very much below
average at Decile 1, indicated by the darker red bits on the map.
http://www.bom.gov.au/jsp/awap/rain/index.jsp?colour=colour&time=latest&step=0&map=decile&
period=daily&area=vc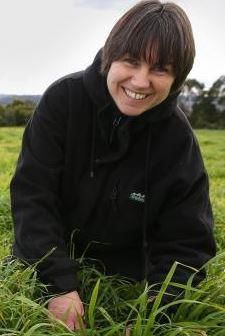
ENSO Wrap up – Current state of the Pacific and Indian Oceans

 Although the La Niña continues to weaken as we head into
 autumn, its pattern remains weakly evident in the tropical
 Pacific. As such, the ENSO Outlook remains at La Niña
 status for another fortnight. While temperatures in the
 tropical Pacific Ocean have been warming back to neutral
 values in recent weeks, a recent pulse in tropical activity
 may temporarily stall this pattern.

However, it is unlikely to arrest the imminent return to ENSO-neutral conditions, with seven of eight models
indicating a likely return to neutral by May 2018. This would be in line with typical El Niño / La Niña evolution,
where events tend to peak in December/January and transition back to neutral in the autumn months. Further
information on the current status of ENSO can be found at http://www.bom.gov.au/climate/enso/

The Southern Oscillation Index (SOI) is calculated from the monthly or seasonal fluctuations in the air pressure
difference between Tahiti and Darwin.

A strongly and consistently positive SOI pattern (e.g. consistently above about +6 over a two month period) is
related to a high probability of above the long-term average (median) rainfall for many areas of Australia,
especially areas of eastern Australia (including northern Tasmania) - La Niña.
Conversely, a 'deep' and consistently negative SOI pattern (less than about minus 6 over a two month period,
with little change over that period) is related to a high probability of below median rainfall for many areas of
Australia at certain times of the year - El Niño.
It is important to remember however, that the pattern of relationship between SOI and rainfall (and temperature)
can vary depending on the particular season and region. Additionally, the change in SOI over a specified period
can be as important in understanding relationships between SOI and rainfall as is the absolute value in SOI.

                                                                                Southern Oscillation Index (SOI)
                                                                                Autumn is the worst time of year to be
                                                                                looking for predictors for rainfall. The
                                                                                SOI is greatly affected by the wet
                                                                                season at this time. Better to watch
                                                                                and follow its behaviour at the end of
                                                                                the Tropical wet season; winter and
                                                                                spring. For the latest 30 Day moving
                                                                                SOI chart go to:
                                                                                http://www.bom.gov.au/climate/enso/#
                                                                                tabs=SOI

The main moisture source in the Coral Sea has been pushed further over toward Australia as a result of the La
Niña behaviour over summer. The Indian Ocean and the Timor Sea are looking quite normal, although there has
been a lot of stirring up due to the cyclonic activity that’s been happening over summer; remembering that the
Indian Ocean is much shallower and is much more prone to changes from weather activities.

                                http://www.ospo.noaa.gov/Products/ocean/sst/anomaly/

Currently we have remnants of the La Niña with the Nino regions of 3 & 3.4 (refer to map below) being at -0.48
°C & -0.60°C respectively); having backed off of the threshold for La Nina of -0.8°C.

For more information about the Nino regions, go to www.ncdc.noaa.gov/teleconnections/enso/indicators/sst.php

                                           The Southern Annular Mode (SAM)
                                           Also known as the Antarctic Oscillation (AAO), the SAM describes
                                           the north–south movement of the westerly wind belt that circles
                                           Antarctica, dominating the middle to higher latitudes of the
                                           southern hemisphere. The changing position of the westerly wind
                                           belt influences the strength and position of cold fronts and mid-
                                           latitude storm systems, and is an important driver of rainfall
                                           variability in southern Australia. In a nutshell it’s a measure of the
                                           strength of polar westerlies in the Southern Ocean. The SAM index
                                           is calculated by the differences in pressure between 40° and 60°
                                           latitude (the red circles in the image on the left). The SAM
                                           essentially pushes or pulls rain bearing triggers away from
                                           southern Victoria. In winter stronger westerly polar winds pull fronts
                                           away and slower polar winds push fronts closer. In summer the
                                           outcome is reversed.
Southern Annular Mode (SAM)
continued
The SAM was positive over
summer, which can often lead to a
wetter than average summer in
eastern Victoria. BoM & NOAA
predictions suggest that the SAM
will remain weakly positive or close
http://www.cpc.ncep.noaa.gov/products/precip/CWlink/daily_ao_index/aao/aao_index_mrf.shtml
to normal for the next 14 days.
The position of the sub-tropical ridge plays an important part in the way the weather in Australia varies from
season to season. During the warmer half of the year in southern Australia (November to April), the sub-tropical
ridge is generally located to the south of the continent. High pressure systems (also called anticyclones), which
http://www.cpc.ncep.noaa.gov/products/prec
ip/CWlink/daily_ao_index/aao/aao_index_mr
are associated with stable and dry conditions; generally move eastwards along the ridge. In autumn the sub-
f.shtml
tropical ridge moves northward and remains over the Australian continent for most of the colder half of the year
in southern Australia (May to October). Conditions along the ridge, under the influence of the high pressure
systems dry and descending air, tend to be stable and drier.
https://www.esrl.noaa.gov/psd/map/images/fnl/slp_30a.fnl.html
http://www.cpc.ncep.noaa.gov/products/prec
ip/CWlink/daily_ao_index/aao/aao_index_mr
f.shtml
Currently the STR is sitting around Adelaide (indicated by the red line in the sea level pressure map above. By
winter it should get up to the top of the Great Australian Bite (close to the SA/WA border). So as we start to come
into the autumn season and we are all looking for rain, it’s a good time to look at those synoptic charts and note
where the centres of the highs are placed. What we are hoping to see is that the STR starts moving northwards,
progressing through autumn. As the high pressure mass of the STR moves towards the Bite, it will allow frontal
rain triggers to come closer to southern Victoria. Over summer the pressure has been lower over Victoria, but
this has only led to more rain in the east of the state.Model forecasts– The skill accuracy of models at this time of year is low to medium. Such lack of accuracy is normal for this time of year and it’s the worst time to be looking for reliable predictions of rainfall. The majority of the models expect the La Nina to continue to decay leaving the Pacific Ocean slightly cooler, the Indian Ocean neutral, average rainfall and average/slightly warmer temperature this autumn (March to April) predicated in February. The autumn break will come due to an act of weather rather than climate. So it’s not impossible to get an autumn break like we did last year. Don’t write off an autumn break quite yet on the basis of just one or two climate models suggesting that it might be drier. The table above also gives February predictions for winter forecasts. Understandably there is much less consensus amongst all models given that the start of winter is still four months away from when these predictions were done.
MILKING THE WEATHER (MTW) WEBINAR SERIES
The first of four Milking the Weather Webinars developed by Agriculture Victoria Dairy and Climate staff, tailored
to the Victorian Dairy Industry was held last Friday 2 March 2018. These webinars are linked to the quarterly
"Milking the Weather" (MtW) e-newsletter, which focuses on climate risk management. All four webinars will be
recorded and available as webcasts;

Midday Friday 2 March: MtW webinar - autumn 2018 seasonal climate outlook for Victorian dairy farmers &
"deep soil moisture probes on dryland farms as a tool to better understand seasonal conditions. Recording of
this webinar can be currently accessed via https://attendee.gotowebinar.com/recording/667014720053239043

Midday Monday 26 March: MtW webinar- Victorian dairy farmers managing climate risk successfully this
autumn with a focus on South Gippsland historical climatic data and progress update on the MtW South
Gippsland case study farmer’s climatic risk action plan for autumn. Also includes panel discussion with other
MtW farmer case study farmers state-wide.

Midday Wednesday 6 June: MtW- winter 2018 seasonal climate outlook for dairy farmers; “What can soil
probes tell us" with a focus on implications for dairy pastures.
Midday Wednesday 20 June: MtW Webinar- Victorian dairy farmers managing climate risk successfully this
autumn with a focus on Western Victoria historical climatic data and progress update on a Western District case
study farmer’s climatic risk action plan for autumn. Also includes panel discussion with other MtW farmer case
study farmers state-wide.
For more information about these webinars contact Maria Rose via email: maria.rose@ecodev.vic.gov.au

POSITIVE LINKING
In edition of Milking the Weather we feature websites that Climate Specialist Graeme Anderson’s (Agriculture
Victoria) suggests to help keep your eye on rain that’s on the way.
The Break (subscribe free via The.Break@ecodev.vic.gov.au) provides monthly updates on seasonal forecasts
models for Victorian farmers.

Here are some popular sites that show expected rainfall for the week ahead. Sometimes rain-inducing events
can have even the experts on the hop, and in those instances some farmers like to surf a few 7 day forecasts to
get the overall “vibe”. Try out these sites and see which ones work best for you!

Next week's weather
BoM Chartsviewer - Next 7 days                              http://www.bom.gov.au/australia/charts/viewer/index.shtml
This is an animated output from the BoM’s Access weather model.

BoM Water & Land - 4 & 7 day rainfall outlook               http://www.bom.gov.au/jsp/watl/rainfall/pme.jsp
This is the output of a composite average from seven weather models from around the world.

BoM Met Eye rain, wind, temp forecasts                      http://www.bom.gov.au/australia/meteye/
This is the output from bureau forecasters using models and human experience.

Longer term rainfall outlooks The Break (subscribe free via The.Break@ecodev.vic.gov.au)
DEDJTR Victoria - Very Fast Break - monthly updates https://www.youtube.com/channel/UClDCIII7gRZhUs03opGqH1g
                   http://us3.campaign-archive2.com/?u=f44262ae409950c15c3de4c99&id=31715131cb&e=1ec2eed1f9

BoM Seasonal Climate Outlook - 1 to 3 mths                  http://www.bom.gov.au/climate/outlooks/#/overview/summary/
BoM Seasonal Climate Video Updates           http://www.bom.gov.au/climate/outlooks/#/overview/video
BoM ENSO Wrap-ups (El Nino, La Nina, IOD etc.)http://www.bom.gov.au/climate/enso/
BoM Seasonal Streamflow Forecasts (runoff)   http://www.bom.gov.au/water/ssf/
BoM/CSIRO Soil Moisture (shallow & deep)      http://www.csiro.au/awap/
BoM/AWRA Root Zone Soil Moisture (actual & relative to normal maps) http://www.bom.gov.au/water/landscape/
FARMERS MANAGING CLIMATE RISK SUCCESSFULLY ON THEIR FARMS
Maria Rose, Dairy Services, Agriculture Victoria, Maffra
Welcome back to our Farmers Managing Climate Risk Successfully dairy farm case studies. In this edition
of Milking the Weather we catch up with three case study farmers we met two seasons back to find out how they
fared in regard to their planned 2017 spring farm management decisions they shared with us, how they got
along over the 2017-18 summer period and what their climate risk management plans are for this autumn. For
the second time, we speak to Glenn Allan from NE Victoria, Ron Cornall from East Gippsland, Andy Powell from
Western Victoria and Marian Macdonald from South Gippsland. The questions I put to them this time were;
1. How did last spring work out for you, pasture growth, silage yield, SMM wise. Which decisions paid off
and which ones didn’t so much?
2. What sort of summer have you had in a similar regard?
3. What climate risks do you anticipate this autumn and what is your level of exposure to that risk?
4. What action have you taken and or will you take and what do you see as the key trigger points?
5. What is your longer term plans to identify and manage risk beyond this autumn?
Case Study 1: Glenn Allan, Milawa, North east Victoria
I last spoke with Glenn 6 months back at the start of early September. At that time, Glenn’s
start to spring was shaping up to be at least an average one, and he was about to cut
silage; confident of a good feed situation until the following Spring. So at that time, Glenn
saw his climate risk management as low. His longer term plans moving into the summer
were to keep looking regularly at the BOM website for long term weather forecasts and
using that knowledge as a guide to keep planning ahead and make the necessary ongoing
changes as required. Glenn was also testing varieties of fodder to boost fodder production
from whatever rainfall or irrigation water he had at hand over last spring.
When I spoke with Glenn recently in this second interview, he said the following;
“We had a good spring this year luckily so we were able to make plenty of hay and silage. We tried to grow a
fodder beet crop but had a little too much rain early Dec and it got too wet (which didn’t of it much good); so that
was a failure. Generally speaking, pasture wise, it’s been a good spring overall.”
“Summer has been hot and dry which is pretty normal for around here. It was because we had plenty of irrigation
water available to us this summer, that we were able to row enough pasture to replenish our home grown fodder
stores to a comfortable level.”
“As far as the autumn goes, I’m hoping that because we’ve had a normal hot dry summer, that we will have a
normal autumn. The BOM forecast is actually for a fairly average autumn here. Given our replenished fodder
reserves as we head into autumn, that’s our risk taken care of if we do in fact get a bad autumn”.
“With good storage levels of miller- quality, home -grown hay and silage on hand, we’ll be able to handle a
pasture yield and also a quality shortage through both the autumn and winter. Also we’ve got some ground
fallow at the moment that’s about to get some early oats. Also, once we get into March further, we’ll start dry
sowing some Italian rye grasses and brassicas into our pastures”.
“Trigger points through autumn for me will be following the days of planned activities on the calendar. We’ll l put
our cereals in the next week /early March. Also, we’ll start sowing the Italian Ryegrass mid-March and keep
going with that until about the middle of April. Hopefully it has rained or is about to rain by then”.“Because we have the irrigation country, we’ll utilise that as effectively as we can over autumn; making sure that
it has adequate and not too much moisture to minimise nutrient run off at the time we plan to apply nitrogen”.
“Cows are just starting to calve at the moment. With our current adequate fodder reserves and given also the
possibility of further autumn pasture growth; I’m not seeing any reason to cull animals because of the weather
conditions ahead, yet”.
“If it’s still dry for the next six months, that’s when we’ll start worrying. If next spring fails, this will then be the
time that we will look at culling animals with a heavy hand as our current fodder stores and pasture reserves will
both likely be much depleted”.
Case Study 2: Ron Cornall, Clifton Creek, East Gippsland
I last spoke with Ron at the start of spring (early September). At that time, he indicated
that spring was shaping up to be pretty poor. The Conrnall’s considered their climatic risk
at that time as quite high because soil moisture was very low at the beginning of spring.
Also at that time, the greatly anticipated peak growing time wasn’t looking like happening
any time soon. Having a feed wedge built up by mid-September was going to be critical.
Trimming of discretionary spending and culling numbers back by a third were key
strategies high on their climate risk management list.
When I spoke with Ron recently in this second interview, he said the following;
“Spring turned out to be a disaster essentially. Pasture growth was less than 50% of normal growth expected,
which meant no home grown silage or hay to add to our fodder stores as we had absolutely no surplus”.
“As we progressed into summer, soil moisture was even further depleted as pastures had no reserves with the
hot dry spells; they just burnt off. As far as management was concerned, we maintained a strict grazing rotation
and supplementary fed as needed. That helped maximise the growth whenever we did get a shower or a little bit
of rain. We culled less than anticipated and that was partly the balance in that it wasn’t the absolute disaster it
could have been as we got some heavy welcomed rain in December. That got us a bit of extra growth we were
able to capitalise on a little bit; carrying us into summer with a little less stress. We did purchase quite a lot of off
farm fodder (silage and hay) but that was pretty hard on our finances”.
“So summer was better than we feared/anticipated. The December rain really saved the day and carried we right
through probably until the end of January (pasture growth wise). Even so - my comment is that we are only just
breaking even (given our purchased fodder costs over income ratio). But better than going backwards which is
what we feared”.
“Our risk is uncomfortably high moving into this autumn both financially and in maintaining pasture cover.
Financially at this point it’s reduced our reserves further; we did have significant Farm Management Deposits
(FMDs), but we’ve had to draw into those quite a lot a bit. Also, we’ve used our long term pit silage (which is why
it was there) but it means we don’t currently have that fall-back position any more. So for us, this autumn really
needs to be better than average, but we are also planning for three options (below average season, average
season and even the possibility of an above average season). And that all depends on the timing and amount of
autumn break we actually do get, so that’s why we are hedging our bets a bit. We’ve purchased and have on
hand half our requirements of both seed and fertiliser, for sowing if we get an earlier break. But we are also
purchasing more off farm fodder if we don’t get a break, so we have at least half what we might need to get
through winter, currently”.
“Given our high exposure to the risk of a delayed or very weak autumn break, our trigger points will kick in every
fortnight (start of the month and middle of the month essentially). So we’ve got through most of Feb and nothing
happened (rain wise) so that was a failure. End of Feb is probably not going to happen, because we are nearly
there.It would be great if the break came by the end of March because we would be able to resow and build some
pasture ahead of us. Middle of March; it would be still OK if we got it then. End of March, if the break hadn’t
happened, we’d have to be drying off early and looking at buying more fodder.
As part of our risk management action plan), we will be checking the weather outlook, at present there is a 65%
chance of above average rainfall. There is a very real risk of a failed autumn, if we have not had a break by the
end of April, it will be disaster management again. It’s still not a realistic risk that it might not actually be a below
average one with certainty. But if we get to the end of April and we don’t have a break then, it’ll be not looking
very good at all and it will be disaster management again; reducing stock numbers, purchasing fodder and
possibly even having to borrow then (increasing our debt)”.
“If all goes well in autumn, we will be able to rebuild our stored fodder stores and improve our financial reserves
(FMDs). Regardless, we need to seriously look at stock water security because we were only saved by the
December rain this past summer. We could have been very vulnerable if that rain hadn’t fallen at the time and in
that amount as far as stock water goes. We need to seriously consider and plan for on farm storage (with respect
to dams, bore water or off farm water options) into the near future as we don’t know how bad the dry period might
become.”
Case Study 3: Andy Powell, Cooriemungle, Western Victoria
When I spoke with Andy the first time six months back (early last spring),
he saw his then current exposure to climate risk as medium. This was
despite having had a better winter season than normal in terms of wet
muddy conditions, due to the random nature of northern rain weather
patterns experienced over the previous autumn. At that time (early
Sept) his focus on harvesting as much of their own pasture, silage and
hay as possible by applying 100kg urea every five to six weeks;
negating having to buy in fodder.
When I spoke with Andy recently in this second interview, he said the following;
“Overall last spring turned out a little better than average. We managed to harvest 2.5 tonnes of silage/ha over
the total milking area of 190 hectares. This result has given us enough fodder reserve to go through autumn and
provide our fibre source for our milkers through winter as well”.
“The weather pattern seemed to indicate we were heading towards a dry early summer so we stopped applying
urea on the1st November, to try to prevent a build-up of long dry grass in December and January that we weren’t
going to utilise and not benefit from financially. Our grazing rotation over the spring was around 12-13 days;
(removing cows from paddocks at around 1650-1700 kg/ha of residual pasture. We took out paddocks out for
silage and brought them back into the rotation continually, so there’s no feed wasted. This enabled us to go into
summer with all our pastures trimmed off and not having a residual of long dry clumps of grass in any paddocks.”
“The weather this summer has been pretty much as we expected. It started to dry off in early December and
although it got pretty dry we haven’t had the evaporation that we would normally have as there haven’t been a lot
of winds to date. To that end, cracking in our clay soils hasn’t happened to the usual extent yet, so we have
had only minor exposure to crickets. We still baited the entire farm to kill the crickets with good results. We also
had an outbreak of army worms in some paddocks, mainly late silage and hay paddocks which were carrying a
long canopy of grass. This problem was controlled by spraying the paddocks with the army worms.”
“The BOM are saying that we’re in for a late or a dry autumn which we are planning on. We are fortunate in that
we have our own fodder to carry us through if it does get dry. So far the pastures are in good condition for the
end of summer. The cows being fed ab lib silage has taken the grazing pressure off our pasture so we have a
good cover of short pasture ready to respond to the autumn break. It just depends on what happens between
now and the autumn break”.“We are past the hottest weather cycle now and we’ll be getting some more moisture and dews coming in even if
we don’t get early autumn rain. So we think we‘re pretty well positioned as we rate our risk for autumn as low to
medium”.
“The trigger points will be the same as other years in what will happen if we have a later break. The basis is that
once we do have the break we need to let the pastures start growing again, extend the rotation and start building
up a feed wedge for the winter, ready for calving. If we have an early break, it’s really good because it takes very
little work to build up a feed wedge. If we have a late break, say in mid/end of May then we might have to feed
fodder for longer and extend the rotations and apply nitrogen early at the 1.5 to 2 leaf stage to get the pastures
going. We would have no hesitation to buy in extra hay if the going gets really tough to ensure we have a feed
wedge going into winter. As seasonal winter calves we are going through the autumn break stage when we’ve
got our lightest stocking rate for the milking cow; so this makes it easier to manage the building of a pasture
wedge.”
“One thing that can go astray for dry cow preparation is transition diet management. We believe we have had
great results when transition feeding is a key part of our autumn farm management strategy. We do simple
energy calculations of the mega joules of feed they are getting in their diet. Years ago we found that we
weren’t getting enough mega joules with the hay we had tested and the cows were losing condition. So this
autumn we will once again (if there is no pasture for the dry cows) feed grain to the milkers as part of leading up
to the transition time and do energy audits to ensure cows are maintaining or improving their condition before
calving to a level that doesn’t result in calving problems.”
“Beyond this autumn we see the opening price for the 2018-19 season as a key risk. Generally we make the
autumn break work through management and planning, but we can’t manipulate the milk price. This is something
we will be wary of going into the next milking season. Our priority expenditure will be in setting up next financial
year (fertilizer, cow health and condition, transition dry cow management, track repair and maintenance etc.) as
well as any necessary general maintenance plant repairs or replacement or capital improvements. Bringing
forward some of next year’s taxable expenditure into this financial year will also be considered of necessary to
help next year’s cash flow and better manage our taxable income this financial year. We will be doing budgets as
soon as we get an opening price, so we know where we are and how we are situated for the new milking
season.”
Case Study 4: Marian Macdonald, Yarram, South Gippsland
When I last spoke with dairy farmer Marian Macdonald from Yarram, South
Gippsland six months back at the start of Spring 2017 (early September), she
considered her exposure to the climatic risk of not getting a good spring at that
time as “medium”. Marian rated her risk exposure as such, rather than the “very
high” it was back in August 2017, particularly given they had bought in some
fodder early. Hanging on to annual pasture through spring and putting millet in
over more acres and use the limited water they had sparingly, rather than use it
more intensively on a smaller area was the key strategy for spring 2017 that
Marian was putting into place at that time.
When I spoke with Marian recently in this second interview, she said the following;
“Spring 2017 turned out to be a mixed bag silage and pasture growth wise around Yarram, South Gippsland.
After a dry winter, well above average pasture growth rates were achieved during the first three weeks of
October 2017. November was a disaster, with growth crashing to zero very early on. The early finish to last
spring meant silage yields were lower than expected.”“Last summer began with a very welcomed early December deluge of rain. This event enabled us to avoid routinely feeding out silage until February, which is something I’ve never experienced before. The millet crops took off in a spectacular fashion and, up until February, we were able to have the milking cows on the millet for half their grazing times every day.” “February has been very dry and soil moisture levels are below average, with no significant rain forecast for the next 16 days. The Bureau says the autumn break is likely to be delayed. For this reason, we have not yet sprayed out the millet for resowing into pasture. We have decided it’s better to keep watering the millet so we have some green feed in the paddocks rather than nothing for an extended period. If we spray out too early, we will have a big feed gap. If we spray out too late, we might struggle to get pastures established before winter. " “It’s never easy to get timing of the autumn break exactly right but we are confident that it’s still far too early for us to resow into permanent pastures. We are pleased that we still have plenty of water left in the dam to help manage the risk of a false break, especially when soil moisture levels are below average.” “Looking ahead beyond this current autumn, we are happy with our new approach of conservatively watering millet for green feed over summer 2018. Also the prairie grass stands we’ve established on some of our lighter country is looking like a real winner, providing valuable feed over the shoulders long after the rye grass has gone into senescence. Our longer term plans to manage climatic risk beyond this autumn will involve sowing more prairie grass, continue with millet over the summer and investigate other species that will help to fill the winter feed gap.” Our next MtW Webinar at Midday Monday 26 March “Victorian dairy farmers managing climate risk successfully this Autumn” highlights South Gippsland regional historical climatic data (presented by Graeme Anderson, Climate specialist, Agriculture Victoria).Given our South Gippsland MtW case study farmer is Marian Macdonald, she will give us an update on how her risk management action plan for autumn is going. This webinar also includes a panel discussion with Marian and other MtW farmer case studies that are able to join us. Contact Maria Rose on maria.rose@ecodev.vic.gov.au for more information.
You can also read