Whanganui District Council Waste Assessment 2021 - Consultation document Working towards a low-waste future
←
→
Page content transcription
If your browser does not render page correctly, please read the page content below
Whanganui
District Council
Waste Assessment
2021
Consultation document

Working towards a low-waste future
Contents
1. Introduction                                             5    5. Waste services                                       35
  1.1     Structure of this document                         6     5.1      Council-provided waste services              36
  1.2     Purpose of this Waste Assessment                   6     5.1.1    Council-contracted collection services       36
  1.3     Legislative context                                7     5.1.2    Other council services                       38
  1.4     Scope                                              7     5.1.3    Waste education and minimisation
  1.4.1   General                                            7   		         programmes                                   38
  1.4.2   Period of waste assessment                         7     5.1.4    Solid waste bylaws                           39
  1.4.3   Consideration of solid, liquid                           5.1.5    Litter control and enforcement               39
		        and gaseous wastes                                 7     5.1.6    Public litter bins                           40
  1.4.4   Public health issues                               8     5.1.7    Abandoned vehicles                           42
  1.5     Strategic context                                  9     5.1.8    Street cleansing                             42
  1.5.1   New Zealand Waste Strategy                         9     5.1.9    Stream, beach, park cleaning                 42
  1.5.2   International commitments                          9     5.1.10   Rural and farm waste                         42
  1.5.3   National projects                                 10     5.1.11   Hazardous waste                              43
  1.6     Local and regional planning context               12     5.2      Assessment of council-provided
  1.6.1   Long term plan                                    12   		         solid waste services                         43
  1.6.2   Other local plans                                 12     5.3      Funding for council-provided services        43
  1.6.3   Regional council plans                            12     5.4      Non-council services                         43
  1.6.4   Cross-regional collaboration                      14     5.4.1    Assessment of non-council services           47

2. Manawatū-Whanganui region                                15   6. Situation review                                     49
  2.1     Overview                                          16     6.1      Waste to Class 1−5 landfills                 50
                                                                   6.1.1    Definitions used in this section             50
3. Our district                                             17     6.2      Overview of waste to class 1-4 landfills     50
                                                                   6.3      Waste quantities                             50
  3.1     Physical characteristics                          18
                                                                   6.3.1    Waste to Class 1 landfills                   50
  3.1.1   Overview                                          18
                                                                   6.3.2    Other waste disposed of to land               51
  3.1.2   Geography                                         19
                                                                   6.3.3    Summary of waste disposed of to land         53
  3.1.3   Climate                                           19
                                                                   6.4      Composition of waste to Class 1 landfills    54
  3.1.4   Demographics                                      19
                                                                   6.5      Activity source of waste                     55
  3.2     Economy                                           24
                                                                   6.6      Diverted materials                           55
  3.3     Implications of economic and
                                                                   6.6.1    Overview of diverted materials               55
		        demographic trends                                26
                                                                   6.6.2    Kerbside recycling and drop-off facilities   58
                                                                   6.6.3    Commercially-collected diverted materials    58
4. Waste infrastructure                                     27     6.6.4    Diversion of organic waste                   58
  4.1     Disposal facilities                               30
  4.1.1   Landfills                                         30   7. Performance measurement                              59
  4.1.2   Transfer stations                                 32
                                                                   7.1      Current performance measurement              60
  4.1.3   Assessment of residual waste
                                                                   7.1.1    Per capita waste to Class 1 landfills        60
		        management infrastructure                         33
                                                                   7.1.2    Per capita domestic kerbside refuse
  4.2     Facilities for specific difficult waste streams   33
                                                                 		         to Class 1 landfills                         62
  4.3     Recycling and reprocessing facilities             34
                                                                   7.1.3    Per capita kerbside recycling                64
  4.3.1   Assessment of recycling and
                                                                   7.1.4    Diversion potential of waste to
		        reprocessing facilities                           34
                                                                 		         Class 1 landfills                            65

PG | 2
8. Future demand and gap analysis 67
  8.1      Future demand                            68
  8.1.1    Population                               68
  8.1.2    Economic activity                        68
  8.1.3    Changes in lifestyle and consumption     69
  8.1.4    Changes in waste management approaches   69
  8.1.5    Summary of demand factors                70
  8.1.6    Projections of future demand             70
  8.2      Future demand – gap analysis             70
  8.2.1    Waste streams                            70
  8.2.2    Hazardous wastes                         70

9. Initial review of the
   2015 Waste Management and
   Minimisation Plan                                71
  9.1      Data                                     72
  9.2      Key issues                               72
  9.3      Other issues not addressed               73
  9.4      New guidance                             73
  9.5      Actions                                  73
  9.6      Implementation plan                      73
  9.7      Progress                                 73

10. Statement of options                            75
  10.1     Key issues to be addressed by WMMP       76

11. Statement of council’s
    intended role                                   82
  11.1     Statutory obligations and powers         82
  11.2     Overall strategic direction and role     82

12. Statement of proposals                          83
  12.1     Statement of extent                      83
  12.1.1   Protection of public health              83
  12.1.2   Effective and efficient waste
		         management and minimisation              83

Appendices                                          85
Medical officer of health statement                 86
Glossary of terms                                   87
Classifications of disposal to land                 89
National legislative and policy context             91

                                                         WHANGANUI DISTRICT COUNCIL - WASTE ASSESSMENT 2021   PG | 3
Table of Figures
Figure 1:    Map of region and territorial authority areas                                             16
Figure 2:    Map of district                                                                           18
Figure 3:    Population projections                                                                    20
Figure 4:    Population growth rate                                                                    21
Figure 5:    Components of population change                                                           21
Figure 6:    Whanganui district population projection                                                  22
Figure 7:    Demographic indicators                                                                    22
Figure 8:    Households by type                                                                        23
Figure 9:    Whanganui building consent numbers (as an indicator of increased waste from households)   23
Figure 10:   Resource consents                                                                         24
Figure 11:   Population, job, GDP growth                                                               25
Figure 12:   GDP growth                                                                                26
Figure 13:   Key waste flows in Whanganui                                                              29
Figure 14:   Class 1 landfills accessible from Whanganui district                                      31
Figure 15:   Transfer stations in Whanganui district                                                   32
Figure 16:   Hazardous waste operators                                                                 33
Figure 17:   Summary of council-contracted collection services                                         37
Figure 18:   Outcome of recent illegal dumping enforcement campaign                                    39
Figure 19:   Comparison of key metrics before and after campaign                                       40
Figure 20: CBD and park/shopping centres bin audit                                                     41
Figure 21:   CBD and park/shopping centres audit findings                                              41
Figure 22:   Survey of non-council kerbside waste collection services                                  44
Figure 23:   Proportion of bags and bins                                                               44
Figure 24:   Urban kerbside refuse collection receptacles numbers 1998 - 2020                          45
Figure 25:   Amount of urban kerbside waste collected by non-council waste services                    45
Figure 26:   Wheeled bin sizes across all providers for peri-urban collection                          46
Figure 27:   Forensic waste assessment of Whanganui’s urban kerbside waste – September 2020            47
Figure 28:   Chart showing types of waste by % found in urban kerbside forensic audit                  48
Figure 29:   Urban kerbside waste streams by % that are capable of being diverted from landfill        48
Figure 30: Waste to Class 1 landfill (by year)                                                         51
Figure 31:   Waste disposed of to land – 2020                                                          53
Figure 32:   Composition of levied waste to Class 1 landfills                                          54
Figure 33:   Activity source of waste to Class 1 landfills                                             55
Figure 34: Diverted materials quantities for the Whanganui district 2015 and 2020                      56
Figure 35:   Vehicle/person count comparison 2018-2020                                                 57
Figure 36:   Whanganui’s waste disposal per capita                                                     60
Figure 37:   Per capita waste to Class 1 landfills compared to other districts                         61
Figure 38:   Per capita disposal of kerbside refuse – comparison with other areas                      63
Figure 39:   Per capita kerbside recycling – kg/capita/annum                                           64
Figure 40: WDHB waste streams by volume                                                                66
Figure 41:   Municipal waste generation, GDP and population in OECD 1980 - 2020                        68
Figure 42:   Summary of proposed actions and methods for achieving waste management and minimisation   77
Figure 43: Council-proposed supporting actions                                                         80
Figure 44: Actions, timeframes and tonnages                                                            81

PG | 4
1.
Introduction
This Waste Assessment has been
prepared by Whanganui District
Council in accordance with
the requirements of the Waste
Minimisation Act 2008 (WMA).
This document provides background
information and data to support the
council’s waste management and
minimisation planning process.

           WHANGANUI DISTRICT COUNCIL - WASTE ASSESSMENT 2021   PG | 5
1.1 Structure of                                            Statement of options and the council’s
                                                            proposed role
this document                                               These sections develop options available for meeting
                                                            the forecast future demand and identify the council’s
This document is arranged into a number of sections
                                                            proposed role in ensuring that future demand is met. It
designed to help construct a picture of waste
                                                            also looks at the council’s ability to meet its statutory
management in our district. The key sections are
                                                            obligations.
outlined below.
                                                            Statement of proposals
Introduction                                                The statement of proposals sets out what actions
The introduction covers a number of topics that set the     are proposed to be taken forward. The proposals are
scene. This includes clarifying the purpose of this Waste   identical to the actions that will be put forward in the
Assessment, its scope, the legislative context and key      upcoming Waste Management and Minimisation Plan
documents that have informed the assessment.                (WMMP) so the Waste Assessment simply references
                                                            the WMMP for this section.
Manawatū-Whanganui region
This section presents a brief overview of key aspects
                                                            Appendices
of the region’s geography, economy and demographics         The appendices contain additional waste management
that influence the quantities and types of waste            data and further detail about facilities in each district.
generated and potential opportunities. It also provides     This section includes the statement from the Whanganui
an overview of regional waste facilities and initiatives    medical officer of health as well as additional detail on
that may be of relevance to how we manage our waste.        legislation.

Our district
This section presents a brief overview of key aspects of
                                                            1.2 Purpose of this
the district’s geography, economy and demographics
that influence the quantities and types of waste
                                                            waste assessment
generated and potential opportunities.                      This Waste Assessment is intended to provide an initial
                                                            step towards the development of a WMMP. It sets out
Waste infrastructure, services, data and                    the information necessary to identify the key issues and
performance measurement                                     priority actions that will be included in the draft WMMP.
These sections examine how waste is currently               Section 51 of the WMA outlines the requirements of a
managed, where waste comes from, how much there is,         waste assessment, which must include:
its composition and where it goes. The focus of these
sections is on the regional picture.
                                                            •   A description of the collection, recycling, recovery,
                                                                treatment, and disposal services provided within the
Gap analysis and future demand                                  territorial authority’s district
                                                            •   A forecast of future demands
This section provides an analysis of what is likely to
influence demand for waste and recovery services in         •   A statement of options
the region. It identifies key gaps in current and future    •   A statement of the territorial authority’s intended
service provision and in the council’s ability to promote       role in meeting demands
effective and efficient waste management                    •   A statement of the territorial authority’s proposals
and minimisation.                                               for meeting the forecast demands
                                                            •   A statement about the extent to which the
                                                                proposals will protect public health, and promote
                                                                effective and efficient waste management and
                                                                minimisation.

PG | 6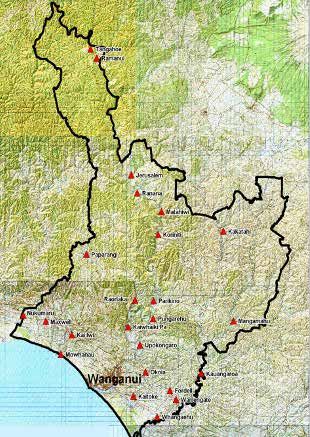
1.3 Legislative context
The principal solid waste legislation in New Zealand is        be readily measured. Therefore, within this WMA, the
the Waste Minimisation Act 2008 (WMA). The stated              council has had to rely on data from external sources
purpose of the WMA is to:                                      that are less than reliable as well as make some
                                                               assumptions based on previous reports and national
“Encourage waste minimisation and a decrease in waste
                                                               information.
disposal in order to
                                                               The New Zealand Waste Strategy 2010 also makes clear
(a) Protect the environment from harm; and
                                                               that TAs have a statutory obligation (under the WMA)
(b) Provide environmental, social, economic, and               to promote effective and efficient waste management
    cultural benefits.                                         and minimisation in their district. This applies to all
                                                               waste and materials flows in the district, not just those
To further its aims, the WMA requires territorial
                                                               controlled by councils.
authorities (TAs) to promote effective and efficient
waste management and minimisation within their
district. To achieve this, all TAs are required by the         1.4.2 Period of waste assessment
legislation to adopt a WMMP.                                   The WMA requires WMMPs to be reviewed at least every
The WMA requires every TA to complete a formal review          six years, but it is considered prudent to take a longer-
of its existing waste management and minimisation plan         term view. The horizon for the WMMP is not fixed but is
at least every six years. The review must be consistent        assumed to be centred on a 10-year timeframe, in line
with WMA sections 50 and 51. Section 50 of the WMA             with council’s long-term plans (LTPs). For some assets
also requires all TAs to prepare a waste assessment            and services, it is necessary to consider a longer time
prior to reviewing its existing plan. This document has        frame, so this is taken into account where appropriate.
been prepared in fulfilment of that requirement. The
council’s existing Waste Assessment was written in 2015        1.4.3 Consideration of solid, liquid and
and the WMMP was adopted on 18 November 2015.
                                                               gaseous wastes
The Ministry for the Environment is currently taking
a lead role in developing a new waste strategy and             In line with the council’s previous WMMP, this Waste
is conducting a review of our waste and resource               Assessment is focused on solid waste that is disposed
efficiency legislation.                                        of to land or diverted from land disposal.

Further detail on key waste-related legislation is             The guidance provided by the Ministry for the
contained in Appendix A.3.0.                                   Environment on preparing WMMPs states that:
                                                               ‘Councils need to determine the scope of their WMMP in

1.4 Scope                                                      terms of which wastes and diverted materials are to be
                                                               considered within the plan.’
                                                               The guidance further suggests that liquid or gaseous
1.4.1 General                                                  wastes that are directly managed by a TA or are
As well as fulfilling the statutory requirements of the        disposed of to landfill, should be seriously considered
WMA, this Waste Assessment will build a foundation             for inclusion in a WMMP.
that will enable the council to update its WMMP in             Other wastes that could potentially be within the
an informed and effective manner. In preparing this            scope of the WMMP include gas from landfills and the
document, reference has been made to the Ministry for          management of biosolids from wastewater treatment
the Environment’s Waste Management and Minimisation            plant (WWTP) processes.
Planning: Guidance for Territorial Authorities.
                                                               The nearest landfill to Whanganui district is Bonny Glen
A key issue for this Waste Assessment will be forming a        landfill, which has a landfill gas capture system in place.
clear picture of waste flows and management options in
the district. The WMA requires that a waste assessment         Biosolids from the WWTP processes are currently not
must contain:                                                  disposed of at Class 1 landfills, so it is reasonable to
                                                               not consider them in the context of this assessment.
‘A description of the collection, recycling, recovery,         Currently, and for the next three to four years, the
treatment, and disposal services provided within the           biosolids from the WTTP are being stockpiled in a lined
territorial authority’s district (whether by the territorial   pond the council has on site.
authority or otherwise).’
                                                               Therefore, apart from some liquid hazardous wastes that
This means that this Waste Assessment must take into           are managed through solid waste facilities, this Waste
consideration all waste and recycling services carried         Assessment and the subsequent WMMP will focus
out by private waste operators as well as the TA’s own         primarily on solid waste.
services. While the council has reliable data on the
waste flows that it controls, data on those services
provided by private industry is limited. The council
only controls approximately 10% of the waste stream
by volume. Reliable, regular data on waste flows is
important if the TA chooses to include waste reduction
targets in their WMMP. Without data, targets cannot

                                                                       WHANGANUI DISTRICT COUNCIL - WASTE ASSESSMENT 2021   PG | 7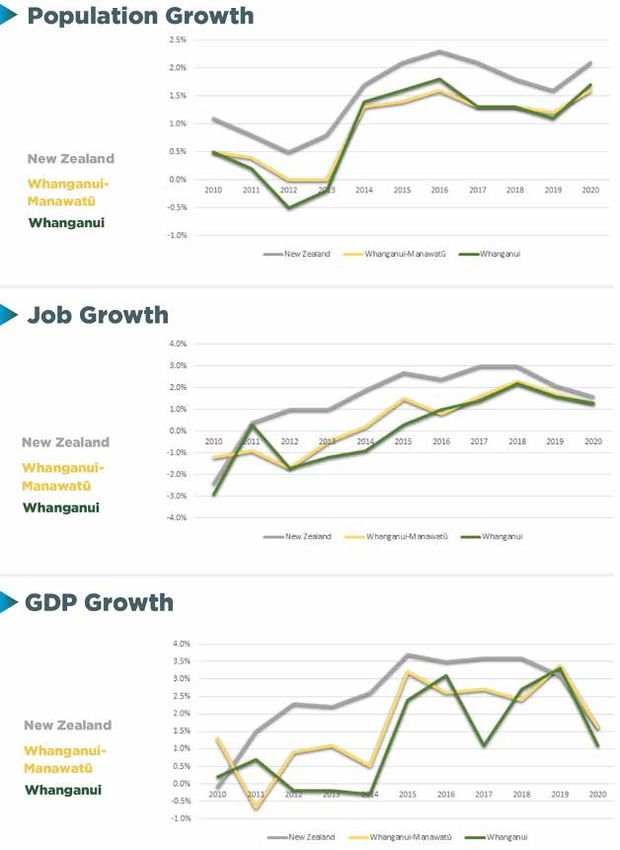
1.4.4 Public health issues
Protecting public health is one of the original reasons      For example, illegal dumping tends to take place
for local authority involvement in waste management.         ubiquitously, irrespective of whatever waste collection
The New Zealand Waste Strategy 2010 contains the             and transfer station systems are in place. Some systems
twin high-level goals of ‘reducing the harmful effects of    may exacerbate the problem (infrequent collection, user
waste’, and ‘improving the efficiency of resource use’. In   charges, inconveniently located facilities, etc.) but, by
terms of addressing waste management in a strategic          the same token, the issues can be managed through
context, protection of public health can be considered       methods such as enforcement, education and the
one of the components entailed in reducing harm.             provision of convenient facilities.
Protection of public health is currently addressed by        In most cases, public health issues will be able to
a number of pieces of legislation. Discussion of the         be addressed by setting appropriate performance
implications of the legislation is contained in Appendix     standards for waste service contracts. It is also
A.3.0.                                                       important to ensure performance is monitored and
                                                             reported on and that there are appropriate structures
Key issues that are likely to be of concern in terms of
                                                             within the contracts for addressing issues that arise. A
public health include the following:
                                                             current review of health and safety in the waste sector
•   Population health profile and characteristics            could impact which collection methodologies are
•   Meeting the requirements of the Health Act 1956          preferred, working practices and the design of waste
                                                             facilities.
•   Management of putrescible wastes
•   Management of nappy and sanitary wastes                  In addition, public health impacts will be able to be
                                                             managed through consideration of potential effects of
•   Potential for dog/seagull/vermin strike
                                                             planning decisions, especially for vulnerable groups.
•   Timely collection of material                            That is, potential issues will be identified prior to
•   Locations of waste activities                            implementation so their impact can be mitigated.
•   Management of spillage
•   Litter and illegal dumping
•   Medical waste from households and healthcare
    operators
•   Storage of wastes
•   Management of biosolids/sludges from WWTP
•   Management of hazardous wastes (including
    asbestos, e-waste, etc.)
•   Private on-site management of wastes (i.e. burning,
    burying)
•   Closed landfill management including air and water
    discharges, odours and vermin
•   Health and safety considerations relating to
    collection and handling
•   Waste from former industrial sites.
From a strategic perspective, the public health issues
listed above are likely to apply to a greater or lesser
extent to virtually all options under consideration.

PG | 8
1.5 Strategic context
1.5.1    New Zealand Waste Strategy                          1.5.2 International commitments
The New Zealand Waste Strategy: Reducing Harm,               New Zealand is party to the following key international
Improving Efficiency (NZWS) is the government’s core         agreements:
policy document concerning waste management and
                                                             1.   Montreal Protocol – to protect the ozone layer by
minimisation in New Zealand.
                                                                  phasing out the production of numerous substances
The two goals of the NZWS are:
                                                             2.   Basel Convention – to reduce the movement of
1.   Reducing the harmful effects of waste                        hazardous wastes between nations
2.   Improving the efficiency of resource use.               3.   Stockholm Convention – to eliminate or restrict the
                                                                  production and use of persistent organic pollutants
The NZWS provides high-level, flexible direction to
                                                             4.   Waigani Convention – bans export of hazardous or
guide the use of the tools available to manage and
                                                                  radioactive waste to Pacific Islands Forum countries.
minimise waste in New Zealand. These tools include:
                                                             The Basel Convention in particular has implications
•    The Waste Minimisation Act 2008
                                                             for waste management, particularly following the
•    Local Government Act 2002                               amendments to the convention in 2019 which were
•    Hazardous Substances and New Organisms Act 1996         aimed at discouraging the international trade of low-
•    Resource Management Act 1991                            value mixed plastic. From 1 January 2021, most exported
                                                             mixed plastic required consent from the receiving
•    Climate Change Response Act 2002 and Climate
                                                             country before they leave New Zealand’s shores.
     Change (Emissions Trading) Amendment Act 2008
•    International conventions
•    Ministry for the Environment guidelines, codes
     of practice
•    Voluntary initiatives.
The flexible nature of the NZWS means that councils are
able to decide on solutions for waste management and
minimisation that are relevant and appropriate to local
situations and desired community outcomes.
Section 44 of the WMA requires councils to have regard
to the NZWS when preparing their WMMP.
While noting that the Ministry is currently in the process
of reviewing the NZWS, the council has given regard to
the NZWS and the current WMMP (2015) in this Waste
Assessment.

                                                                     WHANGANUI DISTRICT COUNCIL - WASTE ASSESSMENT 2021   PG | 9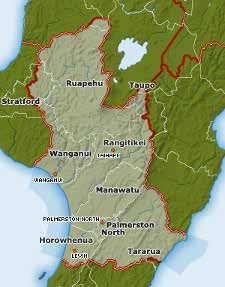
1.5.3 National projects
A number of national projects are underway to
support waste management and minimisation.

1.   Ministry for Environment work programme                2. Climate Change Commission
Projects recently completed by MfE include:
                                                            The Climate Change Commission is an independent
•    Banning single-use plastic carrier bags under 70       Crown entity, formed following the adoption of the
     microns in thickness                                   Climate Change Response (Zero Carbon) Amendment
•    Consulting on proposals to increase and expand         Act in 2019. This Act provides a framework for reducing
     New Zealand’s landfill levy                            emissions by 2050 and achieving a climate resilient
                                                            future. The Climate Change Commission was established
•    Naming six priority products – plastic packaging,
                                                            to provide independent expert advice to government
     tyres, electrical and electronic products (e-waste),
                                                            and to monitor/review progress towards emissions
     agrichemicals and their containers, refrigerants and
                                                            reduction and adaptation.
     farm plastics
•    Supporting the development of a beverage               The draft Climate Change Commission Advice was
     container return scheme.                               released for consultation in early 2021, and the
                                                            Commission finalised its advice during May 2021.
The ongoing work programme includes:
•    Implementing the landfill levy changes from 1 July     3.National kerbside standardisation
     2021
                                                            In 2020, the Ministry for the Environment contracted
•    Collecting landfill levy-related data from Class 2-4   WasteMINZ to undertake an engagement project with
     landfills as well as Class 1                           the waste sector across New Zealand to determine best
•    Regulating the provision of data from Class 5          practice kerbside collection methodologies for rubbish,
     landfills and transfer stations                        recycling and organics.

•    Supporting the development and implementation of       The project included recommendations for materials
     product stewardship programmes for the six priority    to be collected in kerbside recycling, and their
     products                                               presentation.

•    Reviewing the New Zealand Waste Strategy, the          The four key recommendations provided by this report are:
     Waste Minimisation Act and the Litter Act              •   Standardise materials to be collected in domestic
•    Introducing a national resource recovery work              kerbside recycling collections across the country,
     programme to increase the amount of waste                  and how they should be presented, to increase
     diverted form landfill and improve recycling, with a       consistency, reduce confusion for householders and
     focus on an infrastructure investment strategy             reduce contamination

•    Developing and extending performance reporting         •   Incentivise local authorities to collect food waste
     for TAs.                                                   for composting or AD to reduce kerbside residual
                                                                rubbish to landfill
These projects are likely to have a significant impact on
the way waste management and minimisation evolves           •   Incentivise local authorities to collect glass
over the period of a new WMMP, particularly changes             separately to other recyclable materials to improve
in the scope and rate of the landfill levy and a beverage       the quality of all materials accepted in kerbside
container return scheme.                                        recycling
                                                            •   Provide best practice recommendations for food
                                                                waste, recycling and residual rubbish collections to
                                                                increase consistency across the country.

PG | 10
4. Waste data 5. National standardisation of colours for bins
The national waste data framework (WDF) was a project Since 2015, anyone providing collections of waste and
led by WasteMINZ, with funding through the Waste diverted materials has been strongly encouraged to
Minimisation Fund, and provided the following: comply with this national standard, which is for bin
bodies:
• A staged development approach for a full WDF,
focusing initially on the most important elements (a) For 240L and 120L wheeled bins, black or dark
while also setting out a clear ‘upgrade’ path to green should be used. These colours maximise the
include other elementsThe completed first stage amount of recycled content used in the production
covers data relating to waste disposed of at levied of the bins.
disposal sites (Class 1 landfills) and information on
(b) For bin lids, crates and internal office bins:
waste services and infrastructure, as well as other
areas where practicable • Red should be used for rubbish
• Subsequent stages of the WDF will include more • Yellow should be used for commingled recycling
detailed data on diverted materials and waste (glass, plastic, metal and paper combined)
disposed of at non-levied disposal sites. • Lime green should be used for food waste and food
waste/garden (referring to green) waste combined,
The implementation of the WDF has been variable
noting that food waste-only collections are strongly
to date, although increasingly the terminology and
encouraged to use a smaller bin size than combined
protocols are being used in data collection by waste
food and garden collections.
operators and reporting. The MfE and a number of TAs
around the country are currently working on projects • Dark green should be used for garden waste.
that will improve the quantity and quality of waste data • Light blue should be used for commingled glass
available. collections (white, brown, green glass combined).
• Grey should be used for paper and cardboard
The council uses the categories and terminology of the recycling.
WDF in the Waste Assessment and the forthcoming
WMMP. The council will reflect these colours if/when bins are
supplied for contracts and services locally, and will also
incorporate these colours into proposed waste operator
conditions.
6. Rural waste minimisation project
Two research projects (in the Canterbury region and the
Waikato/Bay of Plenty regions) have been carried out
to better understand the nature of waste on farms and
to begin the identification of alternatives to burning,
burial and bulk storage of waste. The projects had the
following objectives:
1. To determine the impacts on and risks to New
Zealand’s natural resources (land, water and air),
economy, and social and cultural well-being from
current rural waste burning, burying and stockpiling
practices
2. To identify new waste minimisation options for rural
waste management and assess the technical and
economic feasibility of these
3. To develop implementation plans with service
providers for feasible waste minimisation options.
Practical outcomes from this project have so far been
few but could facilitate the development of rural waste
solutions in our district.
WHANGANUI DISTRICT COUNCIL - WASTE ASSESSMENT 2021 PG | 111.6 Local and regional Timeline: Policy team looking to go out to consultation
in late 2020, with a final Climate Change Strategy to be
planning context discussed and adopted by council in early 2021.
This Waste Assessment and the resulting WMMP, have
• Leading Edge Strategy
been prepared within a local and regional planning
context whereby the actions and objectives identified Leading Edge is about Whanganui being seen as
in the Waste Assessment and WMMP reflect, intersect positive and exciting – a community that is united,
with, and are expressed through other planning connected, creative, environmentally rich and
documents. Key planning documents and waste-related economically prosperous.
goals and objectives are noted in this section.
The Leading Edge Strategy sets out to achieve the
targets in our Waste Management and Minimisation
1.6.1 Long-term plan Plan. To achieve this goal we will pursue green tech
approaches and take a responsible approach to the
A key part of the Whanganui long-term plan (LTP) is
disposal of waste, enhance our responsibilities in
the Leading Edge Strategy which acts as the council’s
relation to sustainable land use and pursue innovative
overarching strategic document.
partnerships to value resources and eliminate waste,
This strategy’s vision is: promote environmentally sustainable practices to divert
more waste to landfill and to position disposal as the
‘To be an energised, united and thriving district last choice behind reduced waste-producing habits,
offering abundant opportunities for everyone.’ reuse of products and recycling.
Strategic pillars: The council has devised a Whanganui District Housing
• Community - A deeply united community Strategy, the vision for which is:
• Connectivity - Connected
• Creativity - Innovative and creative ‘Everyone in Whanganui has the
• Environment - Safeguarding our place right housing opportunities and
• Economy - Works for everyone
a great neighbourhood to live in.’
Key LTP projects/actions
The goals driving this strategy are that Whanganui’s -
Key issues:
• Housing systems and infrastructure function well
1. Pandemic, recovery and worldwide recession
• Homes are good quality and future-proofed
2. Catering for projected population growth and the • Homes meet the needs of our people
associated growth-related issues (housing)
• Housing network supports united, thriving and
3. Climate change adaptation and mitigation connected communities
4. Increasing regulatory standards, legislation Comment: The council’s housing strategy and
changing response to earthquake-prone building upgrade needs
(Whanganui is overrepresented with earthquake-prone
5. Affordability
buildings requiring retrofitting or demolition to meet
seismic building codes), coupled with Whanganui’s
1.6.2 Other local plans economic growth of late including the building sector,
means there will undoubtedly be more construction and
The council has a number of other plans relating to the
demolition waste produced over the next period.
Whanganui district that have been considered when
preparing this assessment. These include:
1.6.3 Regional council plans
• Climate Change Strategy
Horizons Regional Council, which covers the Manawatū–
Since 2018, Whanganui District Council has developed Whanganui region, adopted the One Plan in November
and costed a Climate Change Outcomes Strategy 2014. This document covers the requirements of the
which identifies actions that the council could take to consolidated regional policy statement, the regional
demonstrate its commitment to addressing climate plan, and the regional coastal plan for the region.
change – a lead by example approach.
In the One Plan, the regional council states that it
Vision: A leading edge, climate- recognises ‘the need to focus on the full life cycle of
waste from generation to disposal, and that waste is a
smart and resilient district that wasted resource’. The plan goes on to discuss specific
has an informed and proactive requirements with respect to hazardous substances and
contaminated land.
community in the face of Waste is defined as ‘any material, solid, liquid or gas
climate change. that is unwanted or unvalued and discarded
or discharged’.
Chapter three of the One Plan sets out the objectives,
policies and methods relating to waste.
PG | 12Increased quantities of waste produced and hazardous Policy 3-10 Cleanfills, composting and other
substances used results in concern in several areas: waste reduction activities
• Wasted resources and an increasing need for ‘Waste reduction activities will be encouraged,
appropriate disposal in particular by generally allowing cleanfills and
• Potential for poor management of hazardous composting activities.’
substances
• Potential for land contamination, leading to risks to Policy 3-11 Landfill management
people and environment. ‘Landfills must generally be designed, constructed,
The waste management objective included in the One managed, operated, remediated and monitored in line
Plan is: with appropriate guidelines and national environmental
standards. Taking into account the applicability of these
‘The regional council and territorial authorities must guidelines and standards in relation to the type and
work together in a regionally consistent way to: scale of activity proposed, the following guidelines may
i. Minimise the quantity of waste generated in the be considered appropriate:
region and ensure it is disposed of appropriately (a) Centre for Advanced Engineering Landfill
ii. Manage adverse effects from the use, storage, Guidelines, April 2000
disposal and transportation of hazardous substances (b) Ministry for the Environment, Module 1: Hazardous
iii. Manage adverse effects from contaminated land.’ Waste Guidelines – Identification and Record
Keeping, June 2002, ME637
Solid waste facilities such as landfills, transfer stations
and resource recovery facilities should be recognised (c) Ministry for the Environment, Module 2: Hazardous
as being physical resources of regional and national Waste Guidelines, Landfill Waste Acceptance
importance. These should be managed in a way that Criteria and Landfill Classification, May 2004, ME510
considers the significant benefits derived from the (d) Ministry for the Environment, A Guide to the
assets. Management of Cleanfills, January 2002, ME418
The One Plan includes four policies intended to give (e) Ministry for the Environment, A Guide to the
effect to the objective above. These policies are as Management of Closing and Closed Landfills in New
follows: Zealand, May 2001, ME390
Policy 3-8 Waste policy hierarchy (f) Ministry for the Environment, Guide to Landfill
Conditions, May 2001, ME389
‘Wastes, including solid, liquid, gas and sludge waste,
must be managed in accordance with the following (g) Ministry for the Environment, Good Practice Guide
hierarchy: for Assessing and Managing the Environmental
Effects of Dust Emissions, September 2001
(a) Reducing the amount of waste produced
(h) Landfill Gas Collection and Destruction or Reuse
(b) Reusing waste in Accordance with the Resource Management
(c) Recycling waste (National Environmental Standards Relating to
Certain Air Pollutants, Dioxins and other toxics)
(d) Recovering resources from waste Regulation 2004.’
(e) Appropriately disposing of residual wastes. Cleanfills are defined as landfills only accepting:
“Materials such as clay, soil and rock, and other inert
Policy 3-9 Consent information requirements –
materials such as concrete or brick that are free of:
waste policy hierarchy and hazardous substances
a. Combustible, putrescible (except that cleanfill
‘Where a proposal has the potential to give rise material can contain up to 5% by weight putrescible
to significant adverse effects on the receiving matter), degradable or leachable components
environment, an assessment must be required, as
part of the consent information requirements for all b. Hazardous substances
discharges to air, land, water and the coastal marine
c. Products or materials derived from hazardous
area, of:
waste treatment, hazardous waste stabilisation or
(a) Reduction, reuse, recycle and recovery options hazardous waste disposal practices
for the discharge in accordance with Policy 3-8, and
d. Materials that may present a risk to human health
(b) Any hazardous substances that may be present in
e. Liquid waste.’
the discharge, and alternatives to those hazardous
substances. This definition departs from the waste acceptance
criteria set out in the 2016 Technical Guidelines for
Disposal of Waste to Land in two key respects – firstly,
the criteria allow no more than 2% of biodegradable
material by volume per load; and secondly,
manufactured materials such as concrete and brick are
permitted to make up no more than 5% by volume per
load.
WHANGANUI DISTRICT COUNCIL - WASTE ASSESSMENT 2021 PG | 13The non-regulatory methods associated with the under the Local Government Act (2002) rather than the
objective and policies above are: Waste Minimisation Act (2008). The One Plan also refers
to the New Zealand Waste Strategy 2002, particularly
Method 3-1 Regional Territorial Authority Waste with respect to targets (even though this document was
Forum: Work with the territorial authorities to reviewed in 2010) and any specific targets removed.
achieve a regionally consistent approach to
waste and to progress region-wide waste issues Although the One Plan was not adopted until 2014,
and implement agreed initiatives, including: large sections of the plan were notified for consultation
as early as 2007, so referred to strategies and legislation
• Hazardous waste disposal facilities that were in effect at that time. As no submissions were
• Recycling facilities received with respect to the waste section of the plan,
it was not possible to update this section prior to final
• Resource recovery network waste exchange
adoption.
• Public information
• Waste education schools Horizons Regional Council acknowledges that there
• Consistent waste data collection and reporting are references in the One Plan that are now dated
and perhaps even obsolete, but also notes that the
• Development of region-wide waste reduction
changes which took place following the introduction of
targets in line with the New Zealand Waste
the Waste Minimisation Act in 2010 have significantly
Strategy 2002
reduced any statutory role it plays in solid waste
• Cleanfill management and monitoring management and planning, beyond a consenting and
• Waste minimisation and cleaner production in monitoring role.
business/trade sectors
• Economic instruments including incentives for 1.6.4 Cross-regional collaboration
waste reduction.
The councils within the wider Horizons Regional Council
Method 3-2 Public Information: Easily accessible area collaborate on areas of mutual benefit and meet
information will be developed and provided informally to share waste management information and
to increase public awareness of waste issues happenings. An example of collaboration is Manawatū
generic to the region, including: District Council providing shared services for Rangitīkei
District Council, which include waste management
• Cleanfill management and guidelines advice and actual joint services. We are not aware of
any other joint services in the region.
• Waste minimisation
• Availability of waste disposal and recovery facilities
(including for campervans)
• Fly-tipping
• Hazardous substances
• Burning of waste
• Offal pits and farm dumps
• Septic tank discharges
• Composting.
PG | 142.
Manawatū-
Whanganui
region
This section presents a brief
overview of key aspects of the
region’s geography, economy and
demographics. These key aspects
influence the quantities and types
of waste generated and potential
opportunities for the council to
manage and minimise these wastes in
an effective and efficient manner.
WHANGANUI DISTRICT COUNCIL - WASTE ASSESSMENT 2021 PG | 152.1 Overview Whanganui is one of the two main urban centres in the region, along with Palmerston North City. Local authorities in the region comprise 10 territorial authorities and the Manawatū-Whanganui Regional Council, trading as Horizons Regional Council. The region completely covers five territorial authorities (Palmerston North City and Whanganui, Manawatū, Horowhenua and Ruapehu districts), and part of five (Tararua, Rangitīkei, Stratford, Waitomo and Taupō Districts) – these five territorial authorities are also included in the regions of Waikato, Bay of Plenty, Taranaki, Hawke’s Bay and Wellington. The land area of the region covers 22,215 hectares. It has a diverse geography, dominated by two river systems – the Manawatū, which is characterised by rolling farmland, and the Whanganui, which travels through forest-covered mountains and hills. Figure 1: Map of region and territorial authority areas PG | 16
3.
Our district
This section presents a brief
overview of key aspects of the
district’s geography, economy and
demographics. These key aspects
influence the quantities and types
of waste generated and potential
opportunities for the council to
manage and minimise these wastes
in an effective and efficient manner.
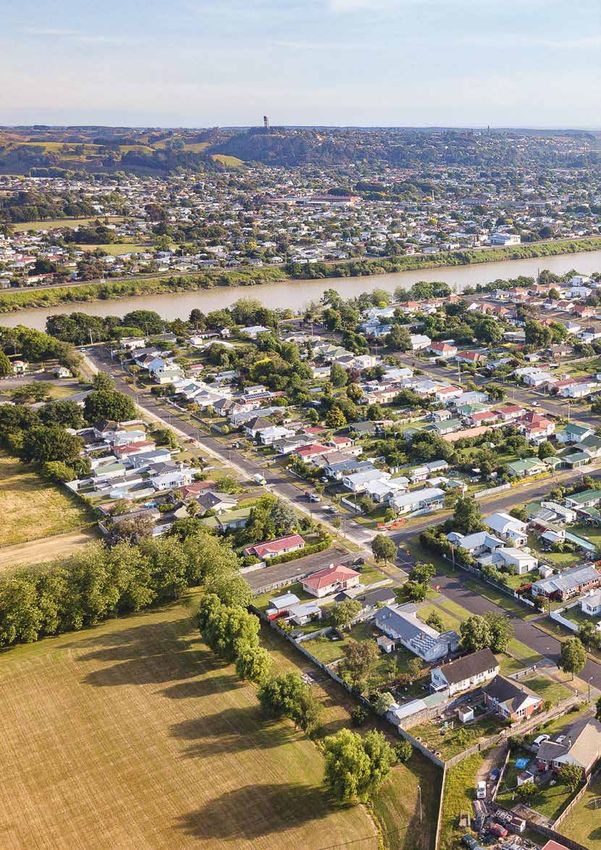
WHANGANUI DISTRICT COUNCIL - WASTE ASSESSMENT 2021 PG | 17Figure 2: Map of district
3.1 Physical characteristics
3.1.1 Overview
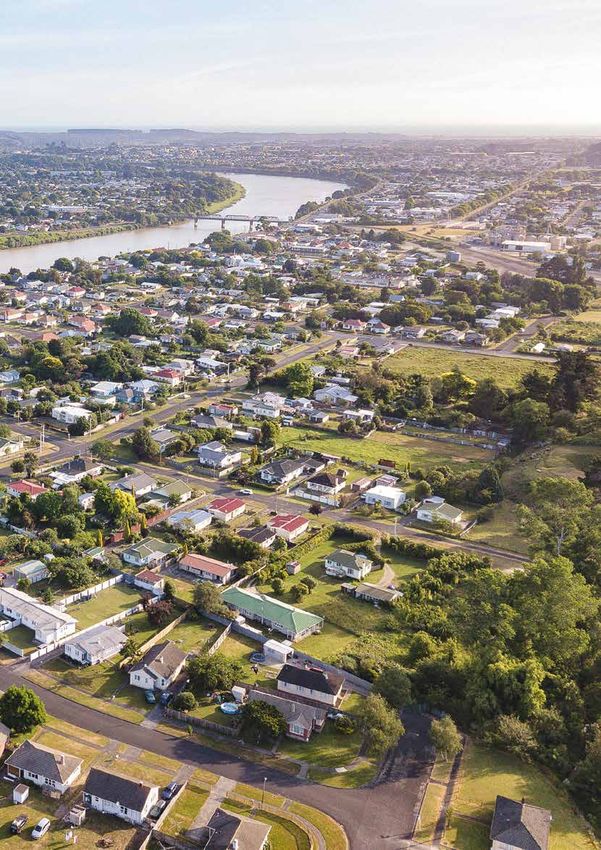
Our district has a land area of 2,373km2. Key features The vast majority of people (37,000 of us) and
are hill country, with deep incised rivers and narrow households are located within 10 minutes of the city
valleys, and rugged coastal areas. The main population centre, making kerbside collections for the majority
centre in the district is Whanganui. At the 2013 Census, relatively easy. The rural population (6,000 people) is
the district had a usually resident population of 42,153 spread far and wide, often in remote locations – apart
on census night (a decrease of 486 people from from the main rural townships of Mowhanau, Brunswick,
2006). However, the estimated population count of the Upokongaro and Fordell.
Whanganui district as of 2019 is 47,300.
Whanganui has a higher than national average median
We sit on the south-west coast of the North Island age of 40 and this is projected to get even older.
facing the Tasman Sea, south of Taranaki and Ruapehu In addition, 12,500 people within the district are
regions, and north of Manawatū. This area is known beneficiaries of some sort. The median personal income
for Māori culture, heritage and Whanganui National is around $20,000.
Park, and river activities as a result of our position
Our district is the third oldest settlement in New
on the banks of the Whanganui River. Whanganui is
Zealand. Its original discovery is attributed to Kupe, New
reasonably centrally located on the west coast of the
Zealand’s legendary discoverer. Tamatea, Captain of the
North Island, with Palmerston North one hour south and
Takitimu waka, explored the region fully and, soon after,
New Plymouth two hours north as our nearest ‘big city’
attracted by the Whanganui River, Māori settlers came
neighbours.
to the region.
Figure 2: Map of District
PG | 183.1.2 Geography
The district has a land area of 2,373 km2, the majority of which is hill country, with deeply incised rivers and narrow
valleys. The coastal lowland areas are marine terraces separated by old sea cliffs, resulting from a series of uplifts.
Rivers and streams have cut deep valleys into these surfaces. A belt of sand dunes lies along the coast, and in places
fossil dunes extend up to 7km inland, overlying parts of the marine terraces and blocking streams to form a chain of
small shallow lakes. North-west of the city, a 45m-high cliff extends along the coast fronted by a wide sandy beach.
Coastal, terrace and river valley landscapes are largely rural in character, dominated by mainly pastoral farming.
Further inland, especially to the north-west, there is a much greater proportion of scrub and forest cover. The
Whanganui and Whangaehu rivers and their main tributaries flow in a general southerly direction.
A large portion of the district is within the Whanganui National Park. The park is administered by the Department of
Conservation and comprises a main core area, with smaller outliers to the north and south, covering a total area of
74,231 hectares. The Whanganui River is the second largest river in the North Island and the longest navigable waterway
in the country, covering 290km from the heights of Mount Tongariro to Whanganui’s coast and the Tasman Sea.
3.1.3 Climate 3.1.4 Demographics
We are noted for our temperate climate, but Whanganui’s population distribution and growth is
Whanganui’s position on the coast, alongside a river shown in Figure 3 below:
and with a catchment comprising steep hill country
Population and growth:
underlain by soft rock means that Whanganui has
experienced, and will continue to experience, a large • 2019 population = 47,300
number of weather-related events. The Ministry for
the Environment publication entitled Climate Change
• Significant migration since 2013 census
and Long-Term Council Community Planning includes • Average growth was 590 people per annum since
a number of predictions about New Zealand’s future 2013 (accelerated since 2016)
climate:
• Ageing population – it is predicted that from 2021
• Temperatures will rise on average by 1°C by 2040 there will be more deaths than births until 2040.
and 2°C by 2090 Deaths stay at current levels (430–450) until 2030
then rise to 580 per annum in 2050.
• Rainfall will increase in western areas by up to 5%
by 2040 and 10% by 2090. There will be increased
seasonality in the rainfall distribution patterns
• Sea levels will rise 2019 population
• Frosts will decrease
= 47,300
• There will be an increased frequency of high
temperatures
• There will be an increase in the frequency of
extreme daily rainfalls
• Possible increase in strong winds
• Increases in the severity and frequency of extreme
weather events.
WHANGANUI DISTRICT COUNCIL - WASTE ASSESSMENT 2021 PG | 19Figure 3: Population projections 1 Whanganui District Population Projections LTP 2021-2031 The population projections below have been produced is an insufficient evidence base to determine the entire in consideration of both short- and long-term trends projection of 30 years, so beyond 2028, the medium for the Whanganui region. Although long-term trends projection follows a path that could be described as in would suggest relatively weak population growth between long-term historic and recent historic trends. underpinned by weak or negative net migration, recent The high projection portrays a scenario in which recent trends suggest strong population growth driven by historic trends are sustained for a longer period. strongly positive net migration. A further consideration is weakening international net migration at a national level, accelerated by Covid-19, which is likely to push down net migration into the region. Figure 4 below displays the population growth rates for the region across the three scenarios. The medium projection sustains recent strong net migration and population growth for the next 10 years. However, the strength of the region’s population growth since 2013 1 Source: Statistics NZ sub-national population estimates 2 (Infometrics: Manawatu-Wanganui Projections 2018-2053 July 2020) 3 (Infometrics: Manawatu-Wanganui Projections 2018-2053 July 2020) PG | 20
Figure 4: Population growth rate 2

The Manawatū-Whanganui region has a relatively youthful population, and as a result, the
population experiences strong natural increase, with births outnumbering deaths. Over the past
two decades, net migration has predominantly been negative, with net outflows of people from
the region. However, net migration has turned positive in the past five years, reaching record high
levels, which may indicate an increase of waste generated and disposed of.

Figure 5: Components of population change3

As a result of Covid-19 and the associated recession, employment in Manawatū-Whanganui is
forecast to fall by 8.5% over the year to March 2021, just below the national decline of 9.9%.
Employment is forecast to steadily recover from 2023 onwards, with Manawatū-Whanganui
broadly following the national trend. This includes weak growth expectations from 2030
onwards, based on the introduction of more stringent carbon pricing and environmental
regulation, coupled with adoption of automation technology, which will dent employment,
particularly in the primary sector.
Taking the medium projection suggests a small population growth which would likely result in a
small increase of waste generation.

                                                                     WHANGANUI DISTRICT COUNCIL - WASTE ASSESSMENT 2021   PG | 21
Figure 6: Whanganui district population projection
Scenario High Medium Low
2018 46,680.00 46,680.00 46,680.00
2019 47,300.00 47,300.00 47, 300.00
2020 47,759.00 47,582.00 17,389.00
2021 47,991.00 47,724.00 47,435.00
2022 48,312.00 47,921.00 47,497.00
2023 48,708.00 48,164.00 47,574.00
2028 51,042.00 49,438.00 47,949.00
2033 53,385.00 50,182.00 47,488.00
2038 56,490.00 51,149.00 46,946.00
2043 61 ,110. 00 52,841.00 46,701.00
2048 65,467.00 54,243.00 46,112.00
2053 68,322.00 54,692.00 44,792.00
The following table shows key demographic metrics for the district.
Figure 7: Demographic indicators
2018 Census Data
Households Dwelling
Demographic Unoccupied Median Home Formal
(Occupied Under
Indicators Dwellings Income Ownership Qualifications
Dwellings) Construction
Whanganui
18,153 1,557 24,400 55.20% 9.40% 36
District
Source: https://www.stats.govt.nz/tools/2018-census-place -summaries/whanganui-district
Changing population will form different households: the decreasing household size is a function of changes in
household formation. The fastest growing household types are one person and couple without children households.
Due to overall growth in the number of households, all household types are projected to grow to some extent.
PG | 22Figure 8: Households by type
This data suggests household size will decrease across the region but
household numbers will still increase overall.
Figure 9: Whanganui building consent numbers
(as an indicator of increased waste from households)
The numbers of residential building consents are increasing which suggests
a similar level of waste generation will increase.
WHANGANUI DISTRICT COUNCIL - WASTE ASSESSMENT 2021 PG | 233.2 Economy
Whanganui in 2016–2017. The industry grew by 4.6% over the year and contributed 0.5% to the district’s total growth
of 2.4%. Among broad industries, health care and social assistance was the largest employer in Whanganui in 2017,
accounting for 16.1% of total employment. The second largest employer was manufacturing (13.7%) followed by retail
trade (10.1%). A total of 3897 business units were recorded in Whanganui in 2017, down 1.8% from a year earlier. The
number of business units in New Zealand increased by 2.1% over the same period.
Analysis of the five-year age groups of the Whanganui district in 2017 compared to New Zealand shows that there
was a similar proportion of people in the younger age groups (under 15) and a higher proportion of people in the
older age groups (65+). Overall, 20.3% of our population were aged between 0 and 14, and 20.5% were aged 65 years
and over, compared with 20.4% and 14.3% respectively for New Zealand. 4
Council land use consents and subdivision consents
Land use consents have increased 24% over the 10 years from 2010 to 2020. Subdivision consents have increased 54%
over the same 10-year period. The increases year on year over the past four years show a growth in housing numbers
and may mean a comparable increase in waste generation.
Figure 10: Resource consents
Resource
Land Use Subdivision Total
Consents
2020 155 106 261
2019 150 92 242
2018 132 91 223
2017 134 63 197
2016 109 57 166
2015 124 39 163
2014 132 57 189
2013 144 54 198
2012 107 54 161
2011 118 39 157
2010 119 22 176
Rural sector
Whanganui’s economy has an agricultural base – mainly sheep, beef and dairy – and has a strong primary processing
sector. Whanganui’s economic footprint extends well beyond our district boundary, with products and services
flowing to and from Whanganui into neighbouring districts and townships. In 2017, the agriculture, forestry and fishing
sectors were responsible for 6.1% of employment, 8.6% of GDP and 17.8% of business units in the Whanganui district 5.
4
Population Experts 2013-2017 Census and Forecast Data
5
Infometrics analysis March 2017
PG | 24Figure 11: Population, job, GDP growth6
6
Infometrics
WHANGANUI DISTRICT COUNCIL - WASTE ASSESSMENT 2021 PG | 25Figure 12: GDP growth 3.3 Implications of economic and demographic trends While the job and GDP graphs show a decline in the 2019-2020 period, the population graph shows an increase which, when building and subdivision consents are taken into consideration, suggest an increase in waste generation is likely. The retail sector was hit during the Covid lockdown and some businesses have not recovered. This is unlikely to have much of an impact on waste to landfill as this sector’s proportion of waste is minimal. PG | 26
4.
Waste
infrastructure

Most of the facilities available in
the Whanganui district are owned,
operated and/or managed by
commercial entities, with some owned
and/or operated by the council or
community groups.

          WHANGANUI DISTRICT COUNCIL - WASTE ASSESSMENT 2021   PG | 27
Since the late 1990s, Whanganui District Council has followed a conscious strategic direction and withdrawn from owning or providing waste facilities and services, allowing the market to assume provision of services – except where there were market gaps or failures. This has resulted in today’s situation where the council only controls approximately 9% of the waste stream by weight. The current infrastructure situation for Whanganui district can be summarised as follows: • No local landfill or publicly-owned landfill • Our waste disposal is accommodated in a privately owned landfill in the Rangitīkei district. • Two transfer stations separately owned by private firms; only one is public • Whanganui Resource Recovery Centre • Easy Earth organic collection and compost operation. This inventory is not to be considered exhaustive, particularly with respect to the commercial waste industry as infrastructure is subject to change. It is also recognised that there are many small private operators and second-hand goods dealers that are not specifically listed. However, the data is considered accurate enough for the purposes of determining future strategy and to meet the needs of the WMA. The withdrawal from the waste stream has allowed industry advances into waste infrastructure and encouraged the user-pays principle to apply with little or no rates funding. It also means the council has not had to fund costly infrastructure such as landfills, transfer stations and waste collection vehicles. PG | 28
Figure 13: Key waste flows in Whanganui

                             PRIVATE
                           COMPOSTING
                             SERVICE

                                                    PRIVATE END
                                                  POINT RECYCLERS
                                                      RECEIVE
                                                   PRODUCT FOR
                                                    RECYCLING/
                           GREENWASTE-                 REUSE
                            SHREDDED
     COUNCIL                                                                   PRIVATE
    HAZARDOUS                                                                EASY EARTH
      WASTE                                                                    ORGANIC
    COLLECTION                                                               SERVICE AND
       DAYS                                                                   IN-VESSEL
                                                                             COMPOSTER
                                                    WHANGANUI
                                                     RESOURCE
                                                     RECOVERY
                                                      CENTRE
               PRIVATE
             SPECIALISED             SPECIAL
              DISPOSAL                WASTE                                     C&D, ICI,
              SERVICES                                                       LASDSCAPING,
                                                                              RESIDENTIAL

            PRIVATE
           KERBSIDE
          WASTE FROM
                                                      RUBBISH
          WHANGANUI
                                                        BAG
                                                     DROP-OFF
                                                      SERVICE                  PRIVATE
                                                                             COLLECTION
                                                                          SERVICES GENERAL
                                                                            WASTE FROM
                                                                             WHANGANUI
                                                                              DISTRICT
                       COUNCIL
                    PERI-URBAN BAG
                      COLLECTION
                        SERVICE                   RANGITIKEI
                                                   DISTRICT
                                               PRIVATELY-OWNED
                                                BONNY GLEN
             COUNCIL                             LANDFILL
           OUTER RURAL
           BIN DROP OFF
              SERVICE

                                                      WHANGANUI DISTRICT COUNCIL - WASTE ASSESSMENT 2021   PG | 29
4.1 Disposal facilities 4.1.1 Landfills In April 2016, the Waste Management Institute of New Zealand (WasteMINZ) released the final version of the Technical Guidelines for Disposal to Land. These guidelines were then updated and republished in August 2018. The definitions of the five classes of landfills provided in the guidelines are summarised below. Class 1 - Municipal landfill A Class 1 landfill is a site that accepts municipal solid waste. A Class 1 landfill generally also accepts construction and demolition (C&D) waste, some industrial wastes and contaminated soils. Class 1 landfills often use managed fill and cleanfill materials as daily cover. A Class 1 landfill is the equivalent of a ‘disposal facility’ as defined in the WMA. Class 2 - C&D/Industrial landfill A Class 2 landfill is a site that accepts non-putrescible wastes including construction and demolition wastes, inert industrial wastes, managed fill, controlled fill and cleanfill. C&D waste and industrial wastes from some activities may generate leachates with chemical characteristics that are not necessarily organic. Hence there is usually a need for an increased level of environmental protection at Class 2 sites. sites. Class 3 – Managed fill These facilities accept mainly non-putrescible cleanfill and controlled fill, but may include material with contaminant concentrations in excess of controlled fill limits. As contaminated materials may be accepted, these require environmental site assessments, monitoring of accepted material, operational controls and monitoring of surface and ground water. Class 4 - Controlled fill A Class 4 landfill accepts controlled fill material. These comprise predominantly controlled fill and cleanfill materials, but may also include other inert materials and soils with chemical contaminants at concentrations greater than local natural background concentrations. Class 5 - Clean fill A cleanfill is a landfill that accepts only cleanfill materials. The principal control on contaminant discharges to the environment from cleanfills is the waste acceptance criteria. The actual wording used in the guidelines is provided in Appendix A.2.1 There are two Class 1 landfill disposal facilities (as defined above) near the Whanganui district. These are Bonny Glen landfill, near Marton (20 minutes from Whanganui), and Levin landfill. There is one closed landfill in the district. PG | 30
You can also read