Who profits from windfalls in oil tax revenue? Inequality, protests, and the role of corruption - Michael Alexeev and Nikita Zakharov BOFIT ...
←
→
Page content transcription
If your browser does not render page correctly, please read the page content below
BOFIT Discussion Papers
2 • 2022

Michael Alexeev and Nikita Zakharov

Who profits from windfalls in oil tax
revenue? Inequality, protests, and
the role of corruption
BOFIT Discussion Papers
Editor-in-Chief Zuzana Fungáčová

BOFIT Discussion Papers 2/2022
25 January 2022

Michael Alexeev and Nikita Zakharov: Who profits from windfalls in oil tax revenue?
Inequality, protests, and the role of corruption

ISBN 978-952-323-398-0, online
ISSN 1456-5889, online

The views expressed in this paper are those of the authors and
do not necessarily represent the views of the Bank of Finland.

Bank of Finland
Helsinki 2022
Michael Alexeev and Nikita Zakharov Who profits from windfalls in oil tax revenue?
 Inequality, protests, and the role of corruption

 Michael Alexeev and Nikita Zakharov

 Who profits from windfalls in oil tax revenue?
 Inequality, protests, and the role of corruption

 Abstract
 We investigate the relationship between oil windfalls and income inequality using the subnational
 data of one of the resource-richest and most unequal countries in the world – Russia. While previous
 literature produced contradictory findings due to the use of an aggregate measure of oil rents mainly
 in cross-national settings, we focus exclusively on oil rents that accrue to the subnational govern-
 ments across one country. Our estimation strategy takes advantage of the two specific features of
 Russian oil taxation: 1) the policy change when sharing oil extraction taxes with local budgets was
 discontinued; and 2) the oil tax formula being tied directly to the international oil prices making oil
 price shocks an exogenous measure of change in oil rents. When we look at the period with oil tax
 revenues shared with the regional governments, we find that oil windfalls had increased income
 inequality and benefited the wealthiest quintile of the population in regions with more intense rent-
 seeking. Further, positive oil price shocks combined with greater rent-seeking reduced the share of
 labor income but increased the income share from unidentified sources traditionally associated with
 corruption. These effects of oil windfalls disappeared after the Russian government discontinued oil
 tax revenue sharing with regional governments. Finally, we examine some political implications of
 rising inequality due to the appropriation of oil windfalls. We find a positive effect of rising ine-
 quality on the frequency of protests associated with grievances among the poor and disadvantaged
 social groups; this effect, however, exists only in relatively democratic regions.

 Keywords: oil, decentralized revenues, income inequality, corruption, protest, Russia
 JEL codes: D63, D73, Q35, Q38, P48

 Michael Alexeev, orcid.org/0000-0001-6168-7369, Department of Economics, Indiana University, Bloomington,
 IN 47408, email: malexeev@indiana.edu.
 Nikita Zakharov, orcid.org/0000-0001-7153-5799, Department of International Economic Policy, Freiburg
 79098, email: nikita.zakharov@vwl.uni-freiburg.de.

 1
BOFIT – Institute for Emerging Economies BOFIT Discussion Papers 2/2022
Bank of Finland

 1 Introduction
 Many countries heavily tax their oil industry on the premise that natural resources belong to their
 people, but do all the people benefit from oil tax revenues equally? This important question has
 eluded an unambiguous answer. Additional budget revenues from oil windfalls can improve in-
 comes of the poor, and middle class through direct redistribution (as discussed in Parcero and
 Papyrakis, 2016) or increased social spending (Kim and Lin, 2018), but the very same revenues
 are often misappropriated by the wealthy and politically connected elite, thus increasing income
 inequality. Indeed, misappropriation of oil rents by political elites in the form of corruption has
 been well documented in the existing literature (Arezki and Brückner, 2012; Caselli and Michaels,
 2013; Andersen et al., 2017; James and Rivera, 2021; Asher and Novosad 2022), but it has not
 been previously linked to rising income inequality. We hypothesize that the intensity of current
 corruption significantly affects the impact of oil windfalls on income distribution in society, re-
 sulting in a positive association between oil price shocks and inequality in a highly corrupt envi-
 ronment.
 We test our hypothesis using the subnational data for Russia – one of the biggest producers
 of oil and, at the same time, one of the most unequal countries in the world (Novokmet et al.,
 2018). Studying inequality within one country circumvents a major problem of selective underre-
 porting of data on income inequality by resource-rich nations that plagues cross-country studies
 (e.g., Ross, 2007; Parcero and Papyrakis, 2016). There are several additional advantages of using
 the Russian subnational data for our estimation strategy. First, Russian regions are relatively ho-
 mogenous in their legal system, fiscal and monetary policies, but about a third of them are endowed
 with oil wealth, and their budgets had been directly benefiting from a degree of decentralization
 of oil extraction tax revenues until this regime was gradually discontinued in 2010-2012. The het-
 erogeneity of oil endowments across regions and the change in the assignment of oil tax revenues
 over time due to plausibly exogenous policy change enables us to explore the relationship between
 oil tax revenues and income inequality. Second, the formula for calculating regional oil tax revenue
 included the international oil price, and, therefore, oil price shocks can serve as an exogenous
 measure of oil tax revenue fluctuations. We find no evidence that oil price shocks directly affect
 regional income inequality, whether regional budgets receive a share of oil tax revenue or not. To
 examine how this effect is mediated by the ability of regional elites to capture government rents,
Michael Alexeev and Nikita Zakharov Who profits from windfalls in oil tax revenue?
 Inequality, protests, and the role of corruption

 we interact the oil price shocks with the measures of regional intensity of corruption introduced in
 Schulze et al. (2016). We find that in a more corrupt environment, oil windfalls increase the share
 of the top quintile of income distribution and the Gini coefficient, but this effect appears only in
 the period when oil-rich regions were receiving a share of oil extraction taxes. 1 Our findings are
 robust to using an alternative, albeit less precise, regional measure of rent-seeking, the inclusion
 of control variables, and is confirmed by the placebo tests of substituting corruption incidents with
 overall crime or murder.
 Further, we reinforce our main results with the evidence that oil windfalls in a corrupt
 environment affect the composition of income sources by increasing the share of income that can
 be plausibly linked to corruption. We employ regional estimates of income shares derived from
 employment, entrepreneurship, social transfers, property, and from “other sources” calculated as
 a residual from subtracting savings and expenditures from overall income. This latter category is
 the most useful for our case since “other income” includes revenues from the shadow economy
 and illegal activities, and Gorodnichenko and Sabirianova Peter (2007) propose using it as a meas-
 ure of corruption income. Our data show that in the environment of increasing corruption, the share
 of “other income” rises consistently after a positive oil price shock while the income share from
 employment declines.
 Finally, we look at the political implications of rising inequality due to the appropriation
 of oil windfalls. On the one hand, rising inequality exacerbates economic grievances leading to
 more frequent public protests (e.g., De Juan and Wegner, 2019, Kurer et al., 2019). On the other
 hand, oil rents have been previously found to decrease the likelihood of political protests (Smith,
 2004; Vadlamannati and Soysa, 2020) by allowing the incumbent politicians to buy out the oppo-
 sition or finance a sizable security apparatus (Basedau and Lay, 2009). We employ a newly as-
 sembled dataset on regional protests in Russia introduced by Lankina and Tertytchnaya (2020)
 that differentiates between various categories of protests. 2 We find a significant positive effect of
 rising inequality instrumented with oil price shocks under rent-seeking on the “social” protests –
 “protests by, and specifically furthering the aims of, socially vulnerable groups of people”

 1
 This result is consistent with Gupta et al. (2002), who used cross-country data to show that higher corruption is
 associated with greater inequality and poverty.
 2
 The dataset is published as Lankina (2018).

 3
BOFIT – Institute for Emerging Economies BOFIT Discussion Papers 2/2022
Bank of Finland

 (Lankina and Tertytchnaya, 2020: 34), but not the protests associated with other issues such as
 anti-government, cultural, environmental, or against specific legal or economic policies. However,
 this effect is driven solely by the subsample of relatively democratic regions. In contrast, no effect
 can be found among the relatively authoritarian regions, presumably because in these latter re-
 gions, the authorities are relatively more capable of suppressing protest activity, protesting is more
 costly to the participants, or there are too few activists, to begin with (Tertytchnaya and Lankina,
 2020). To our knowledge, we are the first to show the positive relationship between the oil wind-
 falls mediated by different corruption regimes and protest frequency. 3
 Our research advances the existing empirical literature on the effect of natural resources
 on inequality (Gylfason and Zoega, 2003; Ross, 2007; Buccellato and Mickiewicz, 2009; Goderis
 and Malone, 2011; Carmignani, 2013; Howie and Atakhanova, 2014; Parcero and Papyrakis, 2016;
 Kim and Lin, 2018) in several dimensions. First, this is the first study to show that this effect
 depends on the degree to which the institutional environment allows for rent-capture, while the
 previous literature often assumed the relationship between natural resources and inequality to be
 linear and direct. Second, we conduct our empirical analysis in a within-country setting that pro-
 vides us with a better identification strategy and circumvents the usual drawbacks of cross-country
 studies. Third, contrary to the previous literature that has traditionally treated oil rents as a homo-
 geneous aggregate, we differentiate among different types of oil rents as they often accrue to dif-
 ferent actors and can serve different purposes. For example, the oil sector normally produces rents
 in the form of oil firms’ profits, dividends to shareholders, higher wages of employees and man-
 agement, export taxes, extraction taxes, and unofficial taxes (Gaddy and Ickes, 2005), and it is
 reasonable to assume that they might have disparate implications for income inequality. 4 The ma-
 jor novelty of this paper is thus the focus on the oil rent in the form of government tax revenue that
 is supposed to benefit the population as a whole, according to the official narrative. However, the

 3
 We acknowledge a recent paper by Ishak and Farzanegan (2021) that looks at the cross-country evidence and finds
 that negative oil price shocks (i.e., the decline in oil rents in oil exporters) increase the incidents of demonstrations,
 strikes, and riots but only in countries with a relatively small size of the shadow economy.
 4
 For example, bonuses to the top management would obviously work towards increasing the overall inequality; the
 same pro-inequality effect but potentially at a lesser rate would apply to rents to the shareholders of oil companies; on
 the contrary, most of the tax-related rents should be more equally distributed via the provision of public goods and
 services, and especially social transfers, leading presumably to lower income inequality. Our claim in this paper is
 that tax windfalls accruing to local budgets are particularly prone to increasing inequality in a highly corrupt environ-
 ment.

Michael Alexeev and Nikita Zakharov Who profits from windfalls in oil tax revenue?
 Inequality, protests, and the role of corruption

 existing literature suggests that revenue increases in local budgets do not necessarily guarantee an
 improvement of living conditions for the local population (Brollo et al., 2013), and, instead, might
 be misappropriated by officials in charge of managing the budgets (Nikolova and Marinov, 2017). 5
 Therefore, we argue that oil rents accruing directly to the local budgets are particularly likely to
 exacerbate inequality.
 Our findings also add to the ample literature on the effect of economic inequality on non-
 violent protests. Contrary to many studies that find inequality to depress protest activities (Dubrow
 et al. 2008; Solt, 2008, 2014), we show a positive effect of rising income inequality on the occur-
 rence of social protest. This is, however, consistent with Kurer et al. (2019), who finds that not the
 levels but the changes in economic grievances (e.g., deterioration of economic prospects) tend to
 galvanize protest activity.
 Finally, our paper contributes to the literature on corruption in Russia by introducing a
 novel dataset on the registered incidents of embezzlement acquired from the Ministry of Internal
 Affairs of the Russian Federation, which covers all of 83 Russian regions over 14 years. 6 These
 data offer an alternative proxy for the risk of rent capture for testing our hypothesis. In our estima-
 tion strategy, we rely only on the within-variation of the corruption and embezzlement measures
 using first-differencing and fixed effects specifications to account for region-specific time-invari-
 ant characteristics.
 The paper is structured as follows. Section 2 reviews the existing literature and identifies
 our main contributions. Section 3 describes the data. Estimation strategy and empirical results are
 presented and discussed in Section 4. Section 5 provides robustness checks. Section 6 concludes
 with a summary of the findings. The Appendix contains descriptive statistics, comparisons of gen-
 eral economic trends between two periods under study, and additional regressions.

 5
 The appropriation of the windfalls is not exclusive for the subnational budgets: for example, a recent paper by An-
 dersen et al. (2020) finds that the foreign aid provided to national governments is strongly associated with surging
 cash flows to the offshore financial centers.
 6
 Most previous literature on regional corruption in Russia relies on perception-based corruption measures (e.g., Din-
 inio and Orttung 2005; Detkova et al. 2021), which are often criticized for being biased (e.g., Jensen et al. 2010;
 Sharafutdinova 2010). Schulze and Zakharov (2018) provide a literature review on subnational corruption in Russia.

 5
BOFIT – Institute for Emerging Economies BOFIT Discussion Papers 2/2022
Bank of Finland

 2 Literature review on oil rents and income inequality
 Our paper contributes to the literature on the effect of natural resources on inequality by focusing
 on one particular type of oil rents within a single country. Previous research is represented mainly
 by cross-country comparisons that do not differentiate between the types of rents and produce
 mixed results (Sebri and Dachraoui, 2021). In the earliest investigation of the topic, Gylfason and
 Zoega (2003) find that natural resource dependence increases inequality. However, this result was
 obtained in a cross-section of countries using per capita GDP as a control variable. Alexeev and
 Conrad (2009a) argued that this approach is problematic. Nonetheless, even adjusting for the en-
 dogeneity of per capita GDP, the share of mining in GDP appears to lead to higher income ine-
 quality in a country, although this result does not hold for oil abundance (Alexeev and Conrad,
 2005). Two more recent papers produced contradictory results. The first paper by Carmignani
 (2013) examines a cross-section of 80 countries and finds that countries rich in subsoil resources
 are more unequal on average. Goderis and Malone (2011) employ a more sophisticated identifica-
 tion strategy by using a dynamic panel model with an exogenous variation in international com-
 modity prices and find that subsoil-mineral booms in developing countries lower inequality in the
 same year, but inequality returns to the pre-boom level in the long-run. The idea of a nonlinear
 relationship between natural resources and inequality is proposed by Fum and Hodler (2010), who
 find that natural resource abundance is mediated by ethnic polarization so that natural resources
 are associated with greater income inequality in more polarized countries. This finding is related
 to our hypothesis that the likelihood of rent-capture affects how oil windfalls are distributed since
 ethnic polarization has been linked to rent-seeking (e.g., Dincer, 2008). Hartwell et al. (2019) use
 the World Bank measure of natural resource rents and cross-country data to show that the impact
 of these rents on inequality is conditional on the level of democracy: natural resource rents in more
 (less) democratic countries result in lower (higher) inequality. 7 Most studies mentioned above em-
 ploy a very broad measure of natural resources that include minerals, hydrocarbon fuels, land

 7
 Although Hartwell et al.’s argument is reminiscent of ours, their econometric approach is very different. In addition
 to using only cross-sectional data, their regressions include the interaction term between a measure of democracy and
 natural resource rents, but not the democracy measure on its own. This makes it unclear whether democracy mediates
 the relationship between resource rents and inequality or is by itself the main cause of lower inequality.
Michael Alexeev and Nikita Zakharov Who profits from windfalls in oil tax revenue?
 Inequality, protests, and the role of corruption

 wealth, forests, and raw agricultural materials. This approach is problematic since rents generated
 by different resources tend to differ in their characteristics and may affect inequality differently. 8
 Two papers that focus exclusively on oil rents are relatively recent and support a mostly
 negative relationship. The first one by Parcero and Papyrakis (2016) finds a U-shaped relationship
 such that oil wealth decreases income inequality in modestly oil-rich nations but increases it in the
 relatively few cases of extreme oil abundance. Importantly, Parcero and Papyrakis (2016) also
 show that underreporting the inequality data is associated with oil-richness making cross-country
 findings less reliable. Kim and Lin (2018) deal with another inherent problem of cross-country
 settings in the form of cross-sectional dependence and common correlated effects. They estimate
 the effect of oil production and rents on income inequality using traditional econometric techniques
 and find it significant and positive. However, accounting for the common shocks and cross-sec-
 tional dependence, the results become significantly negative, i.e., oil abundance and oil depend-
 ence reduce income inequality. Interestingly, they also show that the negative effect is persistent
 both in ethnically polarized and homogenous nations, contradicting the nonlinear effect claimed
 by Fum and Hodler (2010).
 Most recently, Davis (2020) uses a large sample of countries and obtains results that are
 similar to Alexeev and Conrad (2005). Namely, mining production tends to be associated with
 higher income inequality, while oil output does not increase inequality and might even somewhat
 decrease it. While cross-country studies provide important insights, they often suffer from unob-
 served heterogeneity, omitted variable bias, and uneven data quality. Parcero and Papyrakis (2016)
 and Van der Ploeg (2011) argue that researchers should exploit the variations within single coun-
 tries for more reliable findings.
 To our knowledge, there are only two papers that attempt to test the relationship between
 oil rents and income inequality at the subnational level. Howie and Atakhanova (2014) estimate
 the uniform effect of global oil prices on the quarterly measures of inequality in all of 16 provinces
 of Kazakhstan and find a strong negative relationship. Note, however, that their estimation strategy
 does not account for regional differences in oil endowments across Kazakh provinces, meaning
 that their measure of the oil price shock is identical across the country. This implies that the authors

 8
 In particular, Boschini et al. (2007) argue that resources may differ in the degree to which rents associated with them
 can be captured.

 7
BOFIT – Institute for Emerging Economies BOFIT Discussion Papers 2/2022
Bank of Finland

 are unable to disentangle the impact of changes in oil prices from other common time-varying
 shocks such as exchange rate fluctuations, interest rates, and inflation. Moreover, the regressions
 suffer from a potentially significant spatial correlation of errors. In effect, given the commonality
 of oil prices for all provinces, Howie and Atakhanova’s (2014) estimates of the impact of oil price
 changes on inequality in Kazakhstan are based on the number of observations corresponding to
 the number of quarters (i.e., at most 36), although the standard errors in their regressions are ap-
 parently calculated using the total number (more than 400) data points. As a result, the confidence
 levels of oil price coefficient estimates are almost certainly greatly overestimated.
 The paper by Buccellato and Mickiewicz (2009) is closer to our work as it looks at subna-
 tional inequality and oil in Russia. The authors find a positive relationship using oil production in
 tons per capita as a proxy for oil rents. Their measure is likely to be endogenous to the production
 decisions and can correlate with omitted variables. In addition, the production volume does not
 necessarily correspond to the size of rents, which depend on both physical output and prices. We
 argue that a better strategy for establishing causality is using exogenous variation in global oil
 prices weighted by the average share of oil output in the gross regional product (GRP) over a
 period of time (e.g., Goderis and Malone, 2011, Bruckner et al., 2012) as we do in our paper. In
 fact, using the time frame of Buccellato and Mickiewicz (2009), we show that the plausibly exog-
 enous oil price shocks do not by themselves increase subnational inequality.
 Our paper also contributes to a broader empirical literature on the consequences of oil
 abundance or oil dependence. Recent resource curse literature often takes a nuanced view arguing
 that whether natural resources are a curse or a blessing depends largely on the quality of institu-
 tions. For example, oil wealth tends to stifle media freedom in authoritarian countries (Egorov et
 al., 2009) and hinder financial development in countries with poor institutions (Bhattacharyya and
 Hodler, 2014). In a survey of the resource curse literature, Badeeb et al. (2017) note that “in some
 countries, the windfall of resource revenues increases the power of elites, who have the capacity
 to widen income inequalities,” although they do not provide references to studies demonstrating
 this effect. We show that an increase in oil rents accruing to the government budget tends to exac-
 erbate inequality in a corrupt environment.
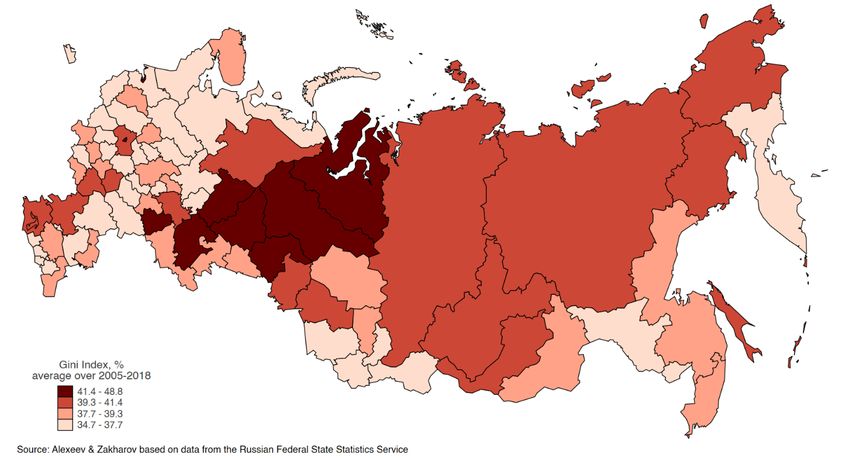
Michael Alexeev and Nikita Zakharov Who profits from windfalls in oil tax revenue?
 Inequality, protests, and the role of corruption

 3 Data
 3.1 Oil windfalls
 Russia, one of the largest global oil producers, exports over two billion barrels of oil annually,9
 thus, even a small increment in international oil prices leads to an ample windfall in oil rents. Most
 of this windfall accrues to the budget system. Zakharova and Goldsworthy (2010) estimate that an
 additional dollar in oil exports results in up to 90 cents in tax revenue. 10 Alexeev and Conrad
 (2009b) provide a similar observation about the Russian fiscal policy, calculating that over 90
 percent of the net present value of oil deposits is appropriated by the government, provided that
 oil is exported. The prevalence of oil tax revenues relative to the other rents associated with oil
 and their high volatility due to the exogenous changes in international oil prices are the two factors
 that make Russia an ideal setting for studying the effects of this type of oil rent.
 Our identification strategy takes advantage of the geographical and intertemporal variation
 in oil tax rents in Russia. While almost a third of Russian regions produce oil, the quantities vary
 significantly, as Figure 1 illustrates by plotting the average subnational production of oil between
 2005 and 2018, measured in tons per capita. Between 2005 and 2009, the decentralized tax revenue
 system assigned five percent of the oil extraction tax to the budgets of the regions where oil was
 extracted. This system was discontinued in 2010, with only a partial compensation of the foregone
 regional revenues by 60, 40, and 20 percent in 2010, 2011, and 2012 respectively. This policy
 change allows for comparing two distinct time intervals: with oil tax revenue sharing (2005-2012)
 and without (2013-2018) and constitutes an important part of our identification strategy. If changes
 in oil rents accruing to regional governments affect income inequality in the regions, we may find a
 relationship between oil rents and inequality during 2005-2012, but we expect to find no similar
 effect after the oil tax revenue sharing ended in 2012. This approach is valid because the two periods
 were otherwise comparable in terms of several economic parameters: both periods contain only one
 occurrence of economic downturns, resulting in similar increases in unemployment and inflation,
 as we show in Figures A1 and A2 in Appendix A. Note that the second period is slightly more
 economically stable. Also, although the second period includes foreign economic sanctions and

 9
 BP Statistical Review of World Energy July 2021 (http://www.bp.com/statisticalreview).
 10
 This is conditional on oil prices being above 25 dollars per barrel.

 9
BOFIT – Institute for Emerging Economies BOFIT Discussion Papers 2/2022
Bank of Finland

 Russian countersanctions that followed the annexation of Crimea and the Ukrainian conflict, the
 established literature typically finds their economic and political impact to be insubstantial (e.g.,
 Ashford, 2016; Dreger et al., 2016).

 Figure 1: Geographic distribution of oil extraction in Russia in 2005-2018

 Another crucial characteristic of the Russian oil extraction tax is its formula that calculates the oil
 tax revenue proportionally to the international oil price (Alexeev and Conrad, 2009b). This enables
 us to use international oil price shocks as an exogenous component of the subnational oil windfalls.
 We follow the standard approach to compute the oil price shocks (e.g., Brückner et al.,
 2012; Collier and Goderis, 2012; Brückner and Gradstein, 2015). The regional oil price shock
 (OPS) is calculated as an annual log-difference of the international oil price converted to constant
 Russian rubles multiplied by the average ratio of oil output to GRP over the time span covered by
 our regressions: 11

 11
 Using the average ratio of oil output to regional GDP over a period of time as a weight to calculate the size of the
 oil price shock addresses the potential endogeneity between the dependent variable in the regressions and oil produc-
 tion decisions in any given year. However, one may argue that such weight does not adequately reflect the current oil
 price shock, which is determined by both price and quantity changes.Our results remain qualitatively the same when
 we measure the oil price shock using the product of the log-change in oil price and the ratio of the current value of oil
 output to GRP. The results of regression using this measure of the oil price shock are available upon request.
Michael Alexeev and Nikita Zakharov Who profits from windfalls in oil tax revenue?
 Inequality, protests, and the role of corruption

 1 × 100

 = ∆ ln × � , (1)
 =1
 where and index regions and years, respectively; ∆ln indicates the log-change between years
 and − 1; OilPrice is the price of a barrel of Brent Crude oil (UNCTAD database) converted to
 rubles using the average Dollar-Ruble exchange rate in the given year; OilProduced is the value
 of oil extracted in region in year t evaluated using OilPrice; GRP is the gross regional product
 expressed in constant rubles in region in year t. 12 Because the foregone oil tax revenues were
 only partially compensated during three years after the tax-sharing was discontinued in 2010, we
 adjusted the OPS in these years by the factors 0.6, 0.4, and 0.2 for 2010, 2011, and 2012, respec-
 tively. Appendix A, Figure A3 illustrates the dynamics of international oil prices and the amplitude
 of oil price shocks by years over the studied period, demonstrating that the pattern of oil price
 shocks was substantially similar in 2005-2012 and 2013-2018.
 Our data cover all the Russian regions, excluding the cities of Moscow and Saint
 Petersburg as potential outliers since they profit from hosting the headquarters of the major oil
 companies and the Chechnya Republic due to local military conflict and data availability. 13 Over-
 all, 34 of the 79 regions in our sample have produced at least some amount of oil during the period
 2005-2018.

 3.2 Rent capture
 Our central hypothesis implies that the rents accruing to the government are particularly vulnerable
 to capture by the politically connected elites. We proxy the risk of capture by the dynamics of
 corruption in the region: the more common is the misuse of public office for private gain, the more
 likely is the misappropriation of the oil windfalls.

 12
 The first differencing of oil prices is necessary to satisfy the stationarity condition (e.g., Brückner et al., 2012). The
 GRP data are from Russia’s Federal State Statistical Service (FSSS).
 13
 The Nenets Autonomous Okrug is aggregated with the Arkhangelsk Oblast because of its minuscule population
 size. The Khanty-Mansi Autonomous Okrug and Yamalo-Nenets Autonomous Okrug are included in the dataset sep-
 arately. We do not consider annexed Ukrainian regions – Sevastopol and the Crimea Republic as a part of Russia.

 11
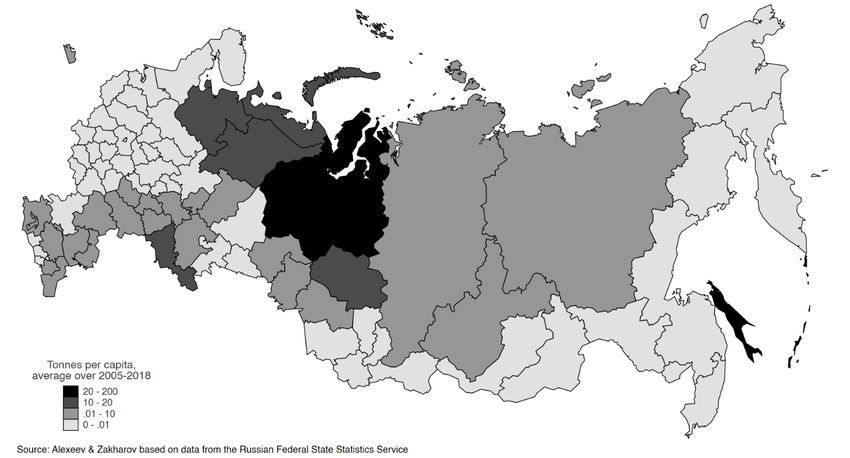
BOFIT – Institute for Emerging Economies BOFIT Discussion Papers 2/2022
Bank of Finland

 For our primary measure of corruption, we employ a recent dataset on the regional bribe-
 taking incidents registered by police authorities that was introduced by Schulze et al. (2016). Brib-
 ery is the most common type of corruption (Ryvkin and Serra 2012). Article 290 of the Russian
 Criminal Code, under which the bribe-taking is penalized, defines this crime as “acceptance of
 money, securities, or other valuables by a public official (personally or through an intermediary)
 for his or her performance (action or inaction) for the benefit of a giver or an affiliated person if
 such action implies that the public official exploits his or her position or authority or installs
 patronage”. We use the registration of bribe-taking cases and not the convictions for three main
 reasons identified in Schulze et al. (2016). First, crime registration is the initial stage of criminal
 procedure that occurs within three days after the crime is reported or exposed, while a conviction
 takes significantly longer; therefore, registrations relate to the timing of the crime much more
 precisely. Second, if the juridical process is plagued with corruption, that would bias the conviction
 data, but not the data based on the registration by the police. Finally, corruption can still affect the
 registration process but only marginally since registration does not impose severe consequences
 on the suspects and can be further obstructed at any time during the process. Meanwhile, non-
 registration of a crime can be penalized by law if the victim reports to the higher law-enforcement
 authorities (Schulze et al., 2016).
 We assume that the variation across time represents the actual dynamics of local corruption
 even if the registration of bribe-taking is affected by the region-specific characteristics (e.g., the
 quality of the police, law-enforcement resources, and priorities). Indeed, when we compare the
 overall time-trend in the registered cases of bribe-taking (a logarithm of the overall number of
 cases per 100 000 population) with a reversed control of corruption indicator from the World Bank,
 we observe a very similar pattern as shown in Figure 2. Therefore, we use first-differencing to
 construct our corruption variable (∆Bribes) as a log-difference of bribe-taking cases registered per
 100 000 population.
Michael Alexeev and Nikita Zakharov Who profits from windfalls in oil tax revenue?
 Inequality, protests, and the role of corruption

 Figure 2: Dynamics of corruption in Russia

 While the bribery data is probably the best available time-variant proxy for corruption in the Russian
 regions, no measure is perfect. Following the standard practice in corruption research, we introduce
 an alternative corruption measure to check the robustness of our results.
 Our alternative measure is the annual number of embezzlement incidents registered by the
 law enforcement authorities obtained from the Ministry of Internal Affairs of the Russian
 Federation. It is similar to the bribery proxy but covers a different crime (Article 160 of the Russian
 Criminal Code), which also indicates the risk of misappropriation. The embezzlement cases are
 positively correlated with incidents of bribe-taking in Russian regions, but unlike bribe-taking,
 embezzlement crime is not committed exclusively by public officials and, therefore, it is not a
 corruption measure per se. The data on embezzlement also covers a shorter period of time: 2006-
 2018. The variable (∆Embezzlement) is constructed as a log-difference of registered embezzle-
 ment cases per 100 000 population.

 13
BOFIT – Institute for Emerging Economies BOFIT Discussion Papers 2/2022
Bank of Finland

 3.3 Income inequality
 Russia is one of the most unequal countries in the world (Novokmet et al., 2018), but inequality
 varies significantly across its subnational regions. Figure 3 maps the regional data on income
 inequality averaged over 2005-2018. Income inequality is measured by the Gini index in
 percentage published by Federal State Statistical Service (FSSS). One can observe that the oil-rich
 regions are also more unequal on average.

 Figure 3: Income inequality in Russian regions, 2005-2018

 Our regression analysis employs two sets of inequality measures provided by the FSSS: the Gini
 coefficient (%) and the share of income by quintile population groups. The methodology for calcu-
 lating all of the inequality measures did not change during our period of investigation.
 Additionally, we employ the data on the composition of income by sources: salary, entre-
 preneurship, social transfers, property income, and other income. These data are also available from
 the FSSS. The average composition of income in the regions over 2005-2018 is presented in Figure
 4. The main income source for the Russian population is the official salary, with the second and
 third places shared by income from social transfers and other income, while income from self-em-
 ployment and entrepreneurship and income from property come fourth and fifth, respectively. We
 are mostly interested in the category of other income calculated as a difference between overall
Michael Alexeev and Nikita Zakharov Who profits from windfalls in oil tax revenue?
 Inequality, protests, and the role of corruption

 income on the one hand and expenditures and savings on the other. This category includes income
 from sales of foreign currencies, incoming money transfers, and hidden income (e.g., legal but un-
 declared income or illegal income). Gorodnichenko and Sabirianova Peter (2007) link this income
 category to illegal income from corruption. Our hypothesis predicts that oil windfalls captured in a
 corrupt environment enrich the elites mostly through other income.

 Figure 4: Composition of household income by sources, 2005-2018

 3.4 Protests
 The data on regional incidents of protests come from Lankina and Tertytchnaya (2020) and cover
 all Russian regions for 2007-2016. Lankina and Tertytchnaya (2020) assemble the dataset using
 the information from a crowd-sourced online platform (namarsh.ru) that aggregates reports on the
 various public forms of citizen protest collected by journalists, activists, and ordinary citizens. All
 entries were verified by human coders to include only events of public gathering (one or more
 participants), at the same time excluding petitions, entries that describe only intentions to protest,
 and political activities organized by the state authorities and pro-governmetal organizations (e.g.,
 by pro-governmental youth movements or the ruling party, United Russia). The protest events are
 defined as “public expression of dissent or critique” and are recorded in the dataset at the level of
 an event-day-location. Therefore, for our analysis, we aggregate protests by region-year, divide by

 15
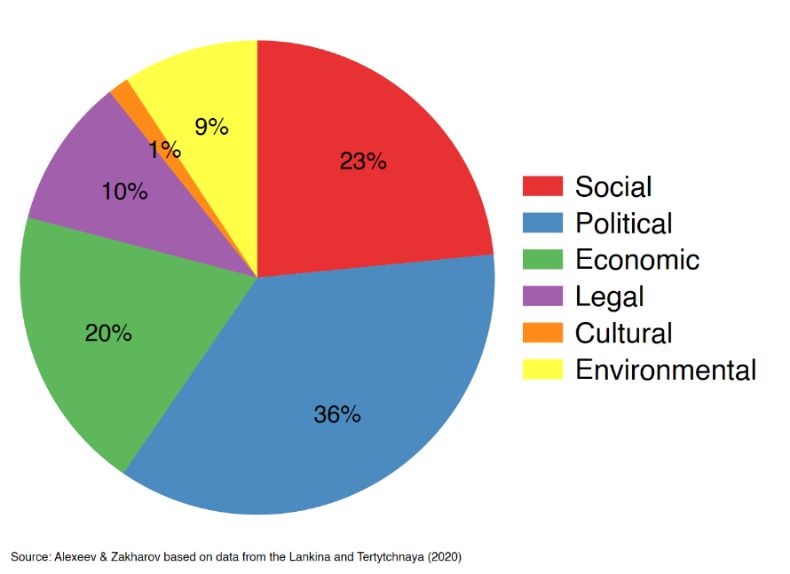
BOFIT – Institute for Emerging Economies BOFIT Discussion Papers 2/2022
Bank of Finland

 millions of regional population and take the logarithm of this number plus one. The dataset con-
 tains almost six thousand incidents of protests, with 3549 (61%) of them held outside of Moscow
 or St. Petersburg (i.e., in the regions under our investigation).
 The main advantage of the dataset for our purposes is the classification of the protests by
 agenda, as it allows us to look specifically at the inequality-related protests. Lankina and Terty-
 tchnaya (2020) identify six categories of protests: 1) political protests include anti-government and
 anti-regime protests with broad agendas; 2) economic protests are against economic policies, such
 as worker-rights regulations or wage arrears; 3) legal protests are against unpopular legislation and
 illegal acts by state and private entities; 4) cultural protests mainly oppose the deconstruction of
 monuments and historically valuable sites; 5) environmental protests are about environmental is-
 sues; 6) social protests aim to further the interests of particularly vulnerable social groups, includ-
 ing the poor. 14 We are most interested in the latter category as the most relevant for the rising
 inequality: the economically disadvantaged groups of the society should be especially intolerant
 to the rising inequality from appropriating oil rents that could be instead allocated to redistribution.
 Interestingly, this is the second-largest category after political protests, and it accounts for nearly
 one in four protests. Figure 5 illustrates the compositions of protest activities in the Russian regions
 by category.

 Figure 5: Composition of protest incidents by category, 2007-2016

 14
 The same protest event can be simultaneously assigned to several categories.
Michael Alexeev and Nikita Zakharov Who profits from windfalls in oil tax revenue?
 Inequality, protests, and the role of corruption

 Another worthy observation from the dataset is that the frequency of social protests is almost twice
 as high for oil-producing regions, where, as we observed earlier, both income inequality and average
 incomes are substantially higher than in non-oil-producing Figure 6 demonstrates the annual dy-
 namics of social protests in regions with and without oil production. The illustration suggests that
 social protests were much more common when oil tax revenues were shared with regional budgets
 (2007-2012), and their frequency converged to the level of regions without oil production after 2011.
 This pattern indicates a potential link between protests and oil tax rents.

 Figure 6: Dynamics of social protest in regions with and without oil production

 While we expect an increase in the frequency of social protests due to rising inequality, we note that
 protests activities in non-democratic countries like Russia are generally costly to participants. How-
 ever, due to the high heterogeneity in the regional degree of non-democracy in Russian regions,
 these costs vary depending on the local political regime. 15 Tertytchnaya and Lankina (2020), who
 studied the frequency of subnational protests in Russia incited by the exposure of electoral fraud at

 15
 The heterogeneity in subnational political regimes, particularly during the period under study, is a well-established
 feature of the Russian political system that has been studied widely in political science: Obydenkova and Libman
 (2012) provide a short summary.

 17
BOFIT – Institute for Emerging Economies BOFIT Discussion Papers 2/2022
Bank of Finland

 national parliamentary elections in 2011, address this issue by employing a commonly used index
 of Russian subnational democracy developed by Petrov and Titkov (2013) on behalf of the Moscow
 Carnegie Center. 16 They show that protests due to electoral fraud occurred more often in relatively
 more democratic regions. We follow their approach and employ the democracy index from Petrov
 and Titkov (2013) to test for a heterogeneous effect of income inequality on protests. The index is
 based on expert opinions about ten dimensions of democracy in each region in the previous five
 years (election quality, regional political system, pluralism, quality of local elites, openness, eco-
 nomic liberalization, media independence, control of corruption, civil society, and local self-gov-
 ernance). Each dimension is graded on a scale of 1 to 5, where 5 is the most pro-democratic evalu-
 ation. 17 Hence, the overall index ranges from 10 to 50, with the higher value indicating a relatively
 more democratic region. We employ the regional democracy index for 2006 – the first year of the
 protest dataset – to avoid any potential interaction between oil rents and democracy, and then we
 split all regions in our sample into halves using the median value of democracy. 18 Unsurprisingly,
 we observe that, on average, protests are 80% more frequent in relatively democratic regions; social
 protests are almost 90% more frequent. We expect the effect of inequality on protests to be more
 pronounced in regions where public protests are a more common activity.
 In addition to the data described above, we use some regional-level variables in the robust-
 ness checks. All of those variables are obtained from the FSSS. The descriptive statistics for the
 data used in our regressions are shown in Table A1 in Appendix A.

 16
 The Moscow Carnegie Center is a reputable think tank affiliated with the Carnegie Endowment for International
 Peace operating in Russia since 1994.
 17
 The index has been widely used in economics (e.g., Libman, 2012; Berkowitz et al., 2014; Belmonte and Rochlitz,
 2019) and comparative political science (e.g., Freinkman and Plekhanov, 2009; Beazer, 2012; Buckley and Reuter,
 2019).
 18
 The number of oil-producing regions is equal in both subgroups. The median value of the democracy index is 29.
Michael Alexeev and Nikita Zakharov Who profits from windfalls in oil tax revenue?
 Inequality, protests, and the role of corruption

 4 Estimation strategy and the results
 4.1 The effect on income inequality
 Our estimation strategy follows a standard approach in the literature (e.g., Brückner et al. 2012,
 Collier and Goderis 2012, Brückner and Gradstein 2015). We first estimate the linear effect of oil
 price shocks in a dynamic panel model using the system GMM as in the following equation:
 ∆ = 0 × ∆ −1 + 1 × + + + , (2)
 where is the value of the dependent variable in region and year , is the oil price shock,
 and, and denote region and time fixed effects, respectively; ∆ denotes the change of the
 variables between years and − 1. Note that the oil price shock is necessarily the first-differ-
 enced variable, and, therefore, it is appropriate to first-difference the other variables. The system
 GMM specification allows for the dynamic nature of the panel and can also account for potential
 endogeneities in the data.
 To test the nonlinear effect of oil price shock under different corruption levels, we modify
 equation (2) to include the corruption variable and the interaction term:
 ∆ = 0 × ∆ −1 + 1 × + 2 × ∆ + 3 × × ∆ + +
 + , (3)
 where is our measure of corruption. While our baseline estimation is a system GMM, we
 also provide OLS FE estimates as a robustness check later in our analysis, as in Brückner et al.
 (2012).
 We estimate both specifications for the period when oil extraction taxes were shared with
 local budgets (2005-2012), where we expect rent-seeking to mediate the effect of oil windfalls on
 inequality, and the period after the tax-sharing regime was discontinued (2013-2018), where the
 windfall effect should disappear.
 Table 1 presents the results for inequality as measured by the Gini coefficient. Columns 1
 and 2 show that oil price shocks have no impact on inequality under the oil tax sharing regime
 (2005-2012) whether we control for corruption environment or not. However, the interaction term
 in column 3 is positive and highly significant, confirming our hypothesis that the rent capture

 19
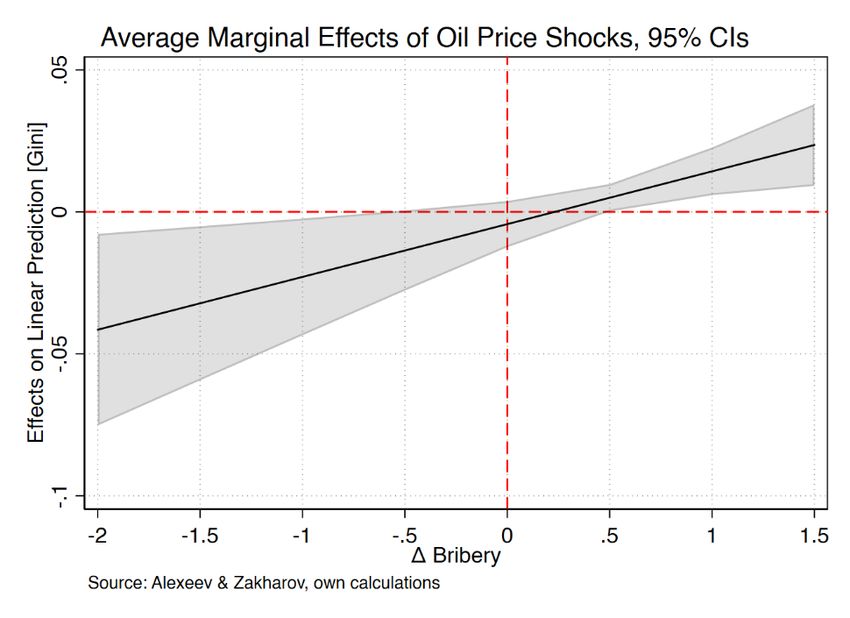
BOFIT – Institute for Emerging Economies BOFIT Discussion Papers 2/2022
Bank of Finland

 mediates the inequality-raising effect of windfalls on the regional budgets. 19 The effect is robust
 to using our alternative measure of corruption – registered incidents of embezzlement (column 4)
 and OLS FE estimation instead of GMM (column 5). The magnitudes of the effect are very similar
 across all specifications. To illustrate them, we use the OLS FE estimation to compute the average
 marginal effect of oil price shocks conditional on the log-change in bribery incidents and present
 them in Figure 7. The marginal effects are positive and significant at a 5% level, starting slightly
 under 0.5 log change in corruption. 20

 Figure 7: Marginal effects of oil price shocks on the Gini coefficient (2005-2012)

 What happens when the oil tax revenue is no longer shared with regional budgets? We run the same
 regressions for the period of 2013-2018 and report the results in columns 6-8. While the linear term
 of oil price shocks is again not significant in estimation with and without the inclusion of the cor-

 19
 We also note that system GMM regressions satisfy the standard AR(2) and overidentification tests, and the number
 of instruments is comfortably below the number of groups (regions), implying the absence of instrument proliferation
 problem.
 20
 Marginal effects and their standard errors are calculated using Stata’s margins command. We estimate marginal
 effects only for OLS FE regressions because calculating marginal effects and their standard errors for system GMM
 specification is problematic due to the presence of the lagged dependent variable among the regressors.
Michael Alexeev and Nikita Zakharov Who profits from windfalls in oil tax revenue?
 Inequality, protests, and the role of corruption

 ruption variable (columns 6-7), the interaction term between oil price shocks and corruption be-
 comes indistinguishable from zero (column 8). 21 This result supports our hypothesis that the non-
 linear effect is driven by the incremental oil tax revenue accrued to the local budgets.

 21
 These results are also robust to the inclusion of the alternative measure of corruption and OLS FE as an alternative
 estimation technique, and they are available upon request.

 21
BOFIT – Institute for Emerging Economies BOFIT Discussion Papers 2/2022
Bank of Finland

 Table 1: Oil price shocks, corruption, and income inequality (2002-2018)
 (dependent variable: ∆ Gini coefficient)
 Time period: 2005-2012 2013-2018 2002-2004
 Estimation method System GMM OLS FE System GMM
 (1) (2) (3) (4) (5) (6) (7) (8) (9)
 Oil price shock -0.0002 -0.0008 -0.0089** -0.0011 -0.0043 0.0009 -0.0014 0.0001 0.0027
 (0.965) (0.823) (0.012) (0.786) (0.301) (0.871) (0.801) (0.984) (0.866)
 ∆Bribes 0.0022 0.0044 0.0149 0.3081 0.0038
 (0.972) (0.944) (0.853) (0.189) (0.963)
 OPS× ∆Bribes 0.0288*** 0.0186*** -0.0050
 (0.000) (0.008) (0.694)
 ∆Embezzlement -0.0704
 (0.270)
 OPS× 0.0370***
 ∆Embezzlement (0.006)
 Lagged dep. 0.0238 -0.0466 -0.0379 -0.0631 -0.6248*** -0.6480*** -0.5380*** 0.1219
 variable (0.656) (0.365) (0.466) (0.288) (0.000) (0.000) (0.000) (0.457)
 Observations 632 632 632 474 632 474 474 474 237
 Panels 79 79 79 79 79 79 79 79 79
 AR(2) p-value 0.79 0.87 0.71 0.71 0.11 0.27 0.45 .
 Hansen test (p-value) 0.184 0.160 0.318 0.566 0.334 0.145 0.204 0.316
 Instruments 26 38 52 38 20 32 44 8
 R squared 0.33
 Notes: p-values in parentheses, * p < 0.1, ** p < 0.05, *** p < 0.01. Robust standard errors are clustered at the region level. All
 estimations include regional and year fixed effects. The regression for 2013-2018 in Column 6 includes a second lag of the dependent
 variable in order to make it pass the AR(2) test. The statistical significance of the coefficients is not affected by the addition of this
 variable.

 22
Michael Alexeev and Nikita Zakharov Who profits from windfalls in oil tax revenue?
 Inequality, protests, and the role of corruption

 Statistical significance of the regression coefficients is important, but it does not directly convey the
 economic importance of the effect of oil price shocks on income distribution. This effect depends
 on the degree of corruption as well as on the role of oil in the regional economy. On average, in oil-
 producing regions, one standard deviation of the positive oil price shock combined with the largest
 observed increase in corruption would result in about a quarter of the standard deviation increase in
 the annual change of the Gini coefficient. In a region with a smaller change in corruption, the impact
 of the oil price shock on inequality would be somewhat weaker.
 Note that the standard deviation of the oil price shock differs across oil-producing regions
 because it is proportional to the ratio of the mean value of oil output and regional GDP over 2005-
 2012. Therefore, given the same change in corruption, the effect of oil price changes on inequality
 would be greater in regions with a larger share of oil output in the economy. For example, the
 standard deviation of the oil price shock for the top five oil producers in our sample is twice that
 of the standard deviation of the price shock for all oil producers. Therefore, given our point esti-
 mates, the impact of oil price shocks and corruption on income inequality would also be twice as
 large in the top oil producers. It is also important to mention here that the “within” R-squared in
 all but one of our inequality regressions is about 0.3, which is perhaps surprisingly large given the
 small number of explanatory variables.
 Finally, we look at the period under investigation by Buccellato and Mickiewicz (2009). In
 their estimation strategy, the authors rely exclusively on the physical measure of oil extraction that
 was likely to be endogenous to the production decisions and find a positive effect of oil on inequal-
 ity. We replicate their regressions in column (9) using the exogenous variation in the oil windfalls
 due to the changes in international prices and find no significant effect. We are unable to investigate
 the nonlinear effect in this earlier period due to the lack of data on corruption.
 Our main regressions do not include any control variables besides time and region fixed
 effects. In the robustness checks section, we add (first differences of) the unemployment rate, the
 share of the working-age population, the degree of urbanization, a measure of educational attain-
 ment of the population, and the logarithm of regional per capita GDP – variables that change over
 time and have been identified as potentially important in the literature on the factors influencing

 23
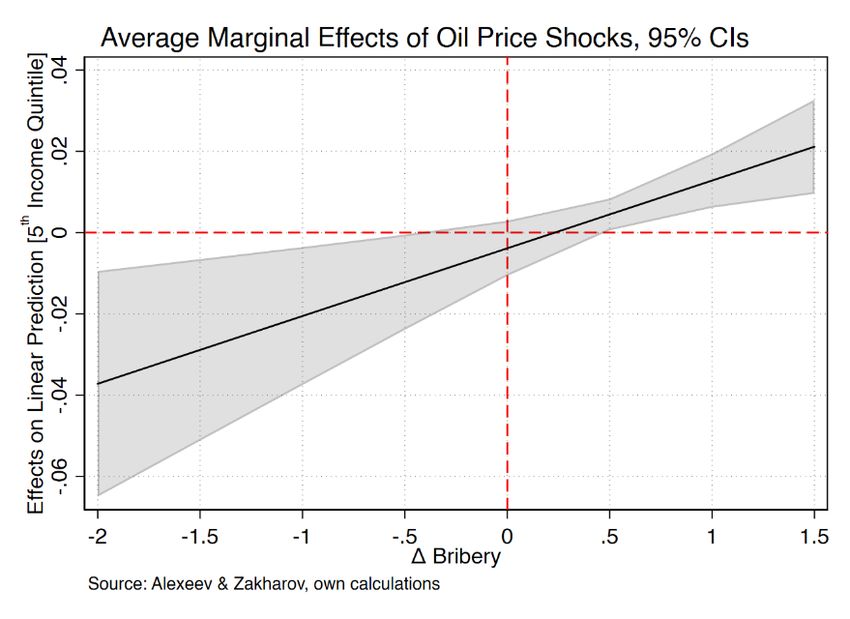
BOFIT – Institute for Emerging Economies BOFIT Discussion Papers 2/2022
Bank of Finland

 income distribution. 22 In the same section, we also perform placebo tests by using overall crime
 and murder rates instead of measures of corruption as indicators of governance quality. We note
 that because we use the data on regions within the same country as well as time fixed effects, we
 do not include factors that are likely to affect all regions similarly, such as those related to mone-
 tary policy or international trade. As we will demonstrate later, both the robustness checks and
 placebo tests confirm our original results.
 While our main finding is the mediating effect of corruption on the relationship between
 oil rents accruing to the government and income inequality, we are also interested in who gains the
 most from the captured rents. For this purpose, we employ the data on income distribution by quin-
 tiles, using the changes in their shares as the dependent variables.
 As the results in Table 2 demonstrate (columns 1-5), positive oil price shocks combined
 with increased corruption are associated with declining shares of the first four income quintiles and
 a rising share of the fifth quintile. As before, this effect is present only during the period when oil
 tax revenues were shared with the regions, and it disappears in the post-2012 period (column 8). We
 present the graph of marginal effects of bribery on the share of the fifth income quintile calculated
 based on OLS FE regression (column 7) in Figure 8. Note that these marginal effects become posi-
 tive and significant at the 5% level, almost exactly at the same value of bribery as in the Gini coef-
 ficient regression. As in the case of income inequality, the results for income quintiles based on the
 bribery measure are confirmed by the regression using the embezzlement variable (column 6). Fi-
 nally, the interaction of oil price shock and corruption in a period without oil tax sharing (column
 8) is no longer significant. 23

 22
 See Kuznets (1955), Barro (2000), and more recently Hacibedel et al. (2019) for the effects of GDP. Nielsen and
 Alderson (1995, 1997), Higgins and Williamson (2002), and Bergh and Fink (2008) are examples of the studies that
 addressed the impact of urbanization, age structure, and education, respectively. Unemployment is one of the “robust”
 drivers of inequality identified by Furceri and Ostry (2019).
 23
 While the direct term is statistically significant at the 10% level, its significance disappears in the linear estimation
 as in equation (2). Results are available upon request.

 24
Michael Alexeev and Nikita Zakharov Who profits from windfalls in oil tax revenue?
 Inequality, protests, and the role of corruption

 Table 2: Oil price shocks and income quintiles (2005-2018)
 Time period: 2005-2012 2013-2018
 Estimation method: System GMM OLS FE System
 GMM
 Dependent ∆Share of ∆Share of ∆Share of ∆Share of ∆Share of ∆Share of ∆Share of ∆Share of
 variable: 1st income 2d income 3d income 4th income 5th income 5th income 5th income 5th income
 Independent quintile quintile quintile quintile quintile quintile quintile quintile
 variables:
 (1) (2) (3) (4) (5) (6) (7) (8)
 Oil price shock 0.0022** 0.0023*** 0.0021** 0.0007 -0.0076*** -0.0008 -0.0039 0.0068*
 (0.037) (0.009) (0.022) (0.266) (0.009) (0.809) (0.269) (0.093)
 ∆Bribes 0.0048 0.0043 0.0007 -0.0028 -0.0045 0.0050 -0.0240
 (0.782) (0.785) (0.964) (0.629) (0.927) (0.934) (0.679)
 OPS× ∆Bribes -0.0051*** -0.0080*** -0.0068*** -0.0046*** 0.0247*** 0.0167*** 0.0077
 (0.001) (0.000) (0.000) (0.000) (0.000) (0.004) (0.315)
 ∆Embezzlement -0.0756
 (0.136)
 OPS× 0.0293***
 ∆Embezzlement (0.009)
 Lagged dep. -0.0438 -0.0357 -0.0717 -0.2641*** -0.0410 -0.0617 -0.0763
 variable (0.396) (0.425) (0.138) (0.000) (0.408) (0.313) (0.588)
 Observations 632 632 632 632 632 474 632 474
 Panels 79 79 79 79 79 79 79 79
 AR(2) p-value 0.43 0.37 0.77 0.35 0.76 0.61 0.84
 Hansen test (p-value) 0.430 0.395 0.484 0.492 0.437 0.526 0.319
 Instruments 52 52 52 52 52 38 44
 R squared 0.33
 Notes: p-values in parentheses, * p < 0.1, ** p < 0.05, *** p < 0.01. Robust standard errors are clustered at the region level. All estimations include regional and
 year fixed effects. The regression for 2013-2018 in Column 8 includes a second lag of the dependent variable in order to make it pass the AR(2) test. The statistical
 significance of the coefficients is not affected by the addition of this variable.

 25
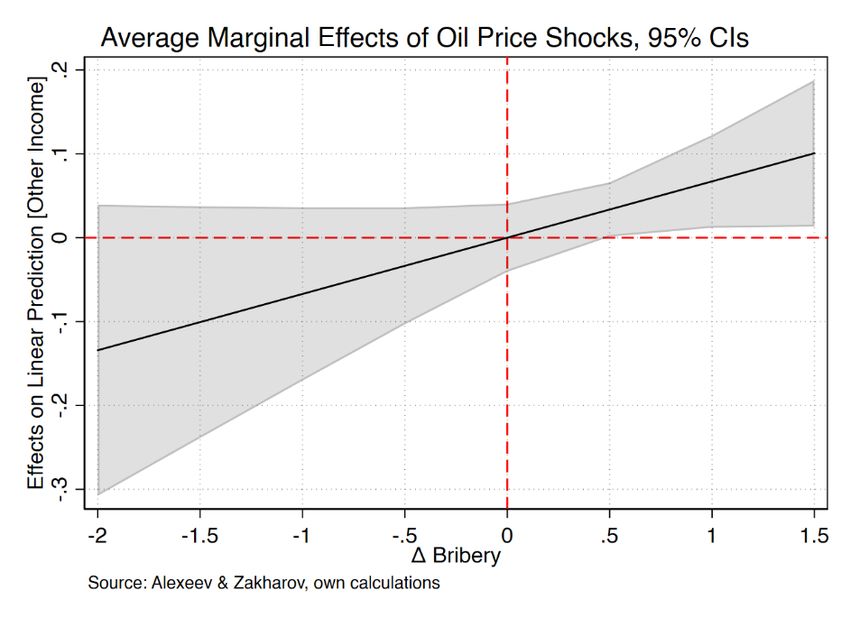
BOFIT – Institute for Emerging Economies BOFIT Discussion Papers 2/2022
Bank of Finland

 Figure 8: Marginal effects of oil price shocks on the share of the 5th income quintile (2005-2012)

 4.2. The effect on income composition
 Having demonstrated the complementary impact of the changes in oil rents accruing to the regional
 budgets and corruption on income inequality, we conjecture that this impact might also be reflected
 in the changing shares of different types of income. Specifically, we expect that oil windfalls in
 the environment of rising corruption will be associated with an increasing share of “other income”,
 which includes incomes derived from informal or illegal activities (Gorodnichenko and Sabiria-
 nova Peter 2007). To test this hypothesis, we estimate regression (3) using changes in the shares
 of different income sources as dependent variables. We find that the interaction between oil price
 shocks and changes in bribery is positively and statistically significantly associated with the
 change in the share of other income (see Table 3). The significance level is 1% in the system GMM
 specification (column 5) and 10% in the OLS FE regression (column 7). The interaction term be-
 tween the oil price shock and embezzlement is also positive and statistically significant (column
 6). As before, the effect cannot be detected after oil tax sharing was discontinued (column 8). In
 addition, the interaction term coefficient has a negative and significant sign in both the OLS FE
 and system GMM wage income regressions (column 1). The shares of income from entrepreneur-
 ship, social transfers, and property are not significantly affected by the oil rents fluctuations (col-
 umns 2).

 26
You can also read