Decoupling the Oil and Gas Prices - NNoottee ddee ll''IIffrrii
←
→
Page content transcription
If your browser does not render page correctly, please read the page content below

Note de l’Ifri

     Decoupling the Oil and Gas Prices
                    Natural Gas Pricing
            in the Post-Financial Crisis Market
       ______________________________________________________________________

                                                          Miharu Kanai

                                                                 May 2011

.

                                                 Gouvernance européenne
                                                 et géopolitique de l’énergie
The Institut français des relations internationales (Ifri) is a research center and
  a forum for debate on major international political and economic issues.

  Headed by Thierry de Montbrial since its founding in 1979, Ifri is a non-
  governmental and a non-profit organization.

  As an independent think tank, Ifri sets its own research agenda, publishing its
  findings regularly for a global audience.

  Using an interdisciplinary approach, Ifri brings together political and economic
  decision-makers, researchers and internationally renowned experts to animate
  its debate and research activities.

  With offices in Paris and Brussels, Ifri stands out as one of the rare French
  think tanks to have positioned itself at the very heart of European debate.

                        The opinions expressed in this text
                     are the responsibility of the author alone.

                              ISBN: 978-2-86592-882-8
                            © All rights reserved, Ifri, 2011

              IFRI                                             IFRI-BRUXELLES
   27, RUE DE LA PROCESSION                               RUE MARIE-THERESE, 21
75740 PARIS CEDEX 15 – FRANCE                           1000 – BRUSSELS – BELGIUM
   Tel: +33 (0)1 40 61 60 00                              Tel: +32 (0)2 238 51 10
   Fax: +33 (0)1 40 61 60 60                              Fax: +32 (0)2 238 51 15
       Email: ifri@ifri.org                             Email: info.bruxelles@ifri.org

                                  WEBSITE: Ifri.org
Contents

SUMMARY AND CONCLUSIONS ............................................................. 2

INTRODUCTION ................................................................................... 5

OIL-INDEXED GAS PRICES ................................................................... 8
    Pricing Formula .......................................................................... 8
    Disappearing Rationale for Oil-Indexation .............................. 14

NATURAL GAS MARKET AFTER THE FINANCIAL CRISIS OF 2008 .......... 17
    Natural Gas Demand ................................................................ 17
    Unconventional Gas ................................................................. 22
    LNG Market ............................................................................... 25

OUTLOOK FOR NATURAL GAS PRICING .............................................. 30
    The EU’s Third Package ........................................................... 30
    Spot and Futures Markets in Continental Europe .................. 32
    Relation between Oil and Gas Prices ...................................... 34
    Gas Exporting Countries Forum.............................................. 36
    Way Forward ............................................................................. 38

CONCLUSION .................................................................................... 41

REFERENCES ................................................................................... 42

APPENDIX ........................................................................................ 43
M. Kanai /Decoupling the Oil and the Gas Prices

Summary and Conclusions

This paper looks into natural gas pricing in the post-financial crisis
market and, in particular, examines the question whether the oil-
linked gas pricing system has outlived its utility as global gas markets
mature and converge more rapidly than expected and as large new
resources of unconventional gas shift the gas terms-of-trade.
        Two opposing natural gas pricing systems have coexisted for
the last two decades. On the one hand, there is traditional oil-linked
pricing, used in pipeline gas imports by Continental European
countries and in LNG imports by the countries in Far East. The other
is the system led by futures exchanges in deregulated, competitive
markets largely in the UK and the US.
         In the first half of 2009, natural gas prices set by oil-linked
formulas in Continental Europe were twice as high as market prices
at the Henry Hub or the NBP (National Balancing Point). Because of
this, oil-indexed Russian imports fell sharply to their contract limits
and discussions on de-linking gas pricing started once again. This
time, the most vocal were major European gas companies which had
to buy expensive oil-indexed natural gas. The same situation is
developing in Asia between oil-indexed LNG and the one based on
market gas prices. Even traditional oil-indexed LNG buyers in the Far
East are insisting on a partial linkage to Henry Hub prices.
         Gas pricing formulas in Continental Europe are typically
indexed to light and heavy fuel oil. In the 1970s when oil was used to
fuel many power stations and large-scale industrial plants, the logic of
natural gas directly replacing oil products made sense, but markets
have changed significantly over the past two decades. Crude and oil
products have been increasingly forced out of power generation and
other stationary uses both by price and by policy. Instead, oil is
overwhelmingly used as transportation fuel. Therefore, the logic of oil
as the replacement comparator for gas is no longer supported by
reality.
        The financial crisis and economic downturn starting in
September 2008 had a profound impact on economic activities
including natural gas demand. Global gas demand fell sharply
between 2008 and 2009 and for the first time in decades, electricity
demand also decreased. With weak electricity markets, fuel
competition between spot priced natural gas and coal took place at
many power plants.
       There have been developments on the supply side of the

                                   2
                                  © Ifri
M. Kanai /Decoupling the Oil and the Gas Prices

natural gas market as well. Unconventional gas has completely
changed the landscape of the US gas market in the last few years
and is already being felt across global gas markets. As a result of
increasing production from unconventional gas resources, the
prospects for US LNG imports are scaled down significantly at the
time when Qatar is starting up six of its 7.8-million-tonne-per-year
trains. This has softened the LNG market worldwide, although the
reduction in nuclear power in the wake of Fukushima may mitigate
this somewhat.
        Natural gas pricing based on the market will not happen on its
own as the institutions of market pricing need to be built.
Experiences in the UK and the US show that a mature gas sector
needs to be appropriately regulated with gas-on-gas competition and
transparent trading exchanges. Spot transactions at hubs and futures
trading at financial centres are essential to developing market-based
pricing but they don‟t happen overnight. In the US, gas reform
legislation preceded viable gas trading by more than ten years.
Nonetheless, after the financial crisis of 2008, spot trading volumes at
an increasing number of Continental European hubs have been rising
phenomenally.
        In addition, a number of new futures exchanges are starting
trading. Since futures markets attract a wide range of investors
including financial institutions. They have large trading volumes and
their price formation influence is much larger than that of spot
markets. Historically speaking, it was a futures market, the NYMEX,
which changed oil pricing from OPEC‟s official sales price system to
the market-based price in the 1980s.
       As criticism of oil-linked pricing emerged, Gazprom
announced that it had agreed to link 15% of the volume to spot gas
prices over the period of 2010-2012 in February 2010. But this came
only after Norway was already allowing up to 25% based on spot
prices and the Netherlands‟ GasTerra was giving concessions.
         The IEA calls the issue of decoupling oil and gas prices as
“Arguably, the most important question faced by the gas industry over
the coming three years.”1 Whether the partial spot price indexation
will continue beyond the three years and will be extended to other
contracts depends on the global supply-demand balance and on the
evolution of spot and oil-linked prices. It might also depend on
whether European regulators are going to continue acquiescing in
passing through oil-indexed prices to consumers. The consensus is
that the relatively soft market will continue for the next few years, and,
if so, there will be more pressure to move away from oil indexation.
       However, such a change will not take place uniformly and
universally. There will be in all likelihood many variations. Western
Europe is closer to adopting market pricing. Expansions and

1
    IEA “Medium-Term Oil and Gas Markets 2010”, P195.

                                        3
                                       © Ifri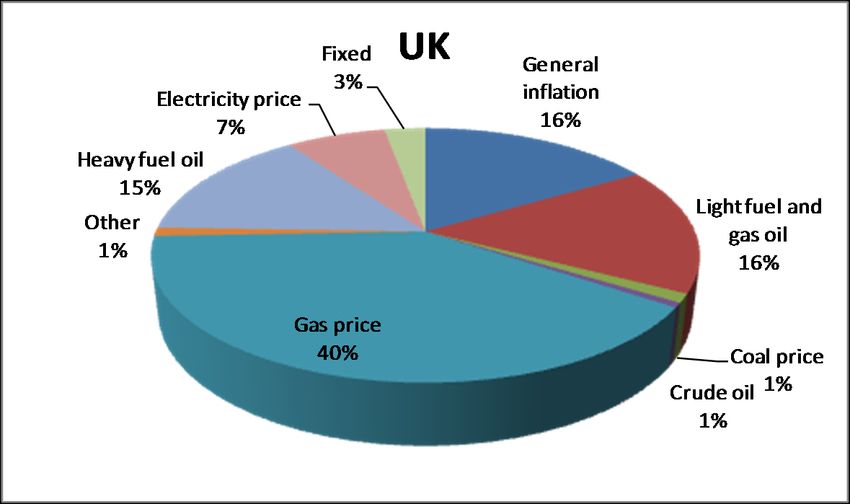
M. Kanai /Decoupling the Oil and the Gas Prices

establishments of futures markets are a particularly good sign. Even
a country like Germany, without an LNG terminal and traditionally
heavily dependent on Russian imports, wants to have lower priced
supplies through interconnections to other countries and by way of
spot and futures trading.
         Meanwhile in Eastern Europe, due to the legacy of the Soviet
Union, one supplier, Gazprom, dominates the gas market. So long as
this situation continues, there is no competition and no market prices.
The deals given by Gazprom to the major Western European buyers
were not generally available to smaller buyers in East and Central
Europe. The region is beginning to diversify its gas supplies through
interconnection with other European countries and via LNG imports.
         In Japan, Korea and Chinese Taipei, conditions are more
difficult for introducing gas-to-gas competition and we will more likely
see LNG prices discounted under the same or a similar scheme as in
Europe rather than a full move to market pricing. However, these
countries know they will lose competitive edge in their economies if
they continue to pay higher energy prices. In all probability, China will
seek gas prices both from Russia and LNG suppliers that reflect
market forces rather than linkages to oil. This will force the hands of
traditional Far East LNG buyers to abandon the JCC for greater
market-based pricing.
        Adopting market-based pricing does not necessarily mean the
end of long-term contracts. Long-term contracts have proven to be
an effective tool for long-term and large-scale investment. If there is
a change, it would be limited to the price provisions of long-term
contracts. The Netherlands and Norway already use these kinds of
long-term contracts, with prices tied to the NBP market. In the case
of the Russians, the rationale behind long term contracts was to
provide an incentive to make the huge investments needed in hostile
frontier gas provinces. The Russians have not upheld their end of the
bargain and should be increasingly held to account for the lack of
investment in incremental capacity. Gazprom production is still 8% off
2008 and is lower than April 2010.
        A gas price formula based on the replacement value had its
own rationale at one point in time. However, as global gas markets
mature, suppliers and consumers are identifying better ways to price
natural gas.     When economies, society and people have the
perception that prices emerging in competitive markets are the real
prices, industry will have to adapt. Europe, the Pacific and many
other countries and regions are ready for such a change.

                                   4
                                  © Ifri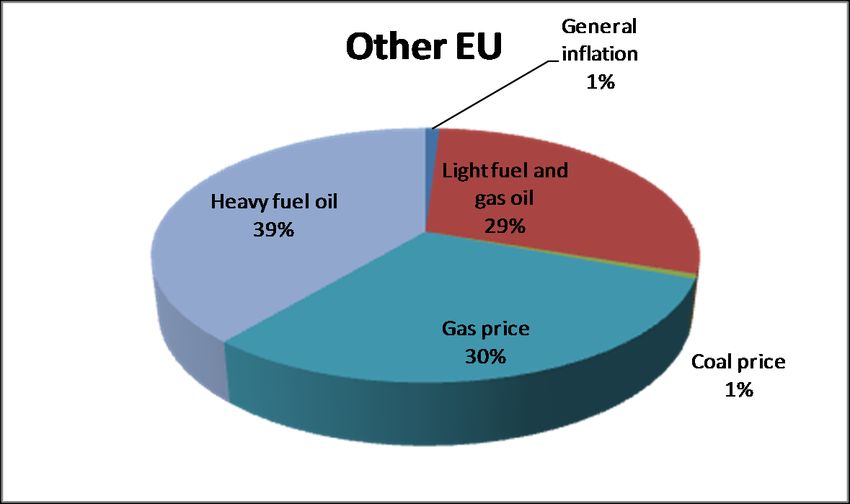
M. Kanai /Decoupling the Oil and the Gas Prices

Introduction

Two opposing natural gas pricing systems have coexisted for the last
two decades. On one hand, there is traditional oil-linked pricing, used
in pipeline gas imports by Continental European countries and in LNG
imports by the countries in Far East (Japan, Korea, Chinese Taipei
and China). The other is the one led by futures exchanges in
deregulated, competitive markets largely in the UK and the US.
There is a third gas pricing system in developing countries and oil/gas
producing countries where natural gas prices are basically set by
political authorities.
                                   Figure 1

        According to the IEA‟s World Energy Outlook 2009, almost
one-third of wholesale gas worldwide is priced on the basis of gas-to-
gas competition, while one-fifth is indexed to crude or oil products.
Some 40% of gas consumed worldwide is subject to direct price
regulations, and about one-quarter is subsidized or sold below the
production cost. The composition for the three OECD regions is
shown below (Figure 1). Gas-to-gas competition determines almost
all wholesale prices in North America, whereas oil-price indexation is
the dominant pricing mechanism in Continental Europe, and also
prevalent in the Pacific.
        While economists and regulators have long argued in favor of
competitive pricing in a deregulated market, this has not been fully
realized in Continental Europe or the Far East. This is in spite of

                                  5
                                 © Ifri
M. Kanai /Decoupling the Oil and the Gas Prices

continuing measures, policies and efforts to deregulate the gas sector
and open it to competition, particularly in Europe. Long term
contracts and oil indexation have their origins in the nascent
European gas market of the 1970s. Since that time, sources of gas
have multiplied; gas markets and infrastructure are much denser.
European gas markets are nearly mature enough for full gas-on-gas
competition and pressure from consumers is building.
        Change is accelerating as a consequence of weak natural gas
markets after the financial crisis starting in summer of 2008. Natural
gas consumption in the OECD countries fell sharply in 2009, and
continued to fall in 2010. It is expected to take a few years for the
gas demand to return to 2008 levels. Coincident with this weak gas
demand, a divergence in prices has emerged. Market-based spot
prices (for both natural gas and LNG) remain low while oil-linked
prices of long-term contract volumes are much higher. Particularly in
Continental Europe and the Far East, this has become a serious
issue for the gas industry and consumers as the gap between the two
has widened to unprecedented levels.
        The graph below (Figure 2) shows oil and natural gas prices
from 2009 to 2011.2 In the graph, natural gas is priced between
“crude oil parity” (shown as calorie conversions for Brent and JCC),
which was historically the goal of gas-producing countries in the price
negotiations, and “market prices” (shown as UK NBP and US Henry
Hub), proving the point advocated by economists and regulators that
during periods of gas-to-gas competition, lower gas prices should
benefit consumers and the economy as a whole. The second point in
the graph is that oil-indexed gas prices follow crude prices with a time
lag of a few months. In the first half of 2009, this put oil-linked natural
gas prices far above Henry Hub and NBP prices (even above the
crude parity prices), reflecting rising crude oil prices in the second half
of 2008.
        Global natural gas trade fell as the demand decreased. But
some gas exporters lost out over others because of the price
differentials. In Europe, for example, gas imports from Russia, which
has oil-linked natural gas prices, fell sharply while Norwegian gas
imports partially based on market prices increased. As a result,
Russia‟s Gazprom had to follow suit by including spot natural gas
prices in its export pricing formula to European customers in early
2010.
        Meanwhile, global spot LNG trading volumes have been
increasing. Qatar is starting production from newly built LNG
liquefaction trains. But the US will not take the LNG as anticipated,
because unconventional gas production is rising fast in that country.

2
  Based on data in Gas Matters (March 2011). Forecast prices for 1Q2011 and
onwards are shown in the graph because some of the natural gas prices are set by a
formula based on other energy prices a few months earlier.

                                       6
                                      © Ifri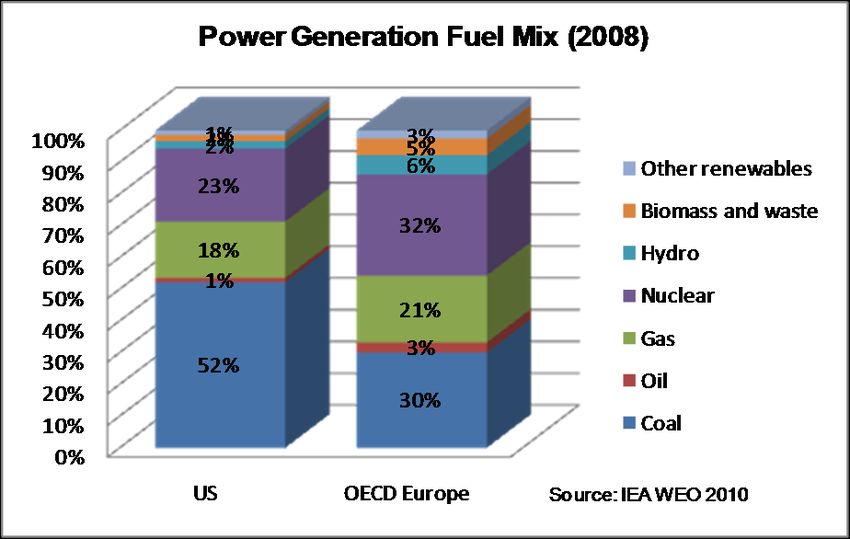
M. Kanai /Decoupling the Oil and the Gas Prices

This situation will create large spot LNG volumes in the coming years,
adding further price pressure on oil-linked LNG volumes under long-
term contracts as well as similarly priced pipeline gas imports.
        Will the oil-linked gas pricing system survive weak gas
markets after the financial crisis? How is economic recovery going to
shape gas price formation? Will the shale gas phenomenon continue
to distort markets? Are gas markets inevitably linked to oil prices by
the market for NGLs? Is Gazprom‟s pricing compromise temporary or
permanent? Will the European Commission‟s third package finally
bring gas-to-gas competitions in Continental Europe? Will there be
changes in the Pacific market in light of the changes in Continental
Europe? This paper looks into natural gas pricing in the post-financial
crisis market.
                                                               Figure 2

                                   Oil and Gas Prices (1Q2009-4Q2011)
            20                                                                           Brent (calorie conversion)

            18
                                                                                         JCC (calorie conversion)
            16
                                                                                         German Border Average
            14

            12                                                                           Troll-NW Europe
  $/mmbtu

            10
                                                                                         Russia-Germany
            8
                                                                                         Algerian Pipline-GME
            6

            4                                                                            Algerian LNG (Spain)

            2                                                                            Asia LNG (JKT)

            0
                                                                                         UK NBP

                                                                                         US Henry Hub

                 Source: Gas Matters (March 2011)
                 Numbers for 2011 are forecast
                 Brent and JCC calculated at 5.929 mmbtu per barrel

                                                              7
                                                             © Ifri
M. Kanai /Decoupling the Oil and the Gas Prices

Oil-Indexed Gas Prices

Pricing Formula
                                                                       3
A typical oil-index pricing formula is expressed as follows.
           Pm = Po + 0.60 x 0.80 x 0.0078 x (LFOm - LFOo)
           + 0.40 x 0.90 x 0.0076 x (HFOm - HFOo)
       In the formula, the natural gas price Pm applicable during the
month of m is a function of the starting natural gas price Po, adjusted
by price developments in the competing fuel markets.
        Po is normally a price based on the concept of netback value.
Given high transportation costs and large infrastructure expenses of
natural gas, the price is designed to reflect the netback value at the
border of the buyer‟s country and is calculated by deducting the
buyer‟s costs between the border and its customers (e.g. transmis-
sion, storage and distribution costs) out of the market value. In some
cases, marketing incentives are incorporated in Po, setting the gas
price marginally lower than those of competing fuels.
       LFOo and HFOo are the starting prices of light fuel oil and
heavy fuel oil. LFOm and HFOm represent the prices for the month
m, which typically take the average value of the previous six to nine
months with a time lag. The prices are quoted from markets and in-
clude or exclude taxes, depending on the agreement.
         In this example, 0.60 and 0.40 represent the natural gas mar-
ket segments which compete with light fuel oil and heavy fuel oil res-
pectively. (Note that these are not ones for light fuel oil and heavy fuel
oil in the total energy market.)
        Meanwhile, 0.80 and 0.90 are called the pass through factor.
Assume ratios of 0.8 and 0.9 and that the prices for light fuel oil and
heavy fuel oil are rising, buyers will benefit from this price setting.
Conversely, sellers will benefit from it when the prices are falling. This
factor serves to share risks and rewards between sellers and buyers
in the changing price conditions.

3
    “Putting a Price on Energy” (Energy Charter Secretariat, 2007), P154.

                                           8
                                          © Ifri
M. Kanai /Decoupling the Oil and the Gas Prices
The figures 0.0078 and 0.0076 are technical factors to convert
fuel oil prices per unit (e.g. $/tonne) into natural gas prices per unit
(e.g. euro/kWh).
In addition, long-term contracts usually have some form of
price review clause allowing parties, at regular intervals (typically
three years) or when the market undergoes major changes, to review
the price formula in order to adjust it to changing market conditions.
While light fuel oil and heavy fuel oil are the two factors most
commonly quoted in the price formula, other energy prices are also
quoted. According to the European Commission‟s “Energy Sector
Inquiry”4, natural gas prices are also indexed in varying degrees to
inflation, crude oil, coal, electricity, spot gas and others, in addition to
light fuel oil and heavy fuel oil. The first graph (Figure 3) shows price
indexation under long-term gas supply contracts in the European
Union as a whole. It is based on the data for 2004 and indicates the
average volume-weighted indexation in the sample of contracts. Due
to confidentiality surrounding price formulas, “Energy Sector Inquiry”
still remains an important publicly accessible document a few years
after its publication.
There are large variations of indexation by supply source and
by purchasing region. The second and third groups of graphs (Figure
4 and 5) show the differences. The Netherlands, Norway and Russia
place emphasis on light and heavy fuel oils in their price formulas
among the producers. Meanwhile, Algeria‟s heavy indexation to
crude oil can be traced back to price negotiations on its LNG and
Transmed pipeline exports taking place during the country‟s turbulent
period in the late 1970s and early 1980s. Interestingly in the UK
where the NBP market price is dominant, there are various other
price quotations (including not only light and heavy fuel oils but also
general inflation, electricity price, coal price, crude oil and other) in
the price formulas on both selling and purchasing sides. This
suggests the complexity of gas pricing and that price formulas are
used to make adjustment to NBP prices in individual deals.
In addition, “Energy Sector Inquiry” points out that “Since the
continuing practice of linking gas to oil and oil-derivatives‟ prices is
widespread in Europe, contract prices paid by different producers to
different suppliers move in an almost identical manner through time.
As a result, prices paid by purchasers under long-term contracts do
not react smoothly (or at all) to changes in the supply and demand of
gas markets. This effect is exacerbated by the fact that the
indexation in long-term contracts is usually linked to variables
calculated with trailing averages, further reducing response to price
signals.”
4
“DG Competition Report on Energy Sector Inquiry” (European Commission,
January 2007), P101.
9
© IfriM. Kanai /Decoupling the Oil and the Gas Prices
Figure 3
Source: Energy Sector Inquiry 2007
Figure 4 Price Indexation by Producing Region
10
© IfriM. Kanai /Decoupling the Oil and the Gas Prices
11
© IfriM. Kanai /Decoupling the Oil and the Gas Prices
12
© IfriM. Kanai /Decoupling the Oil and the Gas Prices
Source: Energy Sector Inquiry 2007
Figure 5 Price Indexation by Consuming Region
13
© IfriM. Kanai /Decoupling the Oil and the Gas Prices
Source: Energy Sector Inquiry 2007
Disappearing Rationale for Oil-Indexation
In the first half of 2009, natural gas prices set by oil-linked formulas in
Continental Europe were twice as high as market prices at the Henry
14
© IfriM. Kanai /Decoupling the Oil and the Gas Prices
Hub or the UK/NBP. Because of this, oil-indexed Russian imports fell
sharply to their contract limits and discussions on de-linking gas
pricing started once again. This time, the most vocal were European
gas companies which had to buy expensive oil-indexed natural gas.
In the 1970s, when oil was used to fuel many power stations
and large-scale industrial plants, the logic of natural gas replacing oil
products made sense, but markets have changed significantly over
the past two decades. Crude and oil products have been increasingly
forced out of power generation and other stationary uses by both
price and policy. Instead, oil is now overwhelmingly used as a
transportation fuel. Therefore, the logic of oil as the replacement
comparator for gas is no longer supported by reality.
Jonathan Stern of the Oxford Institute for Energy Studies says
oil-indexation pricing has already been outdated.5 Stern wrote a
paper in 2007,6 which he supplemented with a follow-up paper after
the financial crisis in 2009.7 He argued that “the logic of linking gas
prices to those of (mainly) oil products had largely disappeared in the
major European gas markets.”8
According to Stern,9 the original rationale for oil-linked gas prices
was that end-users had a real choice between burning gas and oil
products, and would switch to gas if there was a price incentive to do
so. This was justified when oil product indexation was established in
the late 1970s and early 1980s. However, the interest of existing gas
users to switch to oil products appeared to be limited and declining in
the 2000s, because of:
the cost and inconvenience of maintaining oil-burning
equipment and substantial stocks of oil products
The continuing insecurity of oil suppliers
the emergence of modern gas-burning equipment in
which the use of oil products means a substantial loss
of efficiency
tightening environmental standards in relation to power
sector emissions
5
Stern wrote that “[the 2007 paper] probably created more debate and controversy
than anything else I have ever written”. Stern (2009), Acknowledgements.
6
Stern “Is There A Rationale for the Continuing Link to Oil Product Prices in
Continental European Long-Term Gas Contracts?” (Oxford Institute for Energy
Studies, 2007).
7
Stern “Continental European Long-Term Gas Contracts: is a transition away from oil
product-linked pricing inevitable and imminent?” (Oxford Institute for Energy Studies,
2009).
8
Ster (2009), P2.
9
Stern (2007), P33.
15
© IfriM. Kanai /Decoupling the Oil and the Gas Prices
He continued that “the original rationale [becomes] increasingly
dubious in the majority of countries, particularly in North West
Europe. There is no likely scenario in which European energy users
installing new fuel-burning equipment will choose to use oil products
rather than gas in stationary uses, unless they have no access to a
gas supply”.
Stern also questioned the price transparency of fuel oil
markets. He wrote that, although gasoil prices were quoted at a
number of locations in Europe in a range of widely accepted industry
publications (such as Platts and Argus) and gasoil markets were
verifiably liquid, fuel oil had neither of these attributes.
He concluded that “a transition away from formal contractual
oil product price linkage is inevitable and arguably has already begun
with a great degree of spot gas pricing indexation in some long term
contracts”.10
10
Stern “Continental European Long-Term Gas Contracts: is a transition away from
oil product-linked pricing inevitable and imminent?” (Oxford Institute for Energy
Studies, 2009), P13.
16
© IfriM. Kanai /Decoupling the Oil and the Gas Prices
Natural Gas Market
after the Financial Crisis of 2008
Natural Gas Demand
The financial crisis and economic downturn starting in September
2008 had a profound impact on economic activities including natural
gas demand. Global gas demand fell sharply by 3% between 2008
and 2009. Previously, global gas demand had fallen only twice – first
in 1975 following the oil crisis and, then, in 1992 in the aftermath of
the collapse of the Soviet Union. But the drop this time was larger
than on those occasions in both percentage and volume terms.
In addition, electricity demand decreased by 4% in OECD
countries in 2009 for the first time ever. With weak electricity markets
and lower gas prices, fuel competition, mainly between spot priced
natural gas and coal, took place at many power plants. But the
situation varied from one country to another. The US, for instance,
saw gas demand increasing at power generation plants, thanks to low
gas prices resulting from rising unconventional production (Figure 6).
The share of natural gas in power generation rose from 21% in 2008
to 23% in 2009, while coal‟s share fell from 48% to 45%. In absolute
terms, there was a loss of 230 million Megawatthours in coal-based
generation between 2008 and 2009, and 38 million Megawatthours of
that gap was filled with gas. Conversely in the European and Pacific
power generation sector, high oil-linked gas prices exacerbated the
decline in gas demand.
According to IEA statistics, OECD gas demand fell by 50 BCM
or 3.2% to 1,495 BCM in 2009. Within the OECD, Europe suffered
the most as demand dropped by 5.4%. Demand in the OECD Pacific
decreased by 3.4%, while North American demand fared relatively
well with a fall of just 1.7% (Figure 7). As mentioned above,
displacement of coal by gas took place in the US.
Looking into the OECD gas demand by sector, the industrial
and power sectors largely accounted for the fall (Figure 8). Many
factories and plants were closed or reduced their output due to the
economic downturn, while reduced economic activity caused a fall in
electricity demand across the board.
17
© IfriM. Kanai /Decoupling the Oil and the Gas Prices
Figure 6
million US Power Generation by Fuel Source
Megawatthours (1998-2009)
Other
4,500
Hydroelectric
4,000
3,500 Renewables
3,000 Nuclear
2,500
Other Gases
2,000
1,500 Natural Gas
1,000 Petroleum
500
Coal
0
Source: EIA
Figure 7
OECD Gas Demand by Region
1,800
1,600
175 180 182 189 195 Pacific
1,400 169
1,200 North America
1,000 814 820 835 Europe
800 804 803
800
600 Source: IEA
400 Unit: BCM
557 544 540 548 2008-09:
527 533
200 historical
2010: estimates
0 2011-13:
forecasts
2008 2009 2010 2011 2012 2013
Source: IEA, Medium-Term Oil and Gas Markets, 2010
In late 2009 and early 2010 OECD economies started showing
some improvement and gas demand started rising. Increasing gas
demand was also supported by the cold winter of 2009/2010. In the
second half of 2010, however, gas demand for industrial use and
power generation slowed down. It was thought that fiscal stimulus
packages provided by the governments were phasing out in the
second half and that economic recovery was not strong enough to
continue the growth.
18
© IfriM. Kanai /Decoupling the Oil and the Gas Prices
The IEA forecast that OECD gas demand would recover
slowly with consumption returning to the 2008 levels by 2012 or 2013,
depending on the region.11 Meanwhile, the main drivers of gas
demand - the economies in North America and the Pacific - are
expected to show strong economic recoveries while Europe‟s
recovery is anticipated to be more sluggish. Sector-wise, the
residential and commercial sectors will be relatively stable, while the
industrial sector will recover only slowly and not return to the 2008
level until 2013.
Figure 8
OECD Gas Demand by Sector
1,800
Other
1,600
152 153 155 157 159 Power Generation
1,400 152
1,200 Industry
529 516 532 529 548 563
1,000 Resdential/Commercial
800
343 306 310 320 331 342
600 Source: IEA
400 Unit: BCM
2008-09:
200 524 522 532 513 513 514 historical
2010: estimates
0 2011-13:
forecasts
2008 2009 2010 2011 2012 2013
Source: IEA, Medium-Term Oil and Gas Markets, 2010
Outside the OECD, demand fell in the former Soviet Union but
rose in China, India, the Middle East and North Africa, whose
economies were largely unaffected by the financial crisis and
economic downturns. Most significant developments in natural gas
demand are taking place in Asia.
In 2009 Chinese gas demand grew by 11% to 90 bcm.12 But
natural gas accounted for only 3.7% in the country‟s primary energy
13
mix. More than 70% of China‟s energy need is met by coal but the
country needs cleaner energy. Therefore, China‟s gas demand is
expected to increase faster than any other country/region. China
began to receive LNG imports in 2006. The country has three
operating terminals with a capacity of 17 bcm per year, and three
more are under construction. China has long-term contracts with
11
IEA, “Medium-Term Oil and Gas Markets” (2010), P141.
12
Cedigaz
13
BP Statistical Review of World Energy 2010
19
© IfriM. Kanai /Decoupling the Oil and the Gas Prices
Australia, Indonesia, Malaysia and Qatar. It imported 7.6 bcm of LNG
both under long-term contracts and on a spot basis in 2009, an
increase of 72% from the previous year. Moreover, in January 2010
China started importing Turkmen gas through the newly-built
Turkmenistan-China pipeline transiting Uzbekistan and Kazakhstan.
The import volume currently stands at 20 bcm per year but is set to
increase to 40 bcm per year with the opening of the second pipeline
in 2011-12. Gas pricing in this pipeline is reported to be oil-linked.
Indian gas demand grew even faster than Chinese demand in
14
2009, rising by 23% to 53 bcm. This large increase was because of
the exploitation of the offshore giant Krishna-Godavari KG-D6 field
near the city of Kakinada on the eastern shore. The field started
production in April 2009, supplying gas to the domestic market.
Output from the field is expected to reach a plateau of 30 bcm per
year in 2011. As in China, coal dominates India‟s primary energy mix
(52%) and natural gas accounted for only 10% in 2009.15 Therefore,
there is room for further gas demand increases. India started
importing LNG in 2004, rising to 13 bcm in 2009, a 17% increase from
the previous year. India has two operating LNG terminals and one is
under construction. In addition, there are three planned gas pipeline
projects (Iran-Pakistan-India, Turkmenistan-Afghanistan-Pakistan-
India and Myanmar-India) to import gas – none of which appear to be
on the near horizon.
As pointed out earlier, power sector demand can vary due to
competition among fuels. The US uses much more coal (52%) than
OECD Europe (30%). Meanwhile, OECD Europe relies more on
nuclear (32%) than the US (23%), due mainly to contributions from
France. Natural gas accounted for 18% of power in the US and 21%
in OECD Europe in 2008 (Figure 9). The OECD power generation
demand should be returning to the 2008 levels in 2010, thanks to
increases in North America. The future power generation demand
also depends on energy and environmental policies on renewable,
nuclear and CO2 among other things. Because European electricity
grids are poorly integrated, the aggressive installation of wind and
solar power in certain countries is accelerating the expansion of gas
capacity to provide stability to national grids where intermittent power
is prevalent.
14
Cedigaz
15
BP Statistical Review of World Energy 2010
20
© IfriM. Kanai /Decoupling the Oil and the Gas Prices
Figure 9
The IEA‟s forecast in the autumn of 2010 did not incorporate
political upheavals in the MENA region or Japan‟s earthquake/
tsunami/nuclear disaster, all of which are unfolding as of writing.
In recent years, gas demand in Egypt and Libya as well as
other gas-producing countries in North Africa and Middle East has
been expanding rapidly, supported by government policy to promote
domestic gas use in order to maximize oil exports. Social and
economic turmoil in North Africa and Middle East will bring down
domestic natural gas demand at least in the short term, as happened
in the FSU in the 1990s. Furthermore, long term natural gas
production and exports from these countries could be affected by the
turmoil if things go wrong.
Meanwhile, Japan is likely to need more natural gas (i.e. more
LNG imports) to meet its electricity demand, in the absence of
affected nuclear reactors at Tokai, Fukushima and Onagawa. This
could in turn tighten the global LNG market. In the medium- to long-
term, should many countries reduce their nuclear ambitions, the fuel
of choice to compensate for lower nuclear will be gas. But the
situation is still fluid at Fukushima as of writing and it is too early to
assess the larger picture.
21
© IfriM. Kanai /Decoupling the Oil and the Gas Prices
Unconventional Gas
Unconventional gas is the most popular topic in the natural gas sector
right now. It has completely changed the landscape of the US gas
market in the last few years, and is already being felt across global
gas markets. Unconventional gas production began in the US on a
commercial basis in the 1980s. During the 1990s output volumes
rose with the vastly expanded application of new technologies – more
powerful seismic, hydraulic fracturing and horizontal drilling.16 With
the high gas prices of the mid 2000s, increasing production from
unconventional gas resources grew rapidly, offsetting a decline in
conventional gas production, drastically reversing the downward trend
of total US domestic natural gas output, and having a large impact on
the world LNG market. US net gas imports peaked at 108 bcm
(including 21 bcm of LNG imports) in 2007. Two years later in 2009,
the net imports fell to 79 bcm (including 12 bcm of LNG imports),
which can be attributable to growing unconventional gas production.
Due to earlier expectations of higher LNG imports, the US proceeded
with expansions and construction of LNG terminals. There are 11
operating LNG terminals, with a capacity of 172 bcm per year, and
three terminals under construction, with a capacity of 31 bcm per
year, in the US.17 US LNG terminals are destined to suffer low
utilization rates – and some are even exploring options to reverse
their activities by taking up liquefaction of US gas for export. Three
terminals on the Gulf coast have been authorized to re-export
delivered LNG.
18
There are four types of unconventional gas: tight gas,
19 20 21
coalbed methane (seam gas), shale gas and gas hydrates.
There is no commercial production of hydrates yet. But the others
(tight gas, coalbed methane and shale gas) are all produced
commercially today. In the US, shale gas production is already larger
16 Advanced 3D micro-seismic technology has been employed to monitor hydraulic
fractures and subsurface water circulations in recent years.
17 The Federal Energy Regulatory Commission
http://www.ferc.gov/industries/gas/indus-act/lng.asp
18 Tight gas is natural gas produced from a low-permeability formation (mainly
sandstone and limestone) which cannot be developed economically with
conventional vertical wells.
19
Coalbed methane is natural gas contained in coal beds. The gas has an affinity to
coal and is held by pressure from groundwater.
20
Shale gas is natural gas produced from hydrocarbon-rich shale formations. Shale
gas originates from organic matter trapped during the formation of sedimentary shale
rocks.
21
Gas hydrates are naturally occurring crystalline water-based solids, physically
resembling ice. In hydrates, non-polar gas molecules are trapped inside a cage-like
structure of hydrogen-bonded water molecules (known as a clathrate). Many gases
form hydrates in nature. But methane hydrates are by far the most common,
because methane is the most abundant natural gas.
22
© IfriM. Kanai /Decoupling the Oil and the Gas Prices
than that of coal-bed methane. Unconventional gas is defined as
natural gas extracted from the source rock as opposed to
conventional gas produced from a sealed reservoir to which gas has
migrated from the source rock. In this sense, shale gas is truly
“unconventional”.22
Figure 10
US Natural Gas Production (1990-2035)
30 alaska
25 shale gas
20 Coalbed Methane
TCF
15 onshore non-associated gas
(including tight gas)
10 offshore non-associated gas
5 associated gas
0 net imports
1998
2002
2006
2010
2014
2018
2022
2026
2030
2034
1990
1994
Source: US EIA, AEO 2010
Unconventional gas production wells decline faster than
conventional ones and the total production is smaller requiring more
drilling and fracturing. In addition to the use of the latest technologies
like hydraulic fracturing, horizontal drilling and micro-seismic, these
wells require close quality control over well integrity, water
management and well retirement to ensure no negative impact on the
environment.
In 200923 unconventional gas output (including coalbed
methane and shale gas but excluding tight gas) accounted for 22%
(or 129 bcm) of the total US natural gas production of 583 bcm.
Unconventional gas output is expected to increase to 227 bcm in
2035, accounting for 34% of the total (Figure 10).
According to the EIA, US well-head natural gas prices
averaged $3.67 per mmbtu for 2009 and $4.16 per mmbtu for 2010.
One can say that unconventional gas - in part produced to profit from
high NGL (Natural Gas Liquids) prices - has brought down the natural
gas price to these levels. As a consequence, the US enjoys the
lowest natural gas prices among OECD countries.
22
See “Les perspectives du Shale Gas dans le monde” Bruno WEYMULLER (Note
de l'Ifri, January 2011)
23
Data for 2010 is not available as of writing.
23
© IfriM. Kanai /Decoupling the Oil and the Gas Prices
In fact, one factor helping unconventional gas production is
the considerable financial contribution from liquids sales. Setting
aside the debate whether gas shale contains more NGLs than
conventional reservoirs or not, NGL production has always been an
integral part of the development plan in the Barnett shale play in
northern Texas. As the shale gas production grows there, NGL output
increases correspondingly. NGL sales bring financial benefits
especially when oil prices (NGL prices track oil prices) are higher than
natural gas prices on a btu-equivalent basis. Therefore, gas is
produced as much for the value of its associated liquids as for the
sale of the gas itself.
In Europe, Austria, France, Germany, Hungary, Poland,
Sweden and the UK are starting to explore and develop
unconventional gas resources. Europe imports more than 45% of the
natural gas it consumes, and recently suffered from disruptions of
natural gas supply from Russia. Therefore, many countries are
examining unconventional gas as a mean to reduce their import
dependency and to enhance the supply security. The focus is Poland
where some 60 exploration permits have been issued and drilling
campaigns are currently under way.
Europeans will need to identify a new set of regulations,
environmental standards and revenue sharing mechanisms to
convince their publics to accept gas production from shale. Subsoil
ownership and fiscal regimes for minerals differ a great deal from the
US. In France, a harsh public debate results from a lack of public
consultation on shale gas permitting and the arrival of “Gasland” in
local theaters. As 2012 is a presidential election year in France, both
oil and gas work in shale is effectively stalled.
At this time, it still remains uncertain whether unconventional
gas will repeat the same success in Europe as it has in the US. The
development of unconventional gas is still in an early stage in Europe
where the resource base is being evaluated. In addition, there are
issues of water use/disposal and the environmental impacts of
fracturing operations, which worry local communities and
governments. Europe does not have the same experience with oil
and gas production as most American states. Nonetheless,
unconventional gas production has the potential to change not only
Europe‟s security of supply but also the basic fabric of European gas
markets.
China is in the early stage of exploring and exploiting
unconventional gas resources. The government is keen to promote
policies to develop its unconventional gas resources, as the country‟s
natural gas import dependency is expected to rise. There is tight gas
production in China. But, because China categorizes tight gas into
conventional gas, the size of tight gas production is unknown.
Traditionally, the focus is on coalbed methane. China as the world‟s
largest coal producer has some 130 bcm of proved coalbed methane
reserves, and is estimated to have produced 3 bcm mainly from the
24
© IfriM. Kanai /Decoupling the Oil and the Gas Prices
Ordos basin in 2010. Although there is no shale gas production in the
country, China is looking to the success of shale gas in the US.
PetroChina has drilled a few wells recently, while foreign firms such
as Shell and Fortune Oil are studying the shale gas resources.
Needless to say, all of the potential new gas arising from
unconventional plays puts greater pressure on the linkage between
gas prices and crude oil or oil products.
LNG Market
LNG is an increasingly important factor in shaping the global natural
gas market after the financial crisis of 2008. Between April 2009 and
December 2010 Qatar started up six 7.8-million-tonne-per-year trains,
bringing its ambitious liquefaction capacity expansion programme into
reality (Figure 11).24 Thanks to these new trains, Qatar‟s total
liquefaction capacity has increased by 50% to 77 million tonnes per
year.25 Supported by this supply side development, world LNG trade
volumes increased by 7.3 % in 2009 and by 22% in 2010.
With six trains fully operating, LNG supply from Qatar is
expected to grow even further in 2011. The US was originally the
intended market for much of this production. But prospects for
exports to the US have been sharply curtailed because of increasing
unconventional gas production there. As Qatar looks for alternative
markets, it has concluded a number of long-term contracts with China
in 2008-2010. But LNG cargoes without a predetermined customer
are serving as a tool for transmitting price signals between previously
separate markets, as Qatar offers the European and Asia Pacific
buyers with short-term and spot LNG cargoes. In 2010 Qatar
became the largest LNG supplier to Korea and Chinese Taipei.
Meanwhile in Europe, it supplies LNG both at the market price, mainly
to Belgium and the UK, and at the oil-index price under long-term
contracts. While Qatar has developed large LNG tankers called “Q-
flex” and “Q-max” to reduce transportation costs, it is reportedly
mulling over the use of normal tankers to sell its LNG to other markets
which do not have port facilities for “Q-flex” and “Q-max”.
On the import (demand) side of the world LNG trade, the Asia
Pacific market continued to account for more than one half. The Asia
Pacific market‟s LNG imports actually fell by 2.0% in 2009 but rose by
17% in 2010. Meanwhile, European LNG imports are rising fast. As
explained above, market-priced LNG imports are increasing, eating
into shares of expensive pipeline gas imports indexed to oil. The
24
With the start-up of six new liquefaction trains, Qatar has completed its capacity
expansion program, and currently does not have further expansion programmes.
25 Qatar now has by far the largest liquefaction capacity in the world, more than
double that of the second largest, Indonesia, or the third largest, Malaysia.
25
© IfriM. Kanai /Decoupling the Oil and the Gas Prices
European import volume has increased by 24% or 13 BCM in 2009
and by another 26% or 18 BCM in 2010. This has been helped by
the opening of a number of LNG terminals – Dragon and South Hook
in the UK, Fos Cavaou in France, and Adriatic (Rovigo) in Italy.
Russia‟s pipeline exports to Europe fell by 20 BCM from 2008 to
2009.26 Therefore, LNG can be thought to have caused 13 BCM of
the 20-BCM decline in 2009.
Figure 11
Qatar’s New Liquefaction Trains
Project Partners Capacity # of trains Start-Up
Qatargas 2 Qatar 7.8 mt/y 2 Apr 2009
Petroleum,
ExxonMobil,
Total
Qatargas 3 Qatar 7.8 mt/y 1 Sep 2010
Petroleum,
ConocoPhillips,
Mitsui
Qatargas 4 Qatar 7.8 mt/y 1 Dec 2010
Petroleum,
Shell
RasGas 3 Qatar 7.8 mt/y 2 Sep 2009
Petroleum, Feb 2010
ExxonMobil
Source: various
There are two pricing systems co-existing in the global LNG
trade. One is famously called the “S-curve” linked to oil, commonly
used in the Asia-Pacific basin, and the other is based on the
competitive market prices of natural gas, used in more flexible LNG
trading in the Atlantic basin.
Typically S-curve pricing formula is expressed as:27
P=A*JCC+B
A is a coefficient linking the JCC (Japanese Crude Cocktail)
quotation in $/bbl with the LNG price in $/mmbtu. Long-term LNG
contracts commonly use the average monthly JCC prices over a
certain period, to dilute the volatility of oil prices. The coefficient A is
a heating conversion factor from oil to gas and the heat parity value is
typically 0.172. But actual coefficients used in the contracts are
somewhat smaller (the slope is gentler). B is a constant in $/mmbtu.
26
Cedigaz. Pipeline trade volumes for 2010 are not available as of writing.
27
“Putting a Price on Energy” (Energy Charter Secretariat, 2007), P190.
26
© IfriM. Kanai /Decoupling the Oil and the Gas Prices
Figure 12: S-Curve
Source: Jensen Associates
S-curves are intended to reduce price risks by mitigating the
impact of either rapidly rising or falling oil prices. The sellers need to
have some form of price floor, protecting their liquefaction projects
from oil price collapse. As a trade-off, buyers want upside protection.
Floor and ceiling prices can be set to offset such risks. In actual
contracts it is more common to change the slope, which represents
the oil-gas price relationship, above and below certain price levels.
The graph below is a typical S-curve from the early 2000s.
The increase in oil prices starting 2005 put upward pressure
on LNG pricing. In the contracts signed in this period (such as
Australian North West Shelf or Indonesian Tangguh), the slopes
became steeper and there were no ceiling prices or upside
protections. Then, oil prices collapsed in 2008 and the gas market
became over-supplied in 2009 and onwards. These oil-indexed LNG
volumes have to compete with market-priced spot LNG volumes in
the market. Now traditional oil-indexed LNG buyers, such as Tokyo
Gas, are insisting on gentler slopes and a partial linkage to Henry
Hub or other market prices.28
The other LNG pricing system is based on natural gas market
prices. During the 2000s LNG trade expanded rapidly in the Atlantic
market. International oil companies (IOCs),29 which had liquefaction
plants in Trinidad and Tobago, Nigeria and other countries as well as
terminals in Europe and North America, started flexible LNG trading
28
“Gas Matters” (December-January 2011), P11.
29
Including BG, BP, Repsol, Shell, Statoil and Total.
27
© IfriM. Kanai /Decoupling the Oil and the Gas Prices
based on schemes called “arbitrage” and “self-contracting”. These
IOCs took marketing risks and started selling the re-gasified gas from
LNG (in many cases, via pipeline) directly to the final consumers in
North America and Europe. Since LNG cargos going into the UK and
the US had to compete with other pipeline gas, they were priced
based on Henry Hub and NBP prices. Belgium‟s Zeebrugge terminal
also played an important role in expanding this flexible LNG trading to
Continental Europe.
A situation similar to Continental Europe is developing
between the Asian S-curve LNG pricing and the one based on the
UK/US gas markets. In the fourth quarter of 2010, oil-linked Asian
LNG price averaged $12.90/mmbtu. Meanwhile, LNG cargos going
into the US were priced so that they could compete with the Henry
Hub price of $3.80/mmbtu. The differential ran as high as $9/mmbtu,
as abundant shale gas supplies in the US lowered natural gas prices
at Henry Hub. Furthermore, LNG cargos destined for the UK market
faced competition from the NPB price of $7.28/mmbtu. Even for the
cargos entering into Continental Europe, the threshold is the Russian-
German pipeline gas price of $8.84/mmbtu for the same quarter (see
Figure 2). There is a desire to change the indexation from crude oil to
gas market price among buyers in the Asia Pacific market. However,
the discussion is not making progress, because there are no major
competitive gas markets in the region and the Henry Hub and NBP
markets are geographically far away.
LNG can move between markets so long as the price spreads
allow. Increasingly, these differentials drive the trading community's
interest in LNG. The spot LNG market30 has been growing steadily
since its inception in the early 1990s (Figure 13). Spot trading
jumped to 19% of the total LNG trading volume in 2007, owning to
stoppage of operation at Japan‟s Kashiwazaki-Kariwa nuclear power
plant and Korea‟s delay in signing long-term contracts, and then fell in
2008. Figure 14 shows that spot LNG trading (Asian spot, European
spot and UK/US combined) accounted for 17% of the total in 2009.
Spot LNG trading is expected to increase again in the next few years,
because of extra demand from Japan, resulting from its nuclear
problem. LNG trading today is buying and selling the physical only
and there are no financial or “paper” markets – LNG is not a global
commodity yet. Nonetheless, LNG spot trading is increasingly
playing an important role in cross-border gas price formation. But the
gas bubble that the IEA was projecting for the next few years is
already being absorbed by the huge increases in Chinese
consumption and this may slow the growth of spot LNG.
30
Including trading on a spot basis and under short-term contracts.
28
© IfriM. Kanai /Decoupling the Oil and the Gas Prices
Figure 13
BCM/Y LNG Spot Market (1992-2009)
300
250
200
150
100
50
-
1992
1993
1994
1995
1996
1997
1998
1999
2004
2005
2006
2007
2008
2009
2000
2001
2002
2003
Source: IEA,
Cedigaz long-term contracts spot market
Figure 14
29
© IfriM. Kanai /Decoupling the Oil and the Gas Prices
Outlook for Natural Gas Pricing
The EU’s Third Package
Natural gas pricing based on the market will not happen on its own.
Experiences in the UK and the US show that a mature gas sector
needs to be appropriately regulated to promote gas-on-gas
competition and transparent trading exchanges. The experience in
North America took over 10 years from the National Gas Act in 1978
to begin to rationalize US gas markets, but 23 years later, markets
are still maturing. Spot transactions at hubs and futures trading at
financial centers are essential to developing market-based pricing. At
the same time, it should be noted that long-term deals still have their
utility as European gas market is relatively immature. Long-term
deals help investors with expensive infrastructure in upstream and
mid-stream.
In Europe, the European Union‟s third energy package came
into force on March 3, 2011. The third package consists of (in terms
of gas):
Gas regulation – regulation of conditions for access to the
natural gas transmission networks.
Regulation establishing ACER (Agency for the Cooperation of
Energy Regulators).
Gas directive concerning common rules for the internal market
in natural gas (2009/73/EC).
The third package focuses on unbundling – separation
between transmission and production/supply of vertically integrated
companies. It aims at enhancing non-discriminatory access to
networks to create competition between producers/suppliers. The
gas directive provides the EU member states with three policy options
for unbundling:
Ownership unbundling (OU) – There is no control of the
supplier over TSO (Transmission System Operator) who owns and
manages the network. Although minority shareholding is allowed, the
supplier does not have voting rights and cannot appoint
administrators.
Independent System Operator (ISO) – The ownership of
network is vertically integrated into the supplier. But the network is
operated by a separate entity, ISO. The ISO will make investment
30
© IfriM. Kanai /Decoupling the Oil and the Gas Prices
decisions. The regulator will have strict monitoring in this case.
Independent Transmission System Operator (ITSO) – The
ownership as well as the operatorship of network are vertically
integrated into the supplier. TSO (Transmission System Operator) is
created within the supplier. The TSO has independent management,
supervisory body and compliance officer. The TSO will be placed
under heavy regulations and monitoring.
In February 2011, the European Union‟s heads of state and
the governments confirmed that a “fully functional, interconnected and
31
integrated internal market” should be fully implemented by 2014 and
that “no European state should remain isolated from the European
gas and electricity networks after 2015”.
Through the first and second packages (1998, 2003), the
European Commission has sought to create a competitive European
gas market. So far, the Commission has most effectively challenged
the destination clauses in LNG and pipeline gas supply contracts. It
has successfully had Algeria, Nigeria and Russia agree to remove the
destination clauses from existing or future contracts. This issue came
up again in a recent deal between Poland and Russia. An
intergovernmental agreement was signed in October 2010, stipulating
Russian gas supply to Poland for 2010 to 2022, preferential gas
prices and establishment of pipeline operator in the Polish section of
the Yamal pipeline. The agreement also included abolition of the
destination clause which had prevented Poland from re-exporting gas
to third parties, where once again the Commission had to force
destination restrictions out of the deal.32
Furthermore, the European Commission has viewed it as a
competition issue that particular importers have similar pricing
formulas in their contracts with particular exporters. Meanwhile, the
Commission shows understanding for the need for long-term
contracts on the grounds that they are a necessary tool to secure
investment in large-scale energy projects. With the third package, the
European Commission is determined to bring full competition into the
gas sector.33
31
This is taken as the deadline for the third package.
32
“Gas Matters” (December-January 2011), P18
33
“Gas Matters” (March 2011), P19.
31
© IfriYou can also read