Work in Progress: Assessment of Automation Labs to Facilitate Continuous Improvement
←
→
Page content transcription
If your browser does not render page correctly, please read the page content below
Paper ID #33012

Work in Progress: Assessment of Automation Labs to Facilitate Continuous
Improvement
Mr. Bradley Lane Kicklighter, University of Southern Indiana
     Brad holds a BS in Electrical Engineering from Rose-Hulman Institute of Technology (1989) and an MS
     in Electrical and Computer Engineering from Purdue University (2001).
     His past work experience includes eleven years at Delphi (formerly Delco Electronics) as an Advanced
     Project Engineer, eleven years at Whirlpool Corporation as a Lead Engineer/Solution Architect, and three
     years at Ivy Tech Community College as an Instructor/Program Chair of Pre-Engineering. Since 2015,
     he has been employed at the University of Southern Indiana as an Assistant Professor of Manufacturing
     Engineering Technology.
     He holds three patents, has served as an IEEE section officer since 2004, and has been a Licensed Profes-
     sional Engineer in the State of Indiana since 2005.

                              c American Society for Engineering Education, 2021
Work in Progress: Assessment of Automation Labs to Facilitate Continuous
                                  Improvement
Abstract
With the implementation of new equipment and laboratory activities in an automation course, it
is desired to assess the effectiveness of the equipment and labs so that improvements may be
made. This paper covers the assessment methods used and the results to date.
New Programmable Logic Controller (PLC) trainers have been introduced in SCADA
(Supervisory Control and Data Acquisition) Systems Design. The labs for this course have either
been modified or new ones created to work with the new equipment. To objectively assess the
effectiveness of the equipment and laboratory activities, pre- and post-lab surveys are
administered to the students. Students are surveyed about their understanding of the various
objectives of the labs. The survey results, along with direct assessment data in the form of lab
scores, are used to identify areas of improvement for the equipment and the labs.

Introduction
In the fall of 2020, a new PLC trainer was introduced to SCADA Systems Design, which
required several labs to be modified or replaced with new ones. Surveys administered to the
students and lab scores were used to assess the effectiveness of the equipment and the labs [1],
[2]. The objectives of the labs formed the basis of the survey questions. The survey results are
used to identify areas of improvement.

Course
ENGR 382 SCADA (Supervisory Control and Data Acquisition) Systems Design is an upper-
division course taught to students in the Engineering Department as an elective or required
course, depending upon the program. The following are the course learning outcomes:
   1.      Understand common Industrial Automation concepts, methods, and control
           algorithms.
   2.      Understand sensors and actuators used in Industrial Automation tasks.
   3.      Design Piping & Instrumentation Diagrams (P&IDs) for simple process systems.
   4.      Measure process variables in response to process parameters and analyze the resulting
           process behavior.
   5.      Understand Programmable Logic Controller (PLC) components, signal interface
           methods, and applications.
   6.      Design and write PLC control programs. Recognize other control program language
           formats defined in the IEC 61131-3 standard.
   7.      Design and program suitable Human Machine Interface systems.
   8.      Understand common industrial networking topologies, protocols, and hardware.
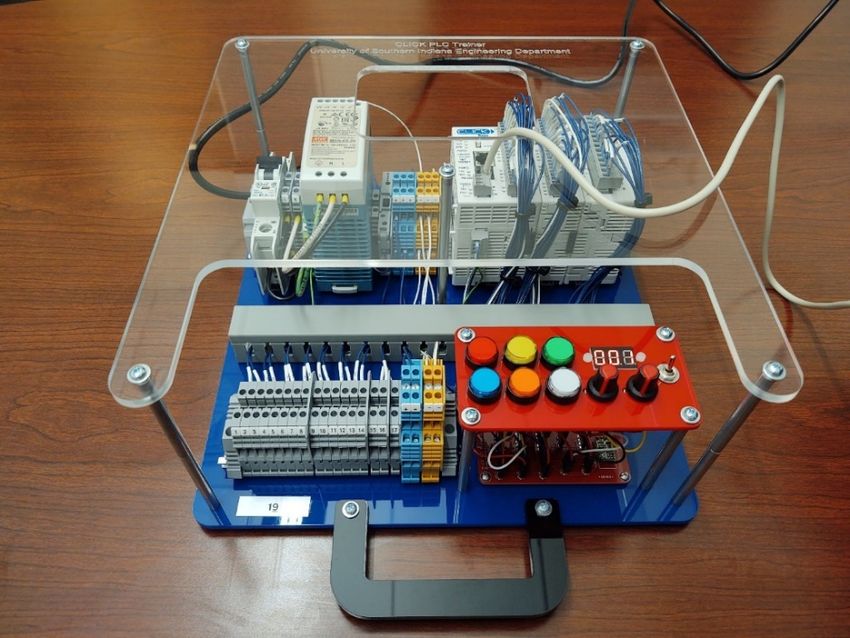
Course learning outcomes one, five, and six are related to PLC programming.
The course has the following laboratory activities:
   •   Lab 1: Automation Device Specifications
   •   Lab 2: CLICK Programming Software Introduction
   •   Lab 3: Basic Ladder Logic Programming
   •   Lab 4: Sequential Programming and Looping
   •   Lab 5: Car Lot Management System
   •   Lab 6: Stop Lights
   •   Lab 7: LabVIEW
   •   Lab 8: Analog I/O
   •   Lab 9: Analog Calculator
   •   Lab 10: Reaction Timer
   •   Lab 11: Process Trainer Closed-Loop Control
   •   Lab 12: Process Control System Design
Seven of twelve laboratory activities use the new PLC Trainer (Lab 1, Lab 2, Lab 7, Lab 11, and
Lab 12 do not). See the Appendix for the labs referenced by this paper.

PLC Trainer
The PLC trainer (see Figure 1) used for this course is based around an AutomationDirect CLICK
PLC, a 16-point discrete input module, and 8-point relay output module [3]. There are six lighted
momentary pushbuttons, two potentiometers (connected to analog inputs), and a voltmeter
(connected to an analog output).

Figure 1: CLICK PLC Trainer
Methods
Blackboard is the learning management system used by our university. The surveys used for this
assessment were administered in Blackboard. For each lab being assessed, a pre-lab survey is
administered to the students. Completing the survey makes the lab available using adaptive
release in Blackboard. Submitting the lab assignment to Blackboard makes the post-lab survey
available. The surveys consist of Likert Scale questions about the objectives of the lab and a
place for students to make comments about the lab. Note that for a given lab, the pre- and post-
lab survey questions are the same.
Since the surveys are Blackboard surveys, this means that they are anonymous. Thus, the pre-
and post-lab survey cannot be paired. Since the data are non-parametric (see Shapiro-Wilk
Normality Test results in the appendix) and that the pre- and post-lab data cannot be paired, the
Wilcoxon Ranked Sum Test is used to test differences between the pre- and post-lab data to a
95% confidence level [4], [5]. Box plots for each lab are prepared.
R is used for the Schapiro-Wilk Normality Test and for the Wilcoxon Ranked Sum Test.
Microsoft® Excel® is used to prepare the box plots.
The Likert Scale results are mapped to numeric scores per Table 1.
 Result                           Score
 Strongly Agree                        2
 Agree                                 1
 Neither Agree nor Disagree            0
 Disagree                             -1
 Strongly Disagree                    -2
Table 1: Likert Scale Result to Score Mapping
The hypothesis is that the post-lab survey values are greater than the pre-lab survey values.

Results and Discussion
For each lab, the survey questions are presented, box plots of the data by question, box plots for
the combined question data, a table of the Wilcoxon Ranked Sum Test results, and the comments
entered by students. Note that comments were not asked for until Lab 5.
A discussion of results follows each lab’s results.
Following the survey data is direct assessment data in the form of scores on the labs. For a direct
assessment item, success is defined as the average student performance being greater than 70%.
The labs assessed indirectly and directly are Lab 3 to Lab 6 and Lab 8 to Lab 10. The other labs
in the course did not involve the new PLC trainer.
The normality test results are found in the Appendix.
The number of responses per survey question are found in the Appendix.
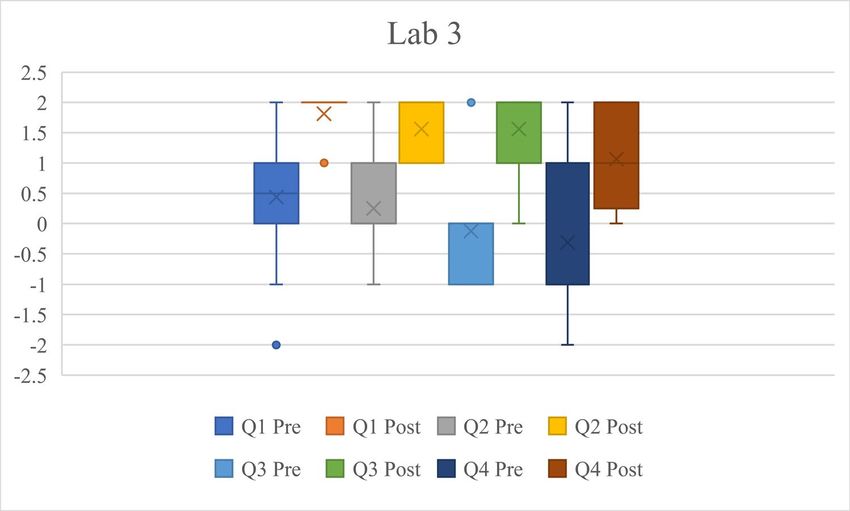
The data is from fall 2020 and the number of students enrolled in the class was sixteen.

Lab 3
Questions:
Q1: I feel confident in using the CLICK Programming Software to create simple ladder logic
programs.
Q2: I understand how logic gates as implemented in ladder logic work.
Q3: I am able to translate a Boolean expression into a ladder logic program.
Q4: I understand what a seal in and a seal breaker are.
Figure 2 shows the box plots of pre- and post-lab survey questions and Figure 3 shows the box
plots of the combined pre- and post-lab data.

Figure 2: Lab 3 Box Plots for Q1 to Q4 Pre- and Post-Lab Survey Results
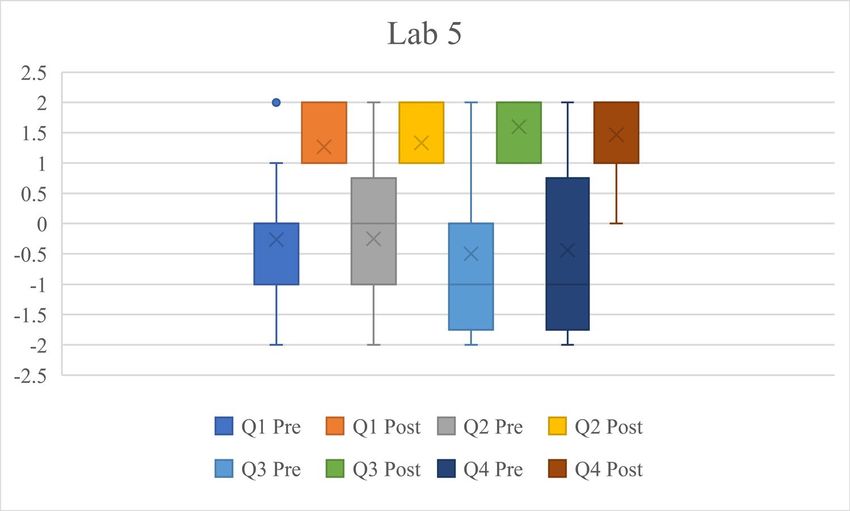
Figure 3: Lab 3 Box Plots for Combined Pre- and Post-Lab Survey Results
Table 2 lists the Wilcoxon Ranked Sum Test p-values.
 Q1                  < .001
 Q2                  < .001
 Q3                  < .001
 Q4                  < .001
 Combined            < .001
Table 2: Lab 3 Wilcoxon Ranked Sum Test p-values
Comments were not asked for in either the Pre-Lab or Post-Lab surveys.
While the p-values indicate that it is likely that post-lab scores are higher than the pre-lab ones,
box plots for question 4 (I understand what a seal in and a seal breaker are) indicate that the pre-
and post-lab survey scores are not statistically different.
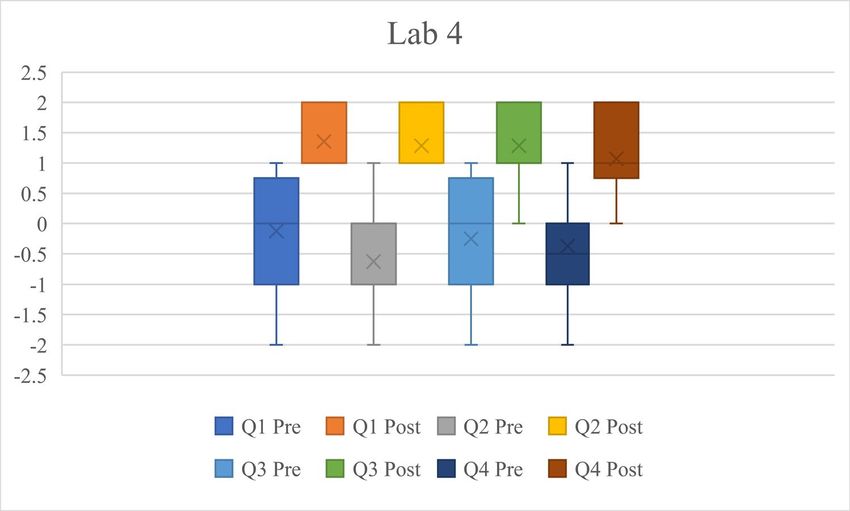
Lab 4
Questions
Q1: I understand how to initialize variables in a ladder logic program.
Q2: I understand how to use an on-delay timer in a ladder logic program.
Q3: I understand how to create a sequential ladder logic program to automate a set of steps.
Q4: I understand how to create a sequential ladder logic program that loops.
Figure 4 shows the box plots of pre- and post-lab survey questions and Figure 5 shows the box
plots of the combined pre- and post-lab data.

Figure 4: Lab 4 Box Plots for Q1 to Q4 Pre- and Post-Lab Survey Results

Figure 5: Lab 4 Box Plots for Combined Pre- and Post-Lab Survey Results
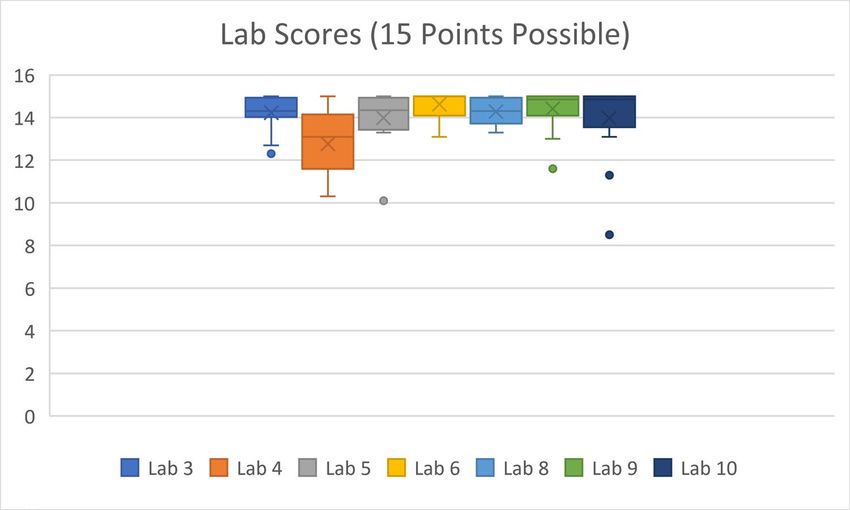
Table 3 lists the Wilcoxon Ranked Sum Test p-values.
 Q1                  < .001
 Q2                  < .001
 Q3                  < .001
 Q4                  < .001
 Combined            < .001
Table 3: Lab 4 Wilcoxon Ranked Sum Test p-values
Comments were not asked for in either the Pre-Lab or Post-Lab surveys.
Both the p-values and the box plots indicate that it is likely that post-lab scores are higher than
the pre-lab ones.
Lab 5
Questions
Q1: I understand how to use counters in a ladder logic program.
Q2: I understand how to use n copy instructions in a ladder logic program.
Q3: I understand how to use basic math instructions in a ladder logic program.
Q4: I understand how to use comparison instructions in a ladder logic program.
Figure 6 shows the box plots of pre- and post-lab survey questions and Figure 7 shows the box
plots of the combined pre- and post-lab data.

Figure 6: Lab 5 Box Plots for Q1 to Q4 Pre- and Post-Lab Survey Results

Figure 7: Lab 5 Box Plots for Combined Pre- and Post-Lab Survey Results
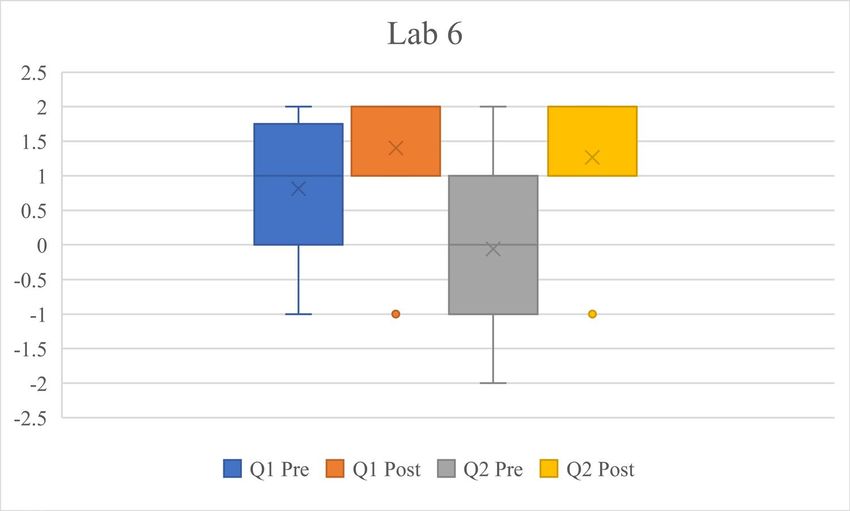
Table 4 lists the Wilcoxon Ranked Sum Test p-values.
 Q1                  < .001
 Q2                  < .001
 Q3                  < .001
 Q4                  < .001
 Combined            < .001
Table 4: Lab 5 Wilcoxon Ranked Sum Test p-values
Pre-Lab Survey Comments:
   •   Satisfied with the lab process.
Post-Lab Survey Comments:
   •   I can build the system and apply these techniques, but I'm not sure they will 100% work
       the way intended.
   •   Challenging Lab but helpful
Both the p-values and the box plots indicate that it is likely that post-lab scores are higher than
the pre-lab ones.
Lab 6 Questions Q1: I understand how to design a ladder logic program from a set of requirements. Q2: I understand how to create a ladder logic program using advanced sequential programming techniques. Figure 8 shows the box plots of pre- and post-lab survey questions and Figure 9 shows the box plots of the combined pre- and post-lab data. Figure 8: Lab 6 Box Plots for Q1 to Q2 Pre- and Post-Lab Survey Results Figure 9: Lab 6 Box Plots for Combined Pre- and Post-Lab Survey Results
Table 5 lists the Wilcoxon Ranked Sum Test p-values.
Q1 .0263
Q2 .0031
Combined .0064
Table 5: Lab 6 Wilcoxon Ranked Sum Test p-values
Pre-Lab Survey Comments:
• Have read the Advanced Sequential Programming and gained a better understanding.
Post-Lab Survey Comments:
• Good Lab
• I enjoy trying to figure these labs out. I usually try nontraditional approaches since all of
this is new to me, but once I get a push in the right direction it usually makes sense.
While the p-values indicate that it is likely that post-lab scores are higher than the pre-lab ones,
box plots for question 1 (I understand how to design a ladder logic program from a set of
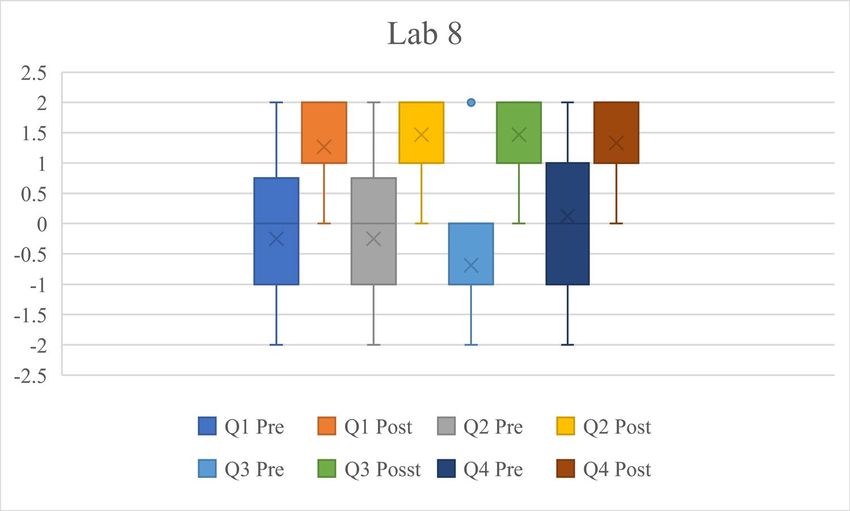
requirements) indicate that the pre- and post-lab survey scores are not statistically different.Lab 8 Questions Q1: I understand how to set up analog inputs and outputs on a PLC. Q2: I understand how to use analog inputs and outputs in a ladder logic program. Q3: I understand how to use floating-point values in a ladder logic program. Q4: I understand how to translate requirements into a ladder logic program. Figure 10 shows the box plots of pre- and post-lab survey questions and Figure 11 shows the box plots of the combined pre- and post-lab data. Figure 10: Lab 8 Box Plots for Q1 to Q4 Pre- and Post-Lab Survey Results Figure 11: Lab 8 Box Plots for Combined Pre- and Post-Lab Survey Results
Table 6 lists the Wilcoxon Ranked Sum Test p-values.
 Q1                  < .001
 Q2                  < .001
 Q3                  < .001
 Q4                   .0013
 Combined            < .001
Table 6: Lab 8 Wilcoxon Ranked Sum Test p-values
Pre-Lab Survey Comments:
   •   Expecting to improve these skills during lab.
Post-Lab Survey Comments:
   •   This lab has increased my knowledge and experience in PLC ladder logic programming.
Both the p-values and the box plots indicate that it is likely that post-lab scores are higher than
the pre-lab ones.
Lab 9
Questions
Q1: I understand how to use subroutines in a ladder logic program.
Figure 12 shows the box plots of pre- and post-lab survey question. Since this lab only has one
survey question, there are no combined data box plots.
Figure 12: Lab 9 Box Plots for Q1 Pre- and Post-Lab Survey Results
Table 7 lists the Wilcoxon Ranked Sum Test p-value.
Q1 < .001
Table 7: Lab 9 Wilcoxon Ranked Sum Test p-value
Pre-Lab Survey Comments:
• Expecting to expand experience on using subroutines in a ladder logic program.
Post-Lab Survey Comments:
• I enjoyed this lab. I'm not sure what about it made me enjoy it more than others, but it
was a fun lab and I didn't ever feel lost like I have with a few of the other labs.
• I have a much better understanding of the use of subroutines and their advantages.
Both the p-value and the box plots indicate that it is likely that post-lab scores are higher than the
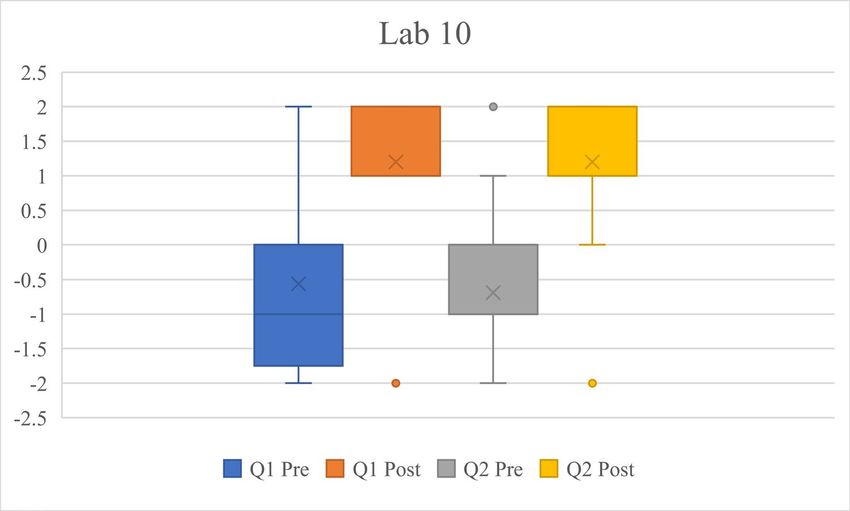
pre-lab ones.Lab 10 Questions Q1: I understand how to use edge contacts in a ladder logic program. Q2: I understand how to generate pseudo-random numbers. Figure 13 shows the box plots of pre- and post-lab survey questions and Figure 14 shows the box plots of the combined pre- and post-lab data. Figure 13: Lab 10 Box Plots for Q1 to Q2 Pre- and Post-Lab Survey Results Figure 14: Lab 10 Box Plots for Combined Pre- and Post-Lab Survey Results
Table 8 lists the Wilcoxon Ranked Sum Test p-values.
 Q1                  < .001
 Q2                  < .001
 Combined            < .001
Table 8: Lab 10 Wilcoxon Ranked Sum Test p-values
Pre-Lab Survey Comments:
   •   I expect to learn more about edge contacts and pseudo random numbers.
Post-Lab Survey Comments:
   •   Had a lot of trouble with this lab, not sure how to do the MOD or input a rising edge
       contact. Also had trouble with the internal time clock and using that within the logic
       program.
   •   Good lab
   •   I'm slowly getting better at this! I talked to my advisor Dr. McDonald about the
       possibility of a SCADA 2 class, as these topics really interest me.
Both the p-values and the box plots indicate that it is likely that post-lab scores are higher than
the pre-lab ones.

Direct Assessment – Lab Scores
Box plots of lab scores are shown in Figure 15 and score averages by lab are show in Table 9.
The number of points possible for each lab is fifteen and n = 16 for each lab.

Figure 15: Box Plots of Lab Scores
Lab 3 4 5 6 8 9 10 Average 94.9% 85.1% 93.3% 97.5% 95.2% 96.1% 93.1% Table 9: Averages of Lab Scores Since the average on every lab is greater than 70%, the success criterion is satisfied for each lab and this data does not suggest the need for any improvements in the labs. Conclusions Based on the p-values, box plots, and lab score averages, most of the labs do not appear to require changes to improve effectiveness. Lab 3 The survey box plots for Lab 3 would indicate that improvements need to be made. The material used to teach the concepts of “seal in” and “seal breaker” need to be improved by adding a step- by-step example of how the seal in and seal breaker work. Lab 6 The survey box plots for Lab 6 would indicate that improvements need to be made. The example used to show how to design a ladder logic program from a set of requirements needs to be improved by expanding the document to illustrate how elements of the written requirements correspond to ladder logic structures. Lab 10 From the comments, one student had trouble with the modulus operator and edge contacts in Lab 10. The description of the modulus operator in the lab document needs an example added and the lecture material on edge contacts needs an illustration to show signal behavior over time. Surveys As far as methods go, the surveys need to be changed away from anonymous ones so that pre- and post-lab survey data may be paired. This would also allow pairing with direct assessment data. Acknowledgements I thank Dr. Tom McDonald for providing invaluable advice on statistical analysis for this paper.
References
[1] C. Habibi and D Fieschko, “PLC Training in a First-year Electrical Engineering Program,” in
2020 ASEE Virtual Annual Conference, June 22, 2020 [Online]. Available:
https://peer.asee.org/35060. [Accessed: 10 Oct. 2020]
[2] B. Smyser, “Voice of the Students: Continuous Lab Course Improvement Using Student
Feedback,” in 2018 ASEE Annual Conference & Exposition, June 23, 2018 [Online]. Available:
https://strategy.asee.org/31228. [Accessed: 10 Oct. 2020]
[3] “CLICK Series Programmable Controllers,” AutomationDirect. [Online]. Available:
https://www.automationdirect.com/adc/overview/catalog/programmable_controllers/click_series
_plcs. [Accessed: 28 Feb. 2021].
[4] “Unpaired Two-Samples Wilcoxon Test in R,” STHDA. [Online]. Available:
http://www.sthda.com/english/wiki/unpaired-two-samples-wilcoxon-test-in-r. [Accessed: 25 Jan.
2021]
[5] D. Levine, D. Stephan, and K. Szabat, Statistics for Managers Using Microft® Excel, 7th Ed.
Upper Saddle River, NJ: Pearson, 2014, pp. 448-452.
Appendix
The Appendix contains a summary of survey response numbers, the test results for the Shapiro-
Wilk Normality tests of the survey data, and the labs referenced by this paper in their entirety.

Summary of Survey Response Numbers
Table 10 provides a summary of the number of responses each question on each survey received.
There were 16 students in the class.
 Lab    Survey       Q1       Q2       Q3      Q4
        Pre           16      16        16     16
 3
        Post          16      16        16     16
        Pre           16      16        16     16
 4
        Post          14      14        14     14
        Pre           15      16        16     16
 5
        Post          15      15        15     15
        Pre           16      16
 6
        Post          15      15
        Pre           16      16        16     16
 8
        Post          15      15        15     15
        Pre           16
 9
        Post          14
        Pre           16      16
 10
        Post          15      15
Table 10: Number Survey Responses Received by Question
Shapiro-Wilk Normality Test Results
Table 11 lists p-values for the test for normality of the data using the Shapiro-Wilk Normality
Test for the survey data.
Lab Survey Q1 Q2 Q3 Q4 Combined
Pre .0715 .0202 < .001 .0434 < .001
3
Post < .001 < .001 < .001 .0049 < .001
Pre .0356 .0362 .0316 .0271 < .001
4
Post < .001 < .001 .0021 .0093 < .001
Pre .2465 .2547 .0408 .0520 < .001
5
Post < .001 < .001 < .001 < .001 < .001
Pre .0415 .0898 .0012
6
Post < .001 < .001 < .001
Pre .2547 .2547 .0024 .2679 < .001
8
Post .0035 < .001 < .001 .0014 < .001
Pre .0749 .0749
9
Post < .001 < .001
Pre .0996 .0141 .0016
10
Post < .001 < .001 < .001
Table 11: Normality Test p-valuesLabs The labs referenced in this paper are provided below in their entirety (three to six and eight to ten). Lab 3: Basic Ladder Logic Programming Name: Date: Objectives 1. Demonstrate the ability to create simple ladder logic programs. 2. Demonstrate understanding of how logic gates are implemented in ladder logic. 3. Translate a Boolean expression into rungs in a ladder logic program. 4. Demonstrate understanding of the seal in and the seal breaker. References Ch. 21 Introduction to Programmable Controllers Ch. 22 Fundamental PLC Programming CLICK Programming Software – Getting Started AutomationDirect C0-USER-M User Manual AutomationDirect CLICK Programming Software Help File Equipment CLICK PLC Trainer Programming Cable PC with CLICK Programming Software Thumb Drive or Cloud Storage Procedure For each part below, create a new project. Name your project files as “Lab3-.ckp”. For Part 1, the project name will be “Lab3-1.ckp”. Create a PDF (print to PDF) of each ladder logic program named “Lab3-.pdf”. For Part 1, the PDF name will be “Lab3-1.pdf”. For Parts 1, 2, and the Bonus, use the nicknames defined in Table 1. The nicknames for Part 3 are defined in that section.
Address Nickname
 X101        A
 X103        B
 X105        C
 Y201        Out1
 Y202        Out2
 Y203        Out3
 Y204        Out4
 Y205        Out5
Table 1: Nicknames
For the truth tables, use the values 0 and 1, where 0 indicates the output is off and 1 indicates that
it is on.
Part 1 – Logic Gates
As we learned in the lecture, digital logic gates can be implemented in ladder logic. You will
create a ladder logic program with rungs that implement NOT, OR, NOR, AND, and NAND and
then fill in the truth table for each of logic gates.
Create the ladder logic program shown in Figure 1. Use the nicknames defined previously and
create rung comments as shown in Figure 1.

Figure 1: Logic Gates in Ladder Logic
Write your project to the PLC, test all input conditions, and fill in the truth tables (Tables 2 to 6).
A Out1
 0
 1
Table 2: NOT Truth Table
 A B Out2
 0 0
 0 1
 1 0
 1 1
Table 3: OR Truth Table
 A B Out3
 0 0
 0 1
 1 0
 1 1
Table 4: NOR Truth Table
 A B Out4
 0 0
 0 1
 1 0
 1 1
Table 5: AND Truth Table
 A B Out5
 0 0
 0 1
 1 0
 1 1
Table 6: NAND Truth Table
Part 2 – OR/AND Combinations
Create a ladder logic program with two rungs. The first rung must implement the Boolean
expression:
Out1 = A OR (B AND C)
The parentheses indicate the precedence of the operations. In the first rung, B and C must be
ANDed together and then the result is ORed with A.
The second rung must implement the Boolean expression:
Out2 = A AND (B OR C)
Use the Boolean expressions as the rung comments in the program.
Write your project to the PLC, test all input conditions, and fill in the truth tables (Tables 7 to 8).
 A B C Out1
 0 0 0
 0 0 1
 0 1 0
 0 1 1
 1 0 0
 1 0 1
 1 1 0
 1 1 1
Table 7: Rung 1 Truth Table
 A B C Out2
 0 0 0
 0 0 1
 0 1 0
 0 1 1
 1 0 0
 1 0 1
 1 1 0
 1 1 1
Table 8: Rung 2 Truth Table
Part 3 – Start/Stop Logic
For this program, use the nicknames in Table 9.
 Address Nickname
 X105       Start
 X102       Stop
 Y206       Motor
Table 9: Nicknames
Identify the input/output devices being used in the program. For the pushbuttons, identify the
color and if it is normally open (NO) or normally closed (NC). For the LED, identify the color.
Complete Table 10 with this information.
 Nickname Input/Output
              Device
 Start
 Stop
 Motor
Table 10: Input/Output Devices
Create the ladder logic program shown in Figure 2. Use the nicknames defined in Table 9 and
create the rung comment as shown in Figure 2. Verify program operation to start and stop the
motor.
Figure 2: Motor Start/Stop Program Identify the following program elements: seal in and seal breaker. Complete Table 11 with the nicknames. Program Element Nickname Seal In Seal Breaker Table 11: Program Elements Deliverables Submit the following to Blackboard under the appropriate lab assignment: • Edited lab document. • Project and PDF files for all parts of the lab. Lab 4: Sequential Programming and Looping Name: Date: Objectives 1. Create a ladder logic program with initialization of a variable. 2. Create a ladder logic program using an on-delay timer. 3. Create a sequential ladder logic program to automate a set of steps. 4. Create sequential ladder logic program that loops. References Sequential Programming and Looping CLICK Programming Software – Getting Started AutomationDirect C0-USER-M User Manual
AutomationDirect CLICK Programming Software Help File
Equipment
CLICK PLC Trainer
Programming Cable
PC with CLICK Programming Software
Thumb Drive or Cloud Storage
Procedure
For each part below, create a new project. Name your project files as “Lab4-.ckp”. For
Part 1, the project name will be “Lab4-1.ckp”.
Create a PDF (Microsoft Print to PDF) of each ladder logic program named “Lab4-.pdf”.
For Part 1, the PDF name will be “Lab4-1.pdf”. Use the “letter” size and “landscape” orientation.
Each rung of the program must have a descriptive comment to document its behavior.
Demonstrate each of your programs to your instructor.
Answer the questions for each part in this document.
Part 1 – Sequential Program
Create nicknames for the following:
 Address Tag
 X105       Start
 X102       Stop
 Y201       Step1
 Y202       Step2
 Y203       Step3
 Y204       Step4
 Y205       Step5
 Y206       Step6
 T1         Step1Done
 T2         Step2Done
 T3         Step3Done
 T4         Step4Done
 T5         Step5Done
 T6         Step6Done
 C1         Done
 DS1        Timeout
Table 1: Nicknames
Create a sequential program with six steps and a done state.
Each step must last for 1.5 seconds.
Setpoints for all timers must be set to the Timeout data register.
Initialize Timeout upon first scan of the ladder logic program (see system coil relay SC2).
Use the On-Delay timer to provide the timing of each step (one timer for each step).
The completion of the timer for a step must cause the next step to start. The completion of the
timer represents an event that signals that a particular step has completed.
Only one step may run at a time.
Go to the Done state after Step 6 is done.
The Start button must start Step 1 going.
The Stop button must stop any and all steps from going (including the Done state).
Download your program to the PLC and monitor it.
Demonstrate your program to the instructor.
Q1: What time base did you use for your timers?
A1:
Q2: What value did you use for Timeout?
A2:
Q3: Why would you want the ability to stop a PLC program?
A3:
Part 2 – Looping
Make a copy of your Part 1 project file and rename it for Part 2.
Modify the program so it will loop. That is, when Step 6 completes, Step 1 must start again.
The Done state is not needed.
Only one step may run at a time.
The Start button must start Step 1 going.
The Stop button must stop any and all steps from going.
Download your program to the PLC and monitor it.
Demonstrate your program to the instructor.
Q4: What did you have to do to the program for Part 2 to make it loop?
A4:
Q5: Why would you want a ladder logic program to loop?
A5:
Deliverables
Submit the following to Blackboard under the appropriate lab assignment:
      •    A text or Word document with the title “Lab 4”, your name, and the answers to the
           questions (A1 to A5).
      •    Project and PDF files for all parts of the lab.

Lab 5: Car Lot Management System
Name:
Date:
Objectives
      1.   Create a ladder logic program using counters.
      2.   Create a ladder logic program using copy instructions.
      3.   Create ladder logic program using basic math instructions.
      4.   Create a ladder logic program using comparison instructions.
References
CLICK Programming Software – Getting Started
AutomationDirect C0-USER-M User Manual
AutomationDirect CLICK Programming Software Help File
Equipment
CLICK PLC Trainer
Programming Cable
PC with CLICK Programming Software
Thumb Drive or Cloud Storage
Procedure
Create a new project named “Lab5.ckp”.
Review and analyze the requirements for a control system that manages a car lot.
Design the control system.
Create and test the control system.
Each rung of the program must have a descriptive comment to document its behavior. Demonstrate your program to your instructor. Create a PDF (Microsoft Print to PDF) of the ladder logic program named “Lab5.pdf”. Problem Statement You are to design and implement a system to manage a car lot of a given size. Pushbuttons will be used to indicate when a car enters or leaves the lot. The system will keep track of information about the current state of the lot. The system must be designed based on the requirements given below. Requirements Provide the following control relays (internal bits): lot full and lot empty. Provide the following data registers: number of cars, number of (empty) spaces, total number of cars, and lot size. The car lot has a size of 10 cars. This variable should be initialized upon the first scan of the program. Provide the following pushbuttons: car enters lot, car leaves lot, and reset counters. Provide a lamp to indicate when the lot is full. Start with the lot empty (initialized upon first scan of the program). Use a counter to keep track of the number of cars on the lot. Set point = 0. Use a counter to keep track of the total number of cars that have been in the lot since the last reset. Set point = 0. Use copy instructions to copy the number of cars and the total number of cars from the counters into data registers. If the lot becomes full, prevent more cars from entering the lot (the current value of the counter must not go above the lot size). Prevent the current number of cars on the lot to go below zero (number of spaces must not go above lot size). Design Complete Table 1 with the addresses that will be used by your program. Add rows as needed. The counters do not need nicknames.
Address Nickname Description
            Inputs

                Outputs

     Control Relays (Internal Bits)

             Data Registers

               Counters

Table 1: Memory Usage
Deliverables
Submit the following to Blackboard under the appropriate lab assignment:
     •   A Word document with the title “Lab 5”, your name, and Table 1.
     •   Project and PDF files your ladder logic program.

Lab 6: Stop Lights
Name:
Date:
Objectives
1.       Design a ladder logic program from a set of requirements.
2.       Create a ladder logic program using advanced sequential programming techniques.
References
Sequential Programming and Looping
Advanced Sequential Programming
CLICK Programming Software – Getting Started
AutomationDirect C0-USER-M User Manual
AutomationDirect CLICK Programming Software Help File
Equipment
CLICK PLC Trainer
Programming Cable
PC with CLICK Programming Software Thumb Drive or Cloud Storage Procedure Create a new project named “Lab6.ckp”. Review and analyze the requirements for a control system that operates a stop light. Design the control system. Create and test the control system. Each rung of the program must have a descriptive comment to document its behavior. Demonstrate your program to your instructor. Create a PDF (Microsoft Print to PDF) of the ladder logic program named “Lab6.pdf”. Use the “letter” size and “landscape” orientation. Problem Statement You are to create a system that controls stop lights at an intersection. One set of lights controls traffic going North/South and the other set controls traffic going East/West. Table 1 shows the sequence for the lights where each row represents two seconds. N/S E/W Green Red Green Red Green Red Yellow Red Red Red Red Green Red Green Red Green Red Yellow Red Red Table 1: Sequence for the North/South and East/West Stop Lights Since we will be using the CLICK PLC Trainer, the East/West lights will be the blue, orange, and white LEDs where: Red = Blue, Yellow = Orange, and Green = White. Requirements Select normally open push buttons to start and stop the system. All six LEDs will be used for the stop lights as described in the Problem Statement. Apply the advanced sequential programming techniques to create a system that implements the sequence in Table 1 that, once started, loops until stopped.
The number of steps must be minimized and therefore the number of timer set points is also
minimized. Hint: This can be done with only six steps and three set point times.
Pressing the Start button must start the sequence at the top of Table 1.
Pressing the Stop button must stop all steps from running.
Timer set points must be initialized upon the first scan of the program.
Design
Complete Table 2 with the addresses that will be used by your program. Add rows as needed.
 Address Nickname Description
            Inputs

                Outputs

   Control Relays (Internal Bits)

             Data Registers

                 Timers

Table 2: Memory Usage
It is suggested that the LED outputs be named the same as their color. The timers must have
nicknames.
Deliverables
Submit the following to Blackboard under the appropriate lab assignment:
   •     A Word document with the title “Lab 6”, your name, and Table 2.
   •     Project and PDF files for your ladder logic program.

Lab 8: Analog I/O
Name:
Date:
Objectives
   1.    Set up analog inputs and outputs on a PLC.
   2.    Use analog inputs and outputs in a ladder logic program.
   3.    Use floating-point data values in a ladder logic program.
   4.    Translate requirements into a ladder logic program.
References CLICK Programming Software – Getting Started AutomationDirect C0-USER-M User Manual AutomationDirect CLICK Programming Software Help File Equipment CLICK PLC Trainer Programming Cable PC with CLICK Programming Software Thumb Drive or Cloud Storage Procedure Create a new project named “Lab8.ckp”. Review and analyze the requirements for the program. Design the program. Create and test the program. Each rung of the program must have a descriptive comment to document its behavior. Demonstrate your program to your instructor. Create a PDF (Microsoft Print to PDF) of the ladder logic program named “Lab8.pdf”. Use the “letter” size and “portrait” orientation. Setting Up Analog I/O To set up analog inputs and outputs on the PLC, go to Setup -> CPU Built-in I/O Setup. On the Input tab, you can set the scaled range values for the analog inputs as well as see the floating- point data registers assigned to the inputs. On the Output tab, you can set the scaled range values for the analog outputs as well as see the floating-point data registers assigned to the outputs. Problem Statement You are to write a ladder logic program that uses analog inputs and an analog output. The analog inputs will be compared to thresholds to determine when LEDs should be on. The analog output will be driven by one of the analog inputs. One of the analog inputs will be monitored for an error condition. Table 1 lists the inputs and outputs.
Device Signal Name      Nickname                            Notes
 POT1                    Sensor 1  Nickname applies to the floating-point register for the
                                   input
 POT2                    Sensor 2  Nickname applies to the floating-point register for the
                                   input
 V_METER                 Driver 1  Nickname applies to the floating-point register for the
                                   output
 WHT_NO                  Reset
 RED_LED                 High LED
 YEL_LED                 Med LED
 GRN_LED                 Low LED
Table 1: System Inputs and Outputs
Requirements
All constants must be stored in data registers that are initialized upon the first scan of the
program.
Unless otherwise specified, all addresses must have nicknames assigned to them.
The white normally open push button is the only one that is required.
The Low, Medium, and High conditions must be stored in control relays (internal bits).
Sensor 1/Driver 1
Set up the Sensor 1 analog input for values from 0.0 to 100.0.
Set up the Driver 1 analog output for values from 0.0 to 100.0.
Copy the value for Sensor 1 to Driver 1 (POT1 will determine the value for V_METER).
The Medium condition must be true if the Sensor 1 value is between 45.0 and 55.0.
The yellow LED must be on if the Medium condition is true.
Sensor 2
Set up the Sensor 2 analog input for values from 0.0 to 100.0.
The Low condition must be true if the Sensor 2 value is less than 25.0.
The High condition must be true of the Sensor 2 value is greater than 75.0.
The green LED must be on if the Low condition is true.
Each time the High condition becomes true, the High condition count must be incremented.
Sensor 2 is considered in error if the High condition count is 5 or greater.
The red LED must be on if the High condition is true and Sensor 2 does not have an error.
If Sensor 2 is considered in error, then the red LED must blink at a one second rate.
Hint: SC7 (_1sec_Clock) is a system control relay that goes on/off at a one second rate.
Pressing the Reset push button must reset the High condition count.
Design
Complete Table 2 with the addresses and nicknames that will be used by your program. Add
rows as needed.
Address Nickname Description
Digital/Analog Inputs
Digital/Analog Outputs
Control Relays (Internal Bits)
Integer/Floating Point Data Registers
Counters/Current Values
Table 2: Memory Usage
The analog inputs and output do not need nicknames, but their associated data registers do. Both
the counter and its current value need nicknames.
Deliverables
Submit the following to Blackboard under the appropriate lab assignment:
• A Word document with the title “Lab 8”, your name, and Table 2.
• Project and PDF files for your ladder logic program.
Lab 9: Analog Calculator
Name:
Date:
Objectives
1. Use subroutines in a ladder logic program.
References
CLICK Programming Software – Getting Started
AutomationDirect C0-USER-M User Manual
AutomationDirect CLICK Programming Software Help FileEquipment CLICK PLC Trainer Programming Cable PC with CLICK Programming Software Thumb Drive or Cloud Storage Procedure Create a new project named “Lab9.ckp”. Review and analyze the requirements for the program. Design the program. Create and test the program. Each rung of the program must have a descriptive comment to document its behavior. Demonstrate your program to your instructor. Note: It is recommended that you create a Data View with all variables used in your program so that they may be easily monitored. Create a PDF (Microsoft Print to PDF) of the ladder logic program named “Lab9.pdf”. Use the “letter” size and “portrait” orientation. Problem Statement You are to write a ladder logic program that uses subroutines to perform math functions (addition, subtraction, multiplication, division) on two numbers read from analog inputs and output the result to an analog output. Pressing a button copies the current values of the analog inputs into data registers so that the values of the two numbers can be checked to determine which math functions are permitted. A pushbutton is assigned to each math function and the LEDs in the pushbuttons indicate which math functions are permitted. Pressing a pushbutton will clear the values of the numbers and result. Analog I/O Setup The analog inputs are AD3 (POT1) and AD4 (POT2). The analog output is DA2 (V_METER). Use the default values of 0.0 to 100.0 for the analog inputs and outputs. Requirements All constants used by the program, except for the value 0, must be stored in data registers. Unless otherwise specified, all addresses must have nicknames assigned to them. Floating-point data registers for Num1, Num2, and Result must be used for the math operations. Table 1 lists the inputs and outputs.
Device Signal Name        Nickname                                 Notes
 POT1                      Num1 In           Nickname applies to the floating-point register for the
                                             input
 POT2                      Num2 In           Nickname applies to the floating-point register for the
                                             input
 V_METER                   Result Out        Nickname applies to the floating-point register for the
                                             output
 Normally open            Push
 pushbuttons of your      Add
 choice                   Subtract
                          Multiply
                          Divide
                          Clear
 LEDs for the Add,        Add Ok
 Subtract, Multiply,      Subtract Ok
 Divide pushbuttons       Multiply Ok
                          Divide Ok
Table 1: System Inputs and Outputs
Seven subroutines are required for the program. The main program will consist of rungs that call
the subroutines. The calling conditions and behavior are described below.
Initialize
Calling Conditions: First scan of program.
Behavior: Copy constants into data registers.
Clear
Calling Conditions: First scan of program or Clear pushbutton is pressed.
Behavior: Set Num1, Num2, and Result to 0.0.
Push
Calling Conditions: Push pushbutton is pressed.
Behavior: Copy Num1 In to Num1, copy Num2 In to Num2, and determine which math
operations are permitted (see Table 2).
 Math Operation       Permissible Conditions
 Addition             Num1 ≤ 50.0 and Num2 ≤ 50.0
 Subtraction          Num1 ≥ Num2
 Multiplication       Num1 ≤ 10.0 and Num2 ≤ 10.0
 Division             Num2 ≠ 0.0
Table 2: Permissible Conditions for Math Operations
The LED is on for each math operation pushbutton that is permissible based on the conditions in
Table 1.
Add
Calling Conditions: Add pushbutton is pressed and addition is permissible.
Behavior: Num1 and Num2 are added together and sum is written to Result. Result is copied to
analog output Result Out.
Subtract
Calling Conditions: Subtract pushbutton is pressed and subtraction is permissible.
Behavior: Num2 is subtracted from Num1 and difference is written to Result. Result is copied to
analog output Result Out.
Multiply
Calling Conditions: Multiply button is pressed and multiplication is permissible.
Behavior: Num1 and Num2 are multiplied together and product is written to Result. Result is
copied to analog output Result Out.
Divide
Calling Conditions: Divide button is pressed and division is permissible.
Behavior: Num2 is divided into Num1 and quotient is written to Result. Result is copied to
analog output Result Out.
Design
Complete Table 3 with the addresses and nicknames that will be used by your program. Add
rows as needed. Remove categories that are not needed.
Address Nickname Description
Digital/Analog Inputs
Digital/Analog Outputs
Control Relays (Internal Bits)
Integer/Floating Point Data Registers
Table 3: Memory Usage
The analog inputs and output do not need nicknames, but their associated data registers do.
Deliverables
Submit the following to Blackboard under the appropriate lab assignment:
• A Word document with the title “Lab 9”, your name, and Table 3.
• Project and PDF files for your ladder logic program.Lab 10: Reaction Timer Name: Date: Objectives 1. Use edge contacts in a ladder logic program. 2. Generate a pseudo-random number. References CLICK Programming Software – Getting Started AutomationDirect C0-USER-M User Manual AutomationDirect CLICK Programming Software Help File Equipment CLICK PLC Trainer Programming Cable PC with CLICK Programming Software Thumb Drive or Cloud Storage Procedure Create a new project named “Lab10.ckp”. Review and analyze the requirements for the program. Design the program. Create and test the program. Each rung of the program must have a descriptive comment to document its behavior. Demonstrate your program to your instructor. Note: It is recommended that you create a Data View with all variables used in your program so that they may be easily monitored. Create a PDF (Microsoft Print to PDF) of the ladder logic program named “Lab10.pdf”. Use the “letter” size and “landscape” orientation. Random Number Generator There are numerous methods of generating random numbers. Some techniques give true random number sequences (usually based on a physical phenomenon) while others are pseudo-random number sequences.
If you need random integers from 0 to 9, the system clock can be used as a source. The least
significant digit of the current number of seconds on the system clock can be isolated by
performing “seconds modulo 10”.
See Real-Time Clock and Modulo below.
Real-Time Clock
The CLICK PLC has a real-time clock that keeps track of the current date and time. The system
data registers in Table 1 provide access to the time.
 Address System Nickname Notes
 SD24      _RTC_Hour           0 to 23
 SD25      _RTC_Minute         0 to 59
 SD26      _RTC_Second         0 to 59
Table 1: CLICK System Data Registers for Real-Time Clock Current Time
See CLICK Software Manual (CLICK Help) for the system data registers for the date.
Modulo
The modulo finds the remainder of an integer division operation. This remainder is sometimes
called the modulus. The modulo operator is frequently abbreviated as mod. MOD is one of the
math operators available in the Math instruction.
Edge Contacts
There are two different edge contacts available: Rising Edge and Falling Edge. An edge contact
will be on (true) for one scan time when the bit addressed by contact has a rising or falling edge.
These contacts are referred to as one-shot instructions by some other PLCs.
Use an edge contact if you want some task to happen once when a bit changes value.
The Rising Edge contact is on (true) when the bit addressed by the contact goes from off (false)
to on (true). The contact stays on (true) for one scan time.
The Falling Edge contact is on (true) when the bit addressed by the contact goes from on (true) to
off (false). The contact stays on (true) for one scan time.
Problem Statement
You are to design a reaction timer where the system will light an LED a random amount of time
after the start button is pressed and it will determine how long it takes for the stop button to be
pressed after the LED lights up (the reaction time). If the stop button is not pressed within 5
seconds, the reaction timer stops.
Requirements
All constants used by the program must be stored in data registers and they must be initialized in
a subroutine.
Unless otherwise specified, all addresses must have nicknames assigned to them.
The required inputs are normally open Start and Stop pushbuttons. It is your choice which
pushbuttons to use.
The required output is an LED. It is your choice which LED to use.
There are three states that the system progresses through: Prep, Wait, and Go. When entering a
state, the previous state must end. Use sequential programming techniques to create the states.
Use control relays (internal bits) to represent the states.
Prep State
Pressing the Start pushbutton causes the Prep state to be entered. Upon first entering the Prep
state, the random wait time must be determined. You must use an edge contact to trigger the
math instruction to determine the wait time.
Wait State
Being in the Prep state causes the Wait state to be entered. While in the Wait state, the wait timer
must be running.
Go State
When the wait timer times out, the Go state must be entered. While in the Go state, the reaction
timer must be running, the LED must be on, and the current reaction timer value must be copied
to a data register (reaction time). The reaction timer must have a time base of 1 millisecond and
must have a 5 second setpoint. Pressing the stop button or reaching the reaction timer setpoint
must cause the Go state to be exited.
Design
Complete Table 2 with the addresses and nicknames that will be used by your program. Add
rows as needed. Remove categories that are not needed.
 Address       Nickname Description
               Digital Inputs

              Digital Outputs

     Control Relays (Internal Bits)

           Integer Data Registers

                  Timers

Table 2: Memory Usage
Deliverables Submit the following to Blackboard under the appropriate lab assignment: • A Word document with the title “Lab 10”, your name, and Table 2. • Project and PDF files for your ladder logic program.
You can also read