Work Package 5: Measuring non-market economic impacts of Climate Change
←
→
Page content transcription
If your browser does not render page correctly, please read the page content below
Work Package 5:
Measuring non-market economic impacts of Climate Change

 1
WORKING PACKAGE 5
 MEASURING MARKET AND NON-MARKET COSTS OF CLIMATE
 CHANGE AND BENEFITS OF CLIMATE ACTIONS FOR EUROPE

 Deliverable 5.3. Data Mining from Big Data Analysis.
Coordinated by UNIBO (Anastasia Arabadzhyan, Paolo Figini and Laura Vici) with the
participation of ULPGC and other SOCLIMPACT partners of WP5.

 Revised version – Version v2.0 (reviewed in line with comments outlined in the letter: Ref.
 Ares(2021)4638303 - 18/07/2021)

 Type of deliverable: R (Report)
 Confidentiality level: PU
Revision History

 Version Date Author Description
 v0.1 21.12.2019 A. Arabadzhyan Internal first draft
 v0.2 07.01.2020 L. Vici Internal second draft
 12.01.2020 P. Figini Final draft to be reviewed according to the quality review
 v0.3
 internal process
 31.01.2020 A. Arabadzhyan, P. Intermediate version
 v1.0
 Figini, L. Vici

 21.02.2020 A. Arabadzhyan, P. Final version to be submitted and published
 v1.1
 Figini, L. Vici

 v2.0 13.08.2021 P. Figini, L. Vici 1. An executive summary has been added at the beginning of
 the report (pp.4-5) to facilitate reading and better link D5.3
 with the other deliverables.
 2. A paragraph has been added in the Introduction (p. 6) to
 explain better that the report does not consider the other
 Blue Economy sectors but that the extension of this
 approach to other sectors is promising.
 3. Three paragraphs have been added at the end of Section 2
 (p. 10) to defend our approach and to firmly locate it within
 the boundaries of the socio-economic analysis of Big Data.
 4. A new section (Section 5.3) has been added at the end of
 the report (pp. 49-50) to wrap up the scientific discussion
 and recommend actions for future research.

 2
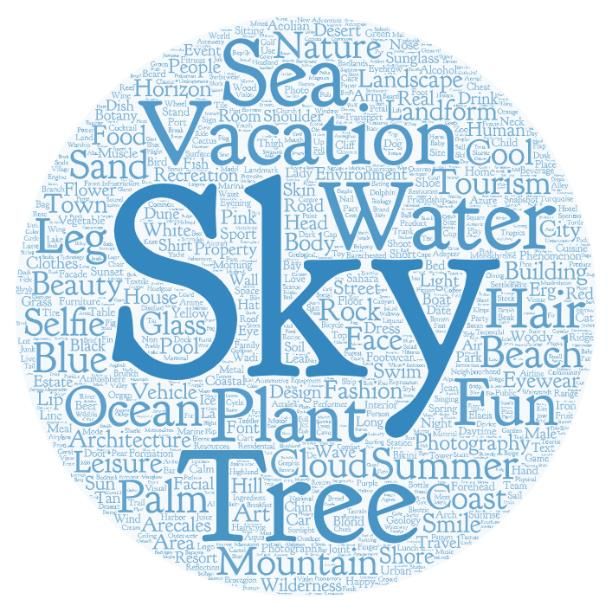
Table of Contents
0. Executive Summary ...........................................................................................................................4
1. Introduction .......................................................................................................................................6
2. Big Data: definition, classification, and applicability to the tourism sector .................................8
3. Methodology and Data ................................................................................................................... 11
 3.1. How do climate events impact accommodation prices? ...................................................... 12
 3.2. How do climate events impact destination image? .............................................................. 15
 3.3. How do climate events impact hotel performance? ............................................................. 19
4. Results ............................................................................................................................................. 23
 4.1. The impact of weather on prices........................................................................................... 23
 4.2. The impact of climate events on tourism quality and destination image............................. 26
 Case study: Wildfires on Canary Islands ............................................................................................ 33
 4.3. The impact of climate events on hotel performance ............................................................ 38
5. Discussion and Conclusions .......................................................................................................... 43
 5.1. Estimation of the economic impacts ..................................................................................... 43
 5.2. Summary and concluding remarks ........................................................................................ 47
 5.3 Scientific discussion and recommendations for future actions ............................................ 50
 References ......................................................................................................................................... 51
 Appendix............................................................................................................................................ 53

 3
0. Executive Summary This Report is the main outcome of Task 5.3, which aimed at experimenting with different types of large datasets related to the tourism sector and characterised by velocity, variety, and volume, hence sharing the typical properties of Big Data. The task’s main goal was to complement findings of WP5 collected through more established techniques (surveys and questionnaires) and methodologies (choice experiments). Within the allocated time, financial, and human resources, this task selected and pursued three different lines of investigation, aiming at tackling the following research questions: How do climate events (like heat waves or storms, proxied by weather conditions and forecasts) impact on accommodation prices? This analysis considered Corsica, Sardinia and Sicily. How do climate events impact on destination image and on the activities carried out by tourists in the destination? This analysis considered four islands of the Canary archipelago (Gran Canaria, Fuerteventura, Lanzarote and Tenerife) and four Mediterranean islands (Crete, Cyprus, Malta and Sicily). How do climate events (like forest fires) impact on hotel performance? This analysis considered Gran Canaria. Once estimations of impacts of specific events on prices, performance, and destination image were generated, climate change scenarios prepared by WP4 were used as inputs, thus allowing for the computation of the economic impact of climate change on the tourism sector (measured in terms of variation in yearly tourism expenditure), to be later transferred to WP6. Findings show that: A one-degree increase in expected average temperature is associated with an increase in prices of 4.7% in Sardinia, 3.2% in Corsica, while prices are not significantly affected in Sicily. Similarly, a one-mm increase in daily rain is associated with a decrease in prices of 1.7% in Sardinia, 1.9% in Corsica; again, prices in Sicily are not affected. Such spatial heterogeneity is likely due to the specialization of the destination (a partially cultural destination like Sicily is the least affected by weather) and different revenue management strategies adopted by local hotels. By assuming that prices instantly adjust to balance demand and supply, and hence keep constant occupancy rates, projections from WP4 (RCP2.6 and RCP8.5 for 2050 and 2100) can be fed into our estimates to forecast that summer prices (and tourism expenditure) will rise by 0.5 – 2.4% in Corsica because of future changes in human comfort index, by 0.8 – 3.7% in Sardinia, while they will drop by 0.1 – 0.5% in Sicily because of the increase in the thermal stress associated with climate conditions. In the second line of investigation, machine learning software of visual object recognition scanned hundreds of thousands of pictures posted by tourists on Instagram to develop metrics able to quantify the concept of destination image, as it is perceived by visitors. The change in the metrics when specific climate events hit a destination imply a change in the relative quality of the holiday experience, with important consequences in terms of tourists’ behaviour and expenditure patterns. 4
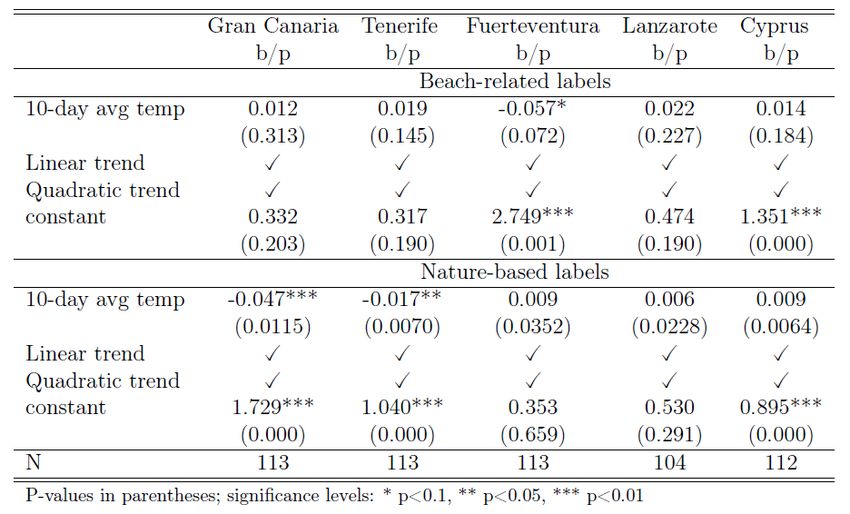
We applied this approach to the case-study concerning the huge, devastating fires that took place in Gran Canaria in Summer 2019, finding that tourists who posted fire-related content were (about 5%) more likely to express negative sentiment, as well as tourists who happened to be closer to the epicentre of the fires. Since the literature shows that negative emotions are diminishing satisfaction, willingness to revisit, and to recommend the destination, wildfires generate a negative impact on the destination that can be precisely measured. For example, we estimated that wildfires decreased demand for nature-based activities on Gran Canaria of about 10%. Although forest fires negatively impact the destination image, the third line of investigation showed that they did not significantly affect hotel performances (always considering the case-study of fire outbreak in Gran Canaria in summer 2019). This is somehow consistent with the literature, suggesting that tourists are only marginally affected by forest fires in beach destinations. A more careful investigation into the robustness of this result is needed, as there are confounding effects: fires just occurred at the peak of the summer season, and accessibility to remote islands as the Canaries implies very high costs of rescheduling the holiday. This report explains the methodologies used in the different lines of investigation, the estimation of parameters, and how to connect them with scenarios of climate change produced by WP4 to produce estimations of changes in tourism expenditure in the different islands under scrutiny. Finally, the limitations of this work and the potentialities of Big Data analysis for research on the socio-economic impact of climate change are presented and critically discussed. 5

1. Introduction

 SOCLIMPACT project is built upon the concept of impact chains. Climate Change (CC)
physically affects the local environment (in terms of air and water temperature, beach extension,
marine and land biodiversity, etc), consequently changing the value of the environmental services
exploited by different sectors of the blue economy. Within the project, WP5 mainly aims at
estimating the (non-market) value of these environmental services for the islands under
investigation, in order to assess, through a stated preference approach, the costs and benefits of
adaptation policies. The present Report D5.3, outcome of task T5.3, complements the WP5
analysis by taking a different approach. Rather than considering the hypothetical choices of citizens
in front of different scenarios (in a “what if” paradigm, as done in T5.4), we look at real behavioural
changes of tourists when events that can be associated to CC appear. In other words, we look at
real reactions of individuals, in a sort of revealed preference approach. To undertake this task, we
have required the help of Big Data (BD) in a sort of massive “field experiment” implemented
during the 2019 tourism season. Data mining and Big Data analysis are among the most recent
tools attracting increasing attention of both academic scholars and policymakers in various areas
of study. This is particularly promising in the field of tourism research, where we can turn to Big
Data to construct and analyze the dynamics of indicators of tourism behavior and expenditure that
are not available as conventional ready-to-use quantitative measures.
 Given the relevant importance of environmental services for tourism, task T5.3 (and hence
this report) only investigates this sector, for many reasons. Firstly, it is an extremely important
contributor to the islands’ economies and a driver, to a large extent, for demand in other sectors
under study in the project (e.g. transport). Secondly, in all its stages (before, during and after
consuming the tourism product) the very nature of tourism transactions leaves a massive online
trace, which naturally makes it a great candidate for being studied through the prism of Big Data.
Thirdly, this is a sector where demand (and not only supply) is directly affected by CC. In a nutshell,
CC modifies the environment and thus the quality of the holiday experience directly perceived by
tourists at the destination. A shift in quality can trigger a change in the physical volume of tourism
(tourists will not arrive or modify their length of stay because of CC), a change in price (as demand
and supply would have to readjust to the new quality level) or a change in both, which is the likely
outcome in the real world. Should we succeed in estimating the impact of different CC events on
the quantity and the price of tourism, we would be able to provide WP6 with a (partial) answer to
a key question for the whole SOCLIMPACT project: how much is tourism expenditure
changing because of CC in the destination? Although this task does not focus on the other
Blue Economy sectors, the extension of BD analysis to Maritime transport, Aquaculture and,
especially, the Energy sector is possible and likely to produce innovative and interesting findings,
particularly if advanced BD analytics are applied. We will return on this in the final considerations.
 Moving from the intuition of this approach to the real evaluation, many caveats apply. One,
tourism is a composite bundle, including many non-market services (environmental and cultural
resources) together with market services (accommodation, leisure activities, food & beverage, etc.):
a comprehensive analysis of all activities would be a cumbersome task to carry out: hence, we focus
only on few specific services, selected according to data availability. Two, CC impacts different
territories differently, each one responding according to its own specificity and the type of tourism
hosted. A particular care would hence be needed in the act of transferring values herein estimated
to other territories. Three, different events linked to CC (storms, heat waves, forest fires, etc.) affect
tourism differently, hence all the impact chains unfolded in SOCLIMPACT should be investigated.

 6
It is easy to understand that a full coverage of all the CC impacts for all the islands and all the
tourism services goes well beyond the time and human resources allocated to SOCLIMPACT.
 Accordingly, the main target of this task is to experiment for specific cases / scenarios /
activities in order to complement results for those channels of transmission from CC to tourism
where stated preferences applied in T5.4 hardly work. When possible, this task can also provide
robustness checks to Choice Experiment estimations carried out in task T5.4. Given that analyses
of T5.3 are not vital for the advancement of the project, this Report has had the freedom to
experiment a few lines of investigation which are not only useful for SOCLIMPACT but also
methodological innovative and challenging for the characteristics and amount of data to be
considered.
 The report is structured as follows. Section 2 introduces and classifies Big Data,
highlighting advantages and disadvantages of their use, together with their relevance for tourism.
Section 3 introduces the (three) lines of research that we have decided to investigate for
SOCLIMPACT project: for each one, we unfold research questions and aims, data that have been
collected and analysed, and methodologies. Section 4 keeps the same structure (one sub-section
for each line of investigation) and summarises the main findings. Section 5 recalls and discusses
the main conclusions and sets the table for the estimation of values to be transferred to WP6,
something that will be anyway the subject of another report (D5.6).

 7
2. Big Data: definition, classification, and applicability to the tourism sector

 The term Big Data (hereafter BD) relates to all types of data, including structured and
unstructured unconventional data, which can be collected, stored, and processed following the
rapid growth of information technologies and computing power. BD are everywhere, and they are
currently exploited by a plethora of actors (individuals and organizations) for many reasons: from
companies for managerial purposes to local governments for the development of smart cities; from
intelligence agencies for security reasons to households for purchasing decisions. BD are the
consequence of the development of Information and Communication Technologies (ICTs) and
the by-product of the adoption of networked devices (such as smartphones) by a growing number
of consumers and businesses on a global scale.
 Their properties are often described by 3 Vs: Velocity, implying that they are available at
very high frequencies, often in real time; Variety, as they may come not only in numeric form, but
also as text, images, audio and video content; and as a result, Volume in terms of terabytes but also
in terms of quantity of observations available for statistical analysis. BD merge data generated in
real time by interconnected devices such sensors recording climate information, satellite imagery,
digital pictures, texts and videos, prices and other economic variables recorded in electronic
markets.
 BD are the object of analysis of Data Science, a multidisciplinary field involving
mathematics, statistics and computer science. Data science builds on data retrieval, preparation,
statistical analysis, modelling and machine learning to investigate issues in several settings.
However, BD are also a prominent challenge for business and economic research, and social
sciences have recently acknowledged their importance, embracing their use in current research. In
fact, BD enable to address novel research questions, to develop innovative research designs and to
use new methodologies and approaches.
 Methodologically, BD allow researchers to overcome the difficulties of inferring general
conclusions when working with samples of the population. In fact, BD virtually allow working with
the whole population under scrutiny, without the lags stemming from the availability of census
data. Consequently, it is possible to design large-scale “in-vivo randomized” experiments (Aral &
Walker, 2012). At the same time, BD permit a more efficient detection of patterns and trends,
triggering the identification of new statistical and econometric tools (Varian, 2014; Einav & Levin,
2013, Doornik & Hendry, 2015), not without controversies (Annals of the American Academy of
Political Science, special issue, May 2015).
 As regards contents, the use of BD in social sciences has recently surged and triggered
investigation in many fields of study, such as behavioural economics, spatial economics, revenue
management and web marketing. Relevant literature tackles, among other issues: how information
and product adoption spread over a network; what is the relevance of social influence bias in the
distribution and the dynamics of opinions; the rise of online rating systems as reputation-based
authorities; the use of BD analytics for forecasting purposes; the effectiveness of web marketing
strategies and their impact on the regulation of markets.
 Overall, BD are one of the most interesting frontiers and challenges for economic and
business research. However, these advantages come at costs. Most importantly, there is need to
apply specific techniques to clean and extract value from the large amount of data at hand, as some
datatypes may contain a lot of noise or features that are redundant for the questions of interest.
Additionally, large data volumes require storage repositories with sufficient capacity. Finally,

 8
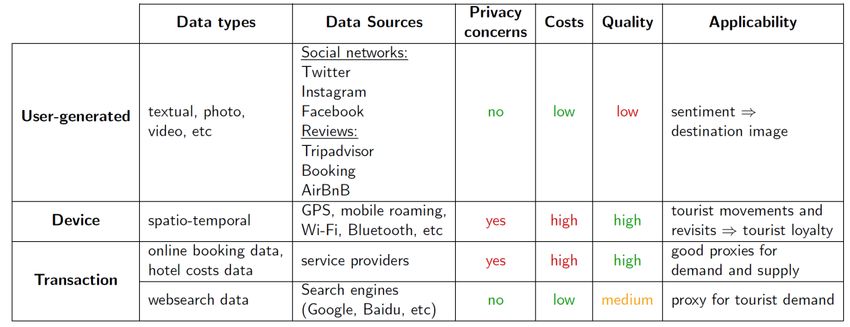
econometric methods for high dimensional problems should be applied, and this also requires
employing advanced human skills and machines with significant computational power.
 The Tourism and Travel sector is undoubtedly one with a large variety of applications
where Big Data could provide new insights. For instance, tourism is the economic sector with the
largest share of e-commerce in OECD countries, and is the one where some of the most important
ICT innovations in terms of business models, peer-to-peer (P2P) platforms and revenue
management strategies were experimented (among the many, consider businesses such as
Booking.com, TripAdvisor.com, BlaBlaCar, Uber, Airbnb). It is then not surprising that most of
the economic and managerial research with BD revolves around tourism and travel, the way
travellers access information, plan and book trips, and subsequently share their travel experience
through social media and review systems. The table below summarizes different datatypes that are
used in tourism literature (Li et al., 2018), their properties and potentialities. First, internet users’
activity generates a lot or relevant content, such as reviews, travel blogs, and posts in social
networks like Twitter or Instagram. This type of data is pulled together under the term User-
generated content (UGC). Secondly, very useful information may be obtained from devices, such
as GPS and mobile phone tracking data. Finally, the last category is transaction data, which
comprises web search data and similar types. All these data have their strength and weaknesses.
 Table 2.1. Data types, their properties and potential use.

 As regards UGC, they are openly available (unless restricted by privacy settings) and
relatively easy to obtain (some services provide API – Application Program Interface, thus
facilitating data collection). Note, however, that generally the easier to get the data, the more effort
is required to clean and process them. From social networks and review websites, a wide range of
useful information can be retrieved: sentiment or attitude (if a person writes positive or negative
reviews/comments) towards a destination, accommodation, attraction, or event. It is also possible
to assess which dimensions or features of a destination are most valued by visitors. Platforms that
combine different datatypes are of particular interest: for instance, Instagram provides imagery
content, complemented by captions to posts and comments from other users, which are textual
data, and even geographic coordinates if users chose to geotag the post, therefore, allowing for
spatial and temporal analysis.
 As opposed to UGC data, device data are more problematic to obtain. Specifically, mobile
phone data must deal with privacy protection issues, requiring an agreement with mobile phone
companies. Potentially, it could allow pinning down individuals and their movements on a very

 9
fine-grained scale, which is of importance in the context of islands, allowing tracking tourists’
routes and the choice of activities and attractions visited within a destination.
 Transaction data combine the properties of UGC and device data as they are quite
heterogeneous. If we consider search engines data, they are very easy to obtain, but their use is
limited to serving as a demand proxy, and quality drops as search terms become more specific. At
the same time, online booking websites can provide high quality data on prices of accommodation
in different locations, but obtaining them requires developing specific web scraping routines, and
data collection process is likely to exhibit interruptions and require timely adjustments in case of
changes in website structure.
 In this mare magnum of data and research possibilities, time, financial and human resources
available in SOCLIMPACT drove us to make important choices as regards the data selected and
the methodologies used, always justified by the research questions of interest. In this respect, it is
important to highlight that our main contribution was not to develop new techniques, or use
cutting-edge methodologies (e.g. advanced machine learning, network analytical methods), but
identify the combination of data and methodology to advance the analysis of D5.3 in a useful way
for the project as a whole.
 To further clarify, we followed a bottom-up strategy, first identifying those large datasets
that share the main properties of BD (the 3V recalled above – volume, variety, velocity) and that
could provide relevant insights into the relationship between CC and tourism. Secondly, since BD
can be mined and analysed in many ways and using standard and/or novel approaches, the choice
of the methodology was driven by the research questions to tackle. In this perspective, since there
is a lot of variety in the approaches taken by different disciplines (economics, computer science,
marketing) and with different aims (research, business intelligence, dissemination), we point out
that a mix of techniques and approaches was used. When the aim was to analyse cause-effect
relationships between socio-economic variables the good old econometric techniques were still
considered the best option. Moreover, machine learning algorithms of visual object recognition
(although not developed in-house) were at the base of Section 3.2, investigating the content of
images posted on Instagram. Again, text mining and sentiment analysis were used in the same
section, when investigating the reaction of tourists to climate events. Finally, different econometric
techniques (standard and advanced) were used throughout the deliverable in other sections (3.1
and 3.3).
 Overall, the aim of this deliverable was not to develop new techniques but to apply existing
techniques to relevant sources of BD. Hence, cutting-edge BD analytics, which are the core in Data
Science, were not used and our investigation departs from what has been recently called “big data
analytics” but is clearly within the boundaries of the analysis of big data. Having said that, the
specific lines of investigation on which we decided to focus, the datasets, and the methodologies
applied are described in Section 3.

 10
3. Methodology and Data As discussed above, given the wide variety of data types, destinations, climate events and tourism activities, in this Task we decided to focus on specific issues that would be useful for WP6 and, at the same time, innovative for their contents and methodologies. The choice of data to collect and analyse was driven by several considerations. First, we aimed at those tourism indicators which are the drivers of impacts pinned down by Impact Chains analysis conducted within WP3. Second, the weather and climate variables to be included in the econometric modelling were determined based on which Impact Chains were operationalized and for which climate indicators projections were provided by WP4. Third, given the experimental nature of this Task, we studied different methodologies, data and islands in order to identify what are the most promising lines of investigation to be applied in future extensions of the project. Accordingly, we decided to proceed with four lines of investigation, one of which was aborted due to the impossibility of getting the data. How do climate events impact accommodation prices? When climate conditions are expected to change, tourists adjust their behavior: they might switch destination, or they might stay longer or shorter depending on the type of climate event. In turn, these behavioral changes will modify the market equilibrium, pushing hotels to adjust their prices to re-establish the equilibrium between demand and supply. The goal of this sub-project was to complete the following statement: “when climatic conditions are expected to change by X, prices change by Y”, where X can be, for example, a heat wave, a storm and Y can be expressed in absolute or percentage terms depending on the estimation technique. How do climate events impact destination image? As evident from Impact Chains development (D3.2), out of 9 specific impact chains for tourism, 5 explicitly mention deterioration of destination image among the demand-side impact. Deterioration of destination image affects the quality of the overall tourism experience and triggers different sentiments, implying behavioral changes. The goal of this sub-project was to complete the following statement: “when the climate event X happens, sentiment changes by Y”, where X can be, for example, a forest fire, an outbreak of a disease, and Y can be expressed in absolute or percentage terms depending on the estimation technique. This estimation can be later matched with other information (coming from other Tasks or from the literature) to learn how the sentiment triggers changes in tourism expenditure and in demand for different types of activities. How do climate events impact hotel performance? Similar to the first research line, we focus on the accommodation sector, in order to have a more comprehensive view of the impact of CC events on the hotel management. As shifts in demand affect not only prices but also physical quantities (arrivals and overnight stays) the aim of this line of investigation was to complete the following statement: “when the climate event X happens, hotel performance changes by Y”, where X can be, for example, a forest fire or an algae invasion, and Y can be one of the main indicators of hotel performance: average daily price, revenue per available room, occupancy rate. How do climate events impact tourists’ mobility? The idea behind this line of investigation was to apply Mizzi et al. (2018) to monitor where tourists stay, and how they modify their movement when the destination is hit by specific climate events (storms, heat waves, etc.). This is fundamental knowledge for destination management as it is likely that tourists would substitute cultural with beach activities when, for example, there is a heat wave. 11
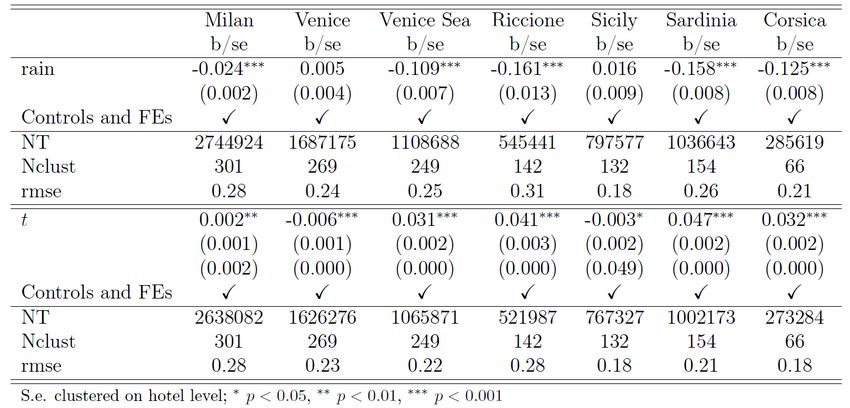
In turn, pressure on specific sites and on the mobility system could be forecasted and
 efficiently managed. In order to carry out this research, we needed a specific type of mobile
 tracking data from phone companies: unfortunately, the company we collaborate with (TIM)
 is not using this specific system in the two Italian islands which are focal points of
 SOCLIMPACT project (Sardinia and Sicily), but only for some regions in Northern Italy.
 Hence, we had to abort this line of research, although the methodology we adopted for
 destination image analysis can partially make up for the absence of mobile data.
 A summary representation of the lines of research is reported in Table 3.1. Once
estimations of impacts of specific events on prices and quality are generated, climate change
scenarios prepared by WP4 can be used as inputs, thus allowing for computation of the economic
impact of climate change on the tourism sector (mainly in terms of variation in tourism
expenditure, but also in arrivals), to be later transferred to WP6. However, this is not the aim of
this specific task (and report) but an indication of how Task 5.3 can be useful to the whole project.
A thorough work of transferring values to other islands and to macroeconomic models will be
undertaken in Task 5.5 (and Report D5.6).

 Table 3.1 – A summary of the research lines investigated
 Line of Impact chain analysed Research Question Data Sources Islands under
 research investigation
 1 2.1 Impact of thermal stress; When climatic conditions Booking.com Corsica
 3.2 Impact of storms are expected to change by Accuweather.com Sardinia
 X, how much do prices Weather.com Sicily
 change? Ilmeteo.it

 2 1.2 Impact of fires When the climate event X Instagram Canary Islands
 2.1 Impact of thermal stress happens, how much does Official weather Crete*
 sentiment change? archives Cyprus*
 Malta*
 Sicily*

 3 1.2 Impact of fires When the climate event X STR-Share Canary Islands
 2.1 Impact of thermal stress happens, how much does Mallorca*
 hotel performance Malta*
 change?

 4 1.2 Impact of fires When the climate event X Mobile phone tracking Aborted due to
 2.1 Impact of thermal stress happens, how is the data impossibility to get
 3.2 Impact of storms mobility of tourists the data
 affected?
 * To be analysed in future elaborations: results are not available for this report.
 A more detailed description of the data and the methodologies for the first three lines of
research now follows.

 3.1. How do climate events impact accommodation prices?
 The first question relates to the supply side of the tourism sector and aims at estimating the
impact of climate events on hotel prices. The proxy to measure climate event is the weather
condition, as weather is typically considered the short-term manifestation of climate (Becken,
2012). As many other services, tourism is characterised by a pattern of advanced booking: services

 12
are put on sales before the actual consumption of the service (check-in date) and hence for each
date of consumption we have to consider demand and supply for each point in time in the advance
booking window. This simple consideration opens a set of related decisions to take as regards data
to collect.
 First, the current standard in accommodation industry is to use revenue management
strategies which imply, among other things, the use of temporal price discrimination (i.e., the price
of the same service changes according to the time when it is booked), such as first-minute or last-
minute pricing. Accordingly, prices have been obtained through the Booking.com platform, which
is the largest accommodation booking website worldwide1. A scraping routine was developed to
collect all prices posted on Booking.com for all the available rooms of selected hotels for a one-
night stay for lead times (i.e. the difference between the day when the price is posted and the check-
in date) from 0 to 15 days. Moreover, all the other relevant characteristics of the booking option
were recorded: room type, room characteristics, reservation features (free cancellation option,
board type, number of available rooms, etc).
 Second, if our goal is to check whether climate has an impact on prices, we have to merge
Booking.com prices with data on weather. Consistently with Figini et al. (2019), we consider
weather forecasts: Figini et al. (2019) intuition is based on a theoretical model where forecasts are
common knowledge and can be observed by both accommodation service providers and
consumers. As the quality of the leisure experience is affected by weather conditions, weather
forecasts (as a signal for expected quality) affect the customers’ willingness to pay and hence
equilibrium prices: an improvement in weather forecasts would increase the expected quality of the
experience, and drive the supply to instantaneously adapt the price, the effect being stronger the
higher the level of accuracy of the forecast and the larger the degree of ex ante uncertainty in
weather conditions.
 Building and extending upon Figini et al. (2019) theoretical framework, we collected data
from 0 up to 15 days in advance from three main weather forecast providers: the international
providers Weather.com and Accuweather.com, which feed data for the default weather apps on iOS and
Android-based devices respectively, and the local provider Ilmeteo.it, which is the most popular
private weather forecast provider in Italy. We chose to use several weather data providers to check
robustness of results and to ensure that in case of different quality of forecasts both international
and domestic tourist segments are represented.
 Third, the collection of data for all the islands would have been beyond the human and
technical resources available within the project, hence we have narrowed this line of investigation
to three islands: Sicily (more precisely, its south-east coast), Sardinia (its north-east coast) and
Corsica (its southern coast); the choice of these specific destinations was motivated by several
factors. Sicily and Sardinia are among the islands with the largest number of hotel establishments
registered on Booking.com, whereas Corsica, on the contrary, is a region with a relatively low number
of establishments appearing on Booking.com; therefore, we aim to contrast evidence from different
types of destinations, to be able to make more robust inference when extrapolating results for other
islands. At the same time, the three destinations belong to two different countries, thus facing
different institutional and legal frameworks, but on the other hand are close to each other
geographically, which implies that they are not facing systematically different weather conditions
in a given period of time; this would allow attributing any variation in results between destinations

1 By number of website visits in August 2018, booking.com was the most visited booking website after TripAdvisor
(https://www.geckoroutes.com/travel-insights/most-popular-travel-booking-websites-apps/). However, among
websites focusing specifically on accommodation, booking.com is the world leader.

 13
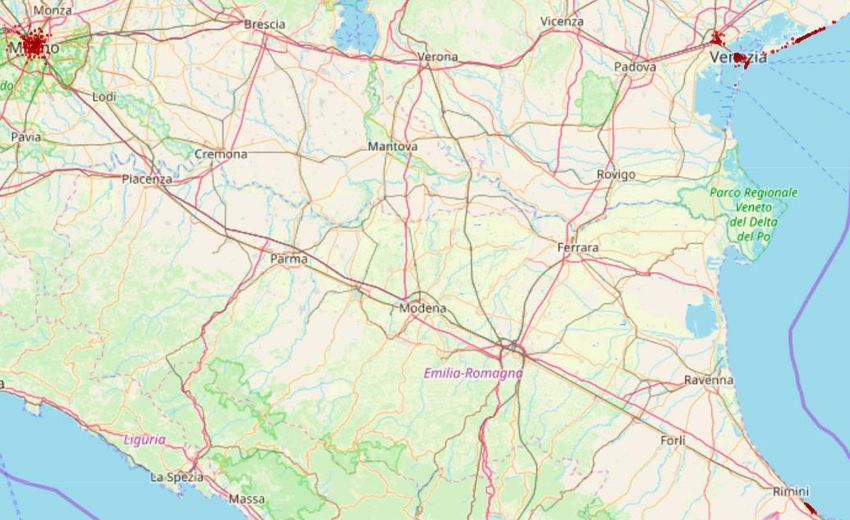
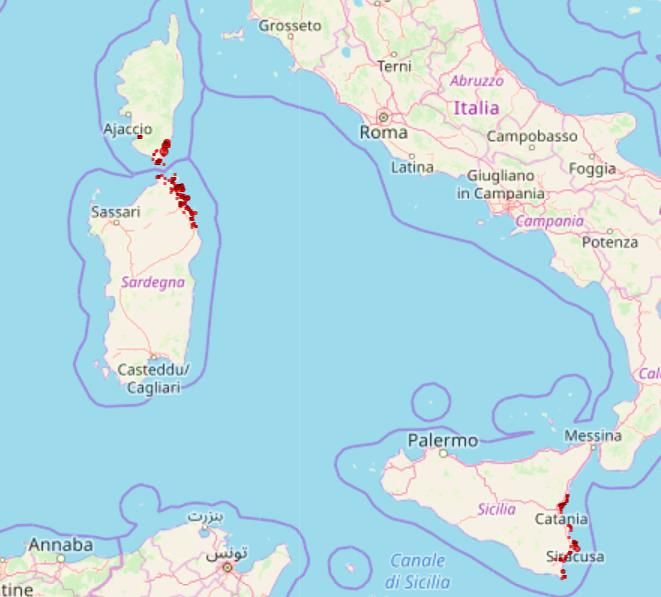
to factors other than weather parameters. In addition, apart from these islands, we selected several
destinations which are qualitatively different from the islands in terms of tourism mix and
accessibility conditions: two leisure mainland destinations (Riccione and Jesolo-Cavallino), a
business destination (Milan), and a cultural destination (Venice). This allows testing sensitivity of
findings to other important characteristics of a destination and make well-grounded generalizations
later on. At the second step of selection, from the pool of 3, 4 and 5-star hotels a random sample
of about 1,300 accommodation structures was constructed.
 Overall, we built a dataset consisting of rooms available for bookings in 1,313 hotels in the
period between April 29th, 2019 to June 30th, 2019.2 Out of 1313 properties in the sample 743 are
located at the seaside, and 570 in the city area. Figure 3.1 depicts location of hotels in the city areas
and over beach mainland destinations (Milan, Venice city, Jesolo/Cavallino, Riccione), while in
Figure 3.2 location of hotels in Sicily, Sardinia and Corsica are plotted.
 Prices are those posted by hotels for a one-night stay and check-in date from 0 to 15 days
in advance from the search date. Extensive information on various room and booking
characteristics is used to construct a set of control variables. This dataset is then merged with the
information about weather forecasts provided by the three providers for temperature, precipitation
and any other relevant weather parameters. We use the Weatherchannel.com forecasts as baseline,
while Ilmeteo.it and Accuweather.com forecasts are used for robustness checks.

 Figure 3.1. Location of hotels in mainland cities and seaside destinations

2 In a future analyses, the whole summer period (29th of April to 31st of October, 2019) will be considered.

 14
Figure 3.2. Location of hotels in islands

 The final dataset is a panel consisting of about 8 million observations, and the question of
interest is then investigated via regression analysis, consistently with the hedonic price model with
dynamic characteristics developed by Figini et al. (2019). Such a large dataset not only allows for
robust inference and high precision of estimates, but also makes it feasible to include a very large
set of independent variables. For this reason, we include a wide range of covariates, most of which
in the fixed effect form. The baseline specification of the hedonic model is the following:
 ∆ = (ℎ , , ∆ , ℎ , ℎ , ,
 [1]
 , , # , , ℎ ∆ ) + ∆
where ∆ is the natural logarithm of price for room of type r observed at date t for a
check-in date + ∆. Controls include hotel fixed effect (ℎ ), room type fixed effect3
( ), booking lead fixed effect (∆ ), day of week fixed effects for search date
( ℎ_ ) and check-in date + ∆ ( ℎ _ ), board type4 ( ), indicator
of free cancellation option available ( ), number of available rooms5 (# ),
number of sleeps fixed effect (# ), indicator of “room with a view” ( ). The main
variable of interest in this model is ℎ ∆ , which is the forecast of the weather parameter
observed at date t for the date + ∆.

 3.2. How do climate events impact destination image?
 As previously recalled, it is evident from Impact Chains development (D3.2) that, out of 9
specific impact chains for the tourism sector, 5 explicitly mention deterioration of destination
image among the demand-side impact. Given the importance of this factor, we chose to study in
detail how destination image may be affected by weather and climatic events.

3 61 room types were manually coded.
4 4 options were possible: breakfast not included, breakfast included, half-board or full board.
5 If contains “only x rooms left on our website”, with 1 ≤ x ≤ 5.

 15
The concept of destination image has received a lot of attention from the literature, and
various studies may define it differently. It is generally accepted to consider it as a composite
multidimensional concept represented by a set of image-forming characteristics of the destination
which visitors find the most valuable and/or intrinsic to a given location. It is usually split into
three different spheres: the cognitive, the affective and the conative sphere (Baloglu and McCleary,
1999; Pike and Ryan, 2004; Agapito et al., 2013). The cognitive image refers to knowledge and
beliefs related to the attractions to be seen, expected experiences to remember, and to the general
environment of the destination (weather conditions, accommodation structures, attractions,
security, health conditions, accessibility, etc.). The affective sphere is related to feelings and
emotions that can be triggered by the different characteristics of the destination (Beerli and Martin,
2004). The conative image is consequential to the previous two spheres and refers to the behavioral
intentions of tourists regarding future activities.
 The majority of studies have been using survey data to analyze destination image. Survey
data, however, do suffer from several drawbacks, such as framing effects, limited number of
observations, and most importantly, they usually relate to a single destination at a single point in
time (at best, only a couple of destinations or two time periods are represented in a single study).
The availability of large amounts of user-generated data makes now possible to study destination
image from a novel and different perspective. Most of the current research on the impact of social
media on destination image formation has focused on textual messages by using content analysis
(Költringer and Dickinger, 2015; Chua et al., 2016; Xiang et al. 2015). On the contrary, just a few
works analyse the content of tourists and DMOs’ photos (Jiang et al., 2013; Stepchenkova and
Zhan, 2013; Miah et al., 2017; Deng and Li, 2018). Moreover, the analysis of pictures posted online
has mainly aimed at detecting tourists’ behavior, tourism recommendations, perceptions, travel
routes and trip duration (Kurashima et al. 2013; Okuyama and Yanai, 2013; Lee et al. 2014); only
in a very few cases the focus is the destination image. One of the contributions in this direction is
a study by Stepchenkova and Zhan (2013), which refers to the case of Peru to investigate
differences in the image promoted by the DMO and perceived by tourists in their pictures posted
on Flickr. Their approach, however, relies on manual inspection of about 1000 images, focusing
on a single destination, and destination image is not studied in dynamics.
 We build upon Stepchenkova and Zhan (2013) to investigate the images that tourists post
when they are on holiday in a given destination. Оur aim is to proxy the concept of destination
image with the features that are most popular in the “aggregate picture” shot by the community of
tourists. Accordingly, we can also investigate how these features change when some specific climate
events hit the destination, and how tourists react. To operationalize this perspective, we first have
to come out with a measure of destination image, and then look at how this measure changes
overtime with climate events. Secondly, we have to find a way to translate pictures into relevant
data to be statistically analyzed.
 To do so, we propose using the universe of travel-related content from Instagram
pictures to construct destination image proxies6 for a given set of destinations. First, we collect
posts published on Instagram in the period June - September, 2019, containing the photo(s), the
name of the destination in the hashtag, as well as travel-related keywords in the caption (this is
done to focus on posts of tourists and thereby excluding residents). Since we aim at obtaining a
vector of feature occurrences for each of the destinations on a very fine-grained scale, we need to
process several hundred thousand of photos, which, of course, cannot be done manually. We
therefore resort to Google’s Cloud Vision API (GCV), a tool based on powerful machine learning

6 Our approach, therefore, captures the cognitive dimension of destination image, as it is perceived by tourists.

 16
algorithms such as convolutional neural networks which perform various image processing tasks:
label recognition, facial detection, object localization and others. From the available GCV options
we selected label recognition: as opposed to object localization, which yields a list of objects that
appear in the image, label detection is more general and returns a set of a broader group of
categories: image labels can identify objects, locations, phenomena, activities, specific plant and
animal species, products, and even more generic and abstract categories (e.g. love, friendship, tourism)
which appear in the picture. GCV processes single images and returns an output with a list of up
to ten labels and related scores, which take values from 0.5 to 1 and indicate the degree of accuracy
matching the label with the given image. After obtaining a set of labels for each picture, we then
construct the collective image of each destination, and analyze how it differs across destinations,
and how it changes in response to weather conditions and climate events.
 More specifically, we define the image of a given destination i as a time-varying vector (with
a time span from 1 to T) of label frequencies for a fixed set of K labels. In matrix notation, we
write down a K x T matrix as in [2]:
 _ 11 ⋯ _ 1
 = ( ⋮ ⋱ ⋮ ) [2]
 _ 1 ⋯
 _
 In the most general case, K may include all possible labels that have ever appeared in the
imagery during the given time span. Alternatively, labels can also be grouped in broader categories.
Frequencies may refer to the ratio of the number of occurrences of label k to either the total
number of labels, or to the number of pictures, or to the number of posts at time t. Finally, the
degree of time disaggregation has to be set, to determine whether the time periods from 1 to T are
hours, days, weeks, or months. We can tailor these parameters in accordance with the question of
interest.
 An advantage of our approach is that this measure is flexible and can in principle be
constructed for any destination at any point in time, thus resolving the main drawbacks of
conventional survey data method, which rarely covers several destinations and several periods in a
single study. Such a property of the proxy we construct allows for a rigorous comparison of images
of different destinations, as well as for studying short-term image dynamics driven by variation in
activities undertaken by tourists in a destination. This, in turn, can help understanding which risks
are more important for a given destination.
 Once we compute the labels frequency, we can also rank labels for each island and use the
ranking to construct a metrics of “destination image distance”, that is, to which extent the image
of one destination differs from another. Whereas many different concepts of distance can be
considered, the simplest metrics is proposed in this analysis and reported in [2a]: the average
squared rank distances of the set of top N labels (we chose N=20 in our analysis). The Index of
Distance in Destination Image (IDDI) is hence introduced as:
 ∑ ( − )2 + ∑ ( − )2
 = [2 ]
 2
 The proposed index measures distance in images of destinations i and j, based on the first
N labels sorted by number of occurrences, so that = { 1 , … , }. An alternative index
may consider absolute instead of squared distances, as using squared rank differences inflates the
resulting distance between images if a pair of labels has very different ranks.

 17
Note that such a metrics becomes meaningful only when there are three or more
destinations in comparison. We further suggest normalizing the absolute distance between
destinations to the smallest in the sample, so that:
̃ =
[2 ]
⃗⃗⃗⃗⃗⃗⃗⃗⃗⃗ }
min{
The absolute and relative frequency of labels in Instagram posts can also be used to
determine how external events (for example linked to extreme weather conditions stemming from
climate change) affect behaviors and activities undertaken by tourists, possibly influencing the
destination image.
As regards the choice of the social network to scrape data from, we opted for Instagram
for several reasons. First, Instagram is one of the fastest growing social networks: while Snapchat’s
daily user count and Facebook’s monthly count grew by 2.13% and 3.14% in Q1 2018 respectively,
Instagram is growing by about 5% per quarter and from 300 million monthly active users recorded
at the beginning of 2015 it has reached 1 billion by June 2018
(https://techcrunch.com/2018/06/20/instagram-1-billion-users/). Second, as opposed to various
text-based platforms, the core of Instagram are pictures, which not only have a more profound
impact on people’s opinions, preferences and perceptions (Hirschman, 1986), but are also capable
of capturing those features of a destination which travelers find attractive and valuable, but typically
do not describe them in tweets or reviews. The reviews, in turn, are a valuable source of information
about tourist satisfaction and opinion about very specific sites, hotels, restaurants, etc., but they are
not able to fully represent the image of destination as a whole.
Apart from pictures, other types of data are available for retrieval from Instagram posts:
image caption, comments, geotag (in case the user opted for attaching it). Geotagging is a feasible
option also in other networks, but users are much more prone to indicate their location when
posting on Instagram, thus making its data a more precise tool for geospatial investigation, for
example to analyze visitors’ activity. Tenkanen et al. (2017) find that social media activity is a good
proxy for visitor counts, especially when Instagram data are used, as opposed to Twitter and Flickr.
Moreover, from a purely technical point of view, it is preferable to use Instagram because
its data are less of a black box than, for example, Twitter: while the Twitter API returns a sample
of tweets that match the criteria outlined in the query (without giving an indication of the total
number of tweets of interest), data obtained from Instagram are the universe of posts from open
accounts which match specific search criteria. Panoramio, another image-based social media, has
the same problem as Twitter and filters posts in an undocumented way. Flickr shares the same
characteristics of Instagram, but is far less popular: the main reason why almost all the studies on
photographs use Flickr is because its API easily allows to get metadata and pictures (Li et al., 2018).
Finally, given that the primary aim of this work is to develop a time-varying vector of the features
composing the perceived image of the destination by travelers, Instagram data appear to fit the
purpose better than online reviews, which are mostly tied to a specific hotel, attraction, restaurant,
etc.
The islands for which Instagram data were collected are the four largest islands of the
Canary archipelago (Tenerife, Gran Canaria, Fuerteventura, Lanzarote), Cyprus, Crete, Malta and
Sicily. By analogy with the first research question, two destinations with different characteristics
(Athens, a cultural mainland destination and Salento, a leisure mainland destination) were added,
in order to test robustness of results and applicability of the approach to a wider pool of
18destinations.7 Canary Islands are of a particular interest as an archipelago and were selected with intention to investigate whether images of individual islands can substantially differ from each other. This allows for more refined predictions for the archipelago as a whole. Another reason to focus on the Canaries is the possibility to study the impact of the massive forest fires which occurred on the islands in the summer of 2019, with most devastating wildfire on Gran Canaria. This is done not only using imagery data, but also textual data from captions and comments. Given the importance of the Forest fires impact chain, which is among the three operationalized impact chains for the tourism sector, our analysis is hoping to provide valuable insights on which effects may a forest fire similar to that of Gran Canaria have, if it occurs in other, similar destinations. The built dataset consists of all retrievable posts that contain a hashtag with the island name and one of the travel-related keywords (travel, visit, vacation, holiday, trip and cognate words) in the caption: this way we target posts that focus on the islands as a tourism destination. The timespan is from 8th of June 2019 to 28th of September 2019, hence covering the Summer season 2019. Table 3.2 provides some descriptive statistics of posts for each of the islands analyzed in the first wave, from which we see that there are not important differences in terms of average number of comments, likes or shared geotags. Table 3.2 – Descriptive statistics of Instagram posts, by destination Island Indicator Tenerife Gran Canaria Fuerteventura Lanzarote Cyprus Num. of posts (total) 49,197 30,042 25,442 20,817 63,561 Avg. num. of pictures per post 1.78 1.68 1.6 1.83 1.75 Avg. num. of comments per 2.22 2.56 2.25 2.08 2.32 post Avg. num. of likes per post 67.4 68.9 74.46 74.73 79.65 Share of geotagged posts 66.5% 66.4% 67.6% 64.4% 70% Although Big Data tools can provide evidence for cases where conventional data are insufficient, for the research questions outlined in 3.1 and 3.2 we exploit those types of user- generated and transaction data which exhibit high velocity. This property allows obtaining valuable insights but has two important drawbacks. First, it requires continuous real-time data collection, which implies that occasional data loss due to changes in website structure or scraping interruptions is almost inevitable. Second and again, since the data are collected in real time, the meaningfulness of the analysis in which it will be subsequently utilized depends on which weather and climate events will actually be observed during the scraping period. For example, it would not be possible to provide any evidence of the impact of heatwaves on outcomes of interest, if during the observation period no heatwaves took place. In other words, we would be able to provide insights regarding impacts of those weather conditions and climatic events, which will have occurred in selected destinations when the data was being collected. 3.3. How do climate events impact hotel performance? The third question focuses on the supply side of the tourism sector and aims at estimating the impact of climatic events on hotel performance indicators. To this aim, we cannot resort to public data scraped from the Internet, as performance is private and valuable information for 7 Similar to the other line of research, due to limit in human and computing resources, this report only analyses the four Canary Islands and Cyprus. Future analyses will include Malta, Crete, Sicily, Athens and Salento. 19
hotels, and we use data provided by STR-SHARE instead. STR is a private company collecting
data with daily frequency from hotels worldwide and providing benchmarking, analytics and
marketplace insights for global hospitality sectors. In particular, STR collects data on hotel supply
(in terms of number of rooms) and demand (OR, occupancy rate – the share of available rooms
that are sold over a period of time), ADR (average daily rate), total revenue and REVPAR (revenue
per available room). Through their SHARE Centre, they collaborate with academia and research
institutes, by providing their data for free for research purposes.8
 In this preliminary assessment of the effect of climate events on hotel performance we
focus on the impact chains of forest fires, by studying the case of wildfires occurred in the Canary
Islands in August 2019. As already described in Section 3.2, dry and windy weather contributed to
the spread of a number of forest fires in Gran Canaria, Tenerife, and Lanzarote, with the most
severe and devasting ones that broke out in Gran Canaria (it resulted in the damage of large forest
areas and in the evacuation of thousands of residents). To assess the effects of these fires we
focused on two of the Canary Islands: Gran Canaria and Tenerife. The reason why we focus only
on these two islands and not on all the islands of the archipelago is that the methodology we apply
needs to consider similar and comparable destinations, but only one severely hit by fires. Hence,
we have Gran Canaria (the treatment group), and one island not (or slightly) damaged by fires,
Tenerife (the control group), as the analysis carried out in Section 4.2 reveals that these two islands
have a very similar destination image, hence suggesting that Tenerife should be the best control
group for Gran Canaria.
 The estimation is undertaken using an Interrupted Time Series model (ITSA) that allows
to compare treated and control groups after an event that is expected to interrupt the level and
trend of a variable, while controlling for autocorrelation. The model can be specified as follows:
 = 0 + 1 + 2 + 3 + 4 + 5 + 6 + 7 + [3]
where Yt is one of the hotel performance variables analyzed at day t (ADR, REVPAR, OR), for
hotels in Tenerife and in Gran Canaria. Tt is a trend variable, Xt is a dummy variable representing
the occurrence of a forest fire (before the fire it takes value 0, after wildfire outbreak it takes value
1), and XtTt is an interaction term. The dummy variable Z denotes the treated group. We consider
Tenerife as the control group and Gran Canaria, where wildfires mainly spread and damaged, as
the treatment.
 While β0 and β1 represent, respectively, the starting level of the dependent variable Yt
(intercept) and its trajectory before the occurrence of forest fires for the control group, the change
in the level and in the trajectory of Yt due to the fire outbreak after the occurrence of forest fires
for the control group are represented, respectively, by β2 and β3. β4 and β5 indicate, respectively, the
intercept difference and slope difference between treatment and control before fire outbreak,
whereas β 6 and β7 embody the intercept and slope difference respectively between treatment and
control groups after fire occurrence.
 Given that fires occurred in mid-August 2019, we only considered data for Summer 2019
(to be more precise, from 1st June to 31st August, 2019. Table 3.3 presents some descriptive statistics
of ADR, REVPAR and OR for both the islands. The table includes also descriptive statistics for
the same period in 2018.

8 We thank STR-SHARE team, in particular Steve Hood, for the prompt provision of data about hotels in the
investigated regions.

 20
You can also read