Retail investing in the information age: an investigation of herd behaviour on Robinhood
←
→
Page content transcription
If your browser does not render page correctly, please read the page content below
Retail investing in the information age: an investigation of herd
 behaviour on Robinhood

 By

 Redmer Nijboer

 Master Thesis Economic Development & Globalisation
 University of Groningen
 Faculty of Economics and Business

 Supervisor: prof. dr. J. de Haan
 Co-assessor: prof. dr. R. Inklaar

 January 2021
Abstract
The commission-free trading platform Robinhood has attracted many young, inexperienced
retail investors, especially during the COVID-19 pandemic. This paper investigates herding
behaviour and its causes among the Robinhood users. It does so by considering multiple
measures of herding behaviour and applying different estimation techniques. Effects are
consistently found for factors related to the user experience Robinhood provides.
Particularly, it is discovered that attention inducing lists are significantly associated with
increased herding behaviour. Furthermore, the findings imply that Robinhood traders
overshoot wider market sentiment, resulting in herding episodes. Here, the traders prefer
firms with smaller market capitalisations to herd on. Moreover, different effects stemming
from the COVID-19 pandemic are established. Surprisingly, higher security prices are found
to increase herding effects, which is thought to be facilitated by the option to buy fractional
shares. This mechanism may be able to create financial bubbles in certain securities. All of
the findings point towards the seeming biases by Robinhood investors which are a detriment
to their financial wealth. The findings of this study should be relativised by the measurement
of herding, which is considered to be a significant matter of debate.

 2

Table of contents
1. Introduction .......................................................................................................................................................... 4
2. The retail investor ................................................................................................................................................ 7
 2.1 The retail investor and trading motivations ................................................................................................. 7
 2.2 Investor behaviour ....................................................................................................................................... 10
 2.2.1 Prospect theory ....................................................................................................................................... 11
 2.2.3 Emotions ................................................................................................................................................12
 2.2.4 Herding ..................................................................................................................................................13
3. Methodology ........................................................................................................................................................ 17
4. Data ......................................................................................................................................................................21
5. Results ................................................................................................................................................................. 25
 5.1 Preliminaries ................................................................................................................................................. 25
 5.2 Empirical results .......................................................................................................................................... 26
 5.3 Robustness tests ........................................................................................................................................... 27
6. Discussion ........................................................................................................................................................... 30
 6.1 Findings from empirical analysis ................................................................................................................ 30
 6.2 Limitations ................................................................................................................................................... 34
 6.2.1 On methodology .................................................................................................................................... 34
 6.2.2 Remaining implications and issues ..................................................................................................... 36
7. Conclusion........................................................................................................................................................... 37
References ............................................................................................................................................................... 38
Appendices .............................................................................................................................................................. 43
 Appendix 1A: Robinhood interface ................................................................................................................... 43
 Appendix 1B: Robinhood interface ................................................................................................................... 43
 Appendix 1C: Robinhood interface ................................................................................................................... 44
 Appendix 2: Variables ........................................................................................................................................ 45
 Appendix 3: Not available data ......................................................................................................................... 46
 Appendix 4: Global Industry Classification Standard (GICS) ......................................................................... 47
 Appendix 5: Normality variables ....................................................................................................................... 48
 Appendix 6: Stationarity variables .................................................................................................................... 48
 Appendix 7A: Descriptive statistics ................................................................................................................... 49
 Appendix 7B: Descriptive statistics COVID-19 ................................................................................................. 50
 Appendix 7C: Descriptive statistics pre-COVID-19 ........................................................................................... 51
 Appendix 7D: Difference descriptive statistics post-pre COVID-19................................................................ 52
 Appendix 8: Residual analysis ........................................................................................................................... 53
 Appendix 9: Estimations original herding DV ................................................................................................. 54
 Appendix 10: Distribution herding ................................................................................................................... 55
 Appendix 11: Dependent variable comparison ................................................................................................. 56
 Appendix 12: Industry effects ............................................................................................................................ 56

 3
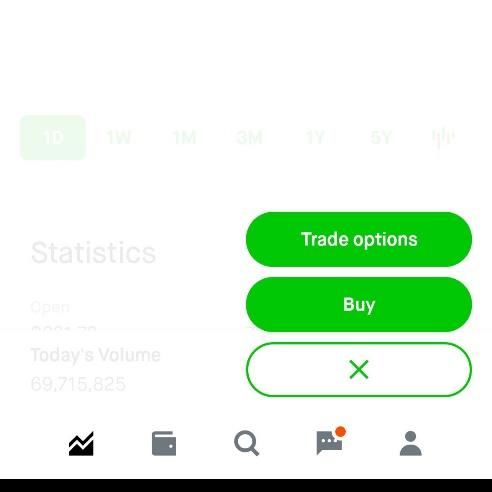
1. Introduction
Capital markets have existed for quite some time. The first stock market originated in the
Netherlands in the 17th century, where through means of bonds and stocks the Dutch trading
companies could be financed. Over time, the Dutch also developed more complicated
financial instruments like stock futures, stock options debt-equity swaps among others. By
having pioneered this new type of market, both companies as well as investors profited from
economic growth that the Dutch firms experienced (Larry, 2005; Stringham, 2003). Capital
markets quickly spread over the world, providing companies listed on these markets with
newly found resources. In turn, not only was there a primary market for companies and
investors to get new capital but also a secondary market for investors to trade with each
other. Over the years, many economists theorised about the function of capital in the
economy.
In this paper, no attempt will be made to come up with a new theory of the working of the
capital markets. Rather, a particular subset of the capital market will be analysed in an
empirical manner. Specifically, the retail investors on the platform of brokerage firm
Robinhood will be investigated. This fintech broker has been disrupting the retail trading
industry in the U.S. by offering commission-free trading and announced to expand to the
United Kingdom in the near future. The Robinhood platform has attracted over 13 million
users where about a quarter of them joined the during first quarter of 2020.1 While the
current demographics of its users is unclear, it has been known to attract mostly younger
investors, ranging from early twenties to early fourties. Because of this young age, many
retail investors make their first trade on Robinhood.2 Since its inception, the platform has
received critique regarding multiple aspects of its business operations. Firstly, the firm made
its profits by granting payment-to-order services. This practice concerns collecting order
data by users and selling this data to third parties, which subsequently can exploit the data
by positioning themselves favourably relative to the orders of the Robinhood traders. The
company was recently fined for not properly disclosing this to its users.3 Moreover, during
the market volatility following the COVID-19 pandemic in early 2020, the platform
experienced outages lasting two trading days. Robinhood traders were side-lined and unable
to trade.4 Furthermore, the platform has been accused of ‘gamifying’ financial trading by
providing an easy-to-use interface where (advanced) trades can be executed with the click
of a button.5 In addition, the app has dynamics as found in mobile games. For example, a
scratch game to get a free stock or confetti animations when purchasing one. As a result of
this game-like experience, Robinhood investors make ill-advised and impulsive decisions.6
Interestingly, Robinhood made its trading data accessible for the public by means of an
application programming interface (API), which allows the interaction between different
software intermediaries. Third parties could therefore use this API to extract information
from the platform and the behaviour of investors. By utilising this data, it is possible to get

1 See “Retail trading app Robinhood’s value tops $11bn on new fundraising” on Financial Times.
2 See “Young, Poor and Looking to Invest? Robinhood Is the App for That” on The Wall Street Journal.
3 See “Robinhood to pay $65m to settle SEC claims it mishandled trades” on Financial Times.
4 See “Robinhood faces first lawsuit after outage” on Financial Times.
5 For visuals of the Robinhood interface and experience, see appendix 1.
6 See “Gamified’ investing leaves millennials playing with fire” on Financial Times.

 4

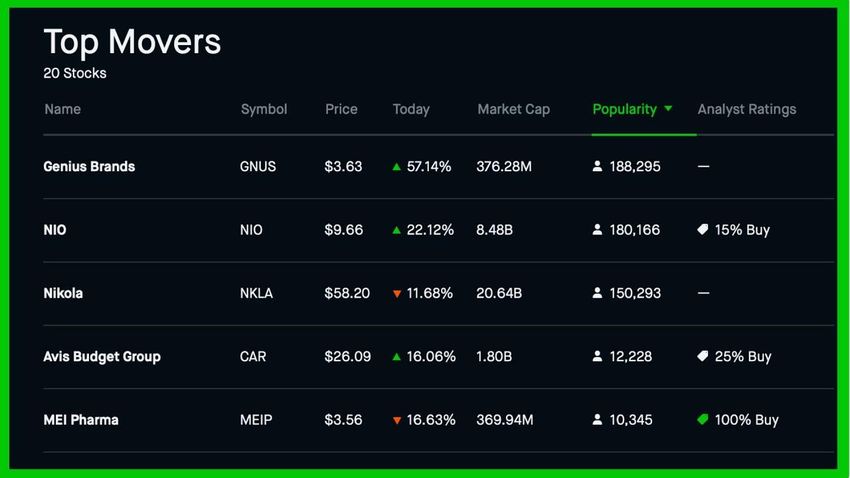
a sense of the behaviour of the investors on Robinhood. In line with the user-friendliness of
the platform, Robinhood presents the most popular stocks and the top-movers of the day on
its home page. As a result of these lists some remarkable purchasing behaviour has taken
place. Take the Hertz Corporation, which is a US-based car rental company. As a
consequence of the Covid-19 crisis, the company filed for bankruptcy.7 Yet, despite the fall
in the share price of Hertz, Robinhood investors flocked towards the stock changing the
number of holders on Robinhood from 1,084 to its peak of 170,814 in less than four months.
An even more extreme example is Kodak, which experienced a 318% increase in its stock
price between the 28th and the 29th July 2020 on the news that it would get a loan from the
government to produce drugs.8 During the same period, the number of Robinhood investors
holding the stock rose from 9,312 to 34,734. One day later, the 30th of July, a whopping
119,109 investors held the stock.9 One could argue that the investors on Robinhood are
susceptible to engage in so called herding behaviour.
According to Bikchandani & Sharma (2000), herding behaviour occurs when investors base
their decision only on other investors’ decisions. This implies that the herding investor must
be aware of the action of others. Lakonishok et al. (1992) provide a statistical measure for
herd behaviour that is often used in the literature. They measure herding as the average
tendency of a group of money managers to buy (sell) particular stocks at the same time,
relative to what could be expected if money managers traded independently. In this paper,
we replace money managers by retail investors and derive inspiration from this methodology
and construct our own measure of herd behaviour. Within this measure, the
disproportionality of trading by Robinhood investors relative to other traders on Robinhood
well as the market will be investigated. Using this and alternative measures, we study the
degree to which the users on the platform display herding behaviour and what factors
influence these episodes. Of particular interest are the “Top movers” and “Most popular”
lists which draw the attention of the Robinhood investor. It is expected that the investors
exhibit the attention bias and will be triggered to invest in the securities showed in these
lists.
In this paper, herding behaviour and its causes will be assessed by utilising an extensive
dataset including the number of holders of a security on Robinhood and several stock
characteristics. In total, the dataset will comprise of more than 6,112 different securities
among 25 different industry groups. While the securities in the introduction are a few of the
most extreme cases, herd behaviour among investors on Robinhood is seemingly evident by
an informal, graphical investigation of the data. The impact of the herd behaviour of these
investors on share prices, however, is a drop in the bucket for large market cap stocks, but
they may have a substantial impact on the valuations of smaller cap stocks. Herding
behaviour also brings about the question on the impact on financial stability considering
that the highlighted stocks show classic financial bubble characteristics. An inevitable
bursting of the bubble could potentially hurt a particular retail investor in the short term.

7 See “Car rental group Hertz files for bankruptcy” on Financial Times.
8 See “Kodak Loan Disclosure and Stock Surge Under SEC Investigation” on The Wall Street Journal.
9 All of the data regarding the Robinhoord users holding stock are based upon the Robintrack website.

 5

Several stories have come out that Robinhood investors lose substantial amounts of
money.10
An insight in the psychology of the behaviour of the most extreme Robinhood investors can
be found in online communities like the subreddit WallStreetBets, where retail investors are
encouraged to boast about their excessive risk taking.11 This sometimes leads to profits into
the millions, but also to financial ruin. It should be noted that the most popular posts are
the most extreme cases as this is the way in which the community is set up. However, the
impact of these posts could be far reaching on the investor psychology of the 1.7 million
members, making it the 229 biggest on the entire Reddit website, which has a total of 330
million registered users. More striking is the activity in this community, ranking it on the
sixth position when measured by total user comments per day.12 Such a community is not
unique, in fact, many more investing communities like this one exist (e.g. other Reddit
communities, Stocktwits, Twitter etc.) and they point towards the increasingly social aspect
of trading, the cornerstone of herding behaviour of investors.
This data set used in this paper has been used by a number of authors. Firstly, Welch (2020)
analyses the holdings of the Robinhood users and assesses their performance. It was found
that the Robinhood investors have a preference for familiar securities and generally did not
underperform from benchmark models. Additionally, the author concluded that more
sophisticated investors did not exploit the Robinhood investors by assessing the available
data about their investing behaviour. Furthermore, Cheng, Murpy, & Kolanovic (2020)
found that investors are drawn towards attention attracting stocks.13 Additionally, stock
popularity was found to be a predictor of returns. Lastly, Barber et al. (2020), who
extensively investigated herding episodes on the Robinhood platform, the exact same topic
as this paper.14 It is found that the herding episodes are linked to attention biases and stocks
with larger returns and trading volume. Furthermore, they record future abnormal negative
returns subsequent to herding episodes, a finding contrary to the Cheng Murpy & Kolanovic
(2020) study. Interestingly, the authors employed a different methodology than the one
proposed in this paper. This will be discussed further in the methodology, results and
discussion section. Naturally, in the following sections comparisons will be made with the
Barber et al. (2020) paper.
This paper starts by sketching a profile of the average retail investor, a set of investors where
Robinhood users fall under. In turn, the literature of behavioural finance and herding is
investigated to provide some context on this topic by shedding light on the psychology
behind the behaviour of retail investors. Within this section hypotheses will also be
formulated. Section three will concern the methodology used to measure herding and the
method of estimation. The fourth section discusses the characteristics of the data and how
it is prepared for analysis. In the fifth section, the results from the estimation will be

10 See “Robinhood Has Lured Young Traders, Sometimes With Devastating Results” on New York Times.
11 See Reddit, subreddit: WallStreetBets. https://reddit.com/r/wallstreetbets/
12 See Subredditstats, /r/WallStreetBets. https://subredditstats.com/r/wallstreetbets
13 This concerns a non-public JPMorgan report. Findings are copied from Welch (2020) and Barber et al.

(2020).
14 The paper was brought to the author’s attention on the 19 th of December via a news article. See “Robinhood

faces questions over business model after US censures” on Financial Times.

 6
presented. The sixth section contains a discussion of the results and provides explanations
for the findings. The paper will be finished by some concluding remarks.

2. The retail investor
As aforementioned, the users of the Robinhood platform belong to the group of retail
investors. We will briefly address the literature on this particular set of investor in order to
better their intentions, motivations and goals.

2.1 The retail investor and trading motivations
According to Finra (2019), the investor education foundation of the U.S., the average retail
investor is predominantly a male, middle-aged, white, decently educated (college or higher)
and relatively high-earning individual when compared to the average American household.
This profile is similar for European retail investors (AFM, 2015). U.S. retail investors mostly
hold stocks (74%) and/or mutual funds (63%). In addition, the majority of the retail
investors held more than 50% of their portfolio either directly in stocks or in mutual funds
that hold stocks. In a different questionnaire investigating retail investors, Agarwal (2017)
tries to illustrate what the contemporary retail investor looks like in terms of his or her
desired investing outcomes. He notes that retail investors start allocating capital in order to
reach certain financial goals, the most common goal being capital gains. The preferred
manner in which this goal is to be reached is by an equity portfolio, thereby signalling the
relative risk-seeking behaviour of retail investors. When asked for the particular goals of
equity portfolio, the respondents note the (expected) high returns, consistent with their
earlier response. Alternatively, the recent relative holdings of stocks versus the other assets
could be explained by the decreasing low bond yields and the rise of stock buybacks among
corporates (FRED, 2020; Aramonte, 2020).

 Asset allocation retail investors
 90%
 80%
 70%
 60%
 50%
 40%
 30%
 20%
 10%
 0%

 Stocks Bonds Cash

Figure 1: Asset allocation of U.S. based retail investors, 1987-2019. Source: American Association of
Individual Investors

In selecting their specific portfolios, retail investors often resort to financial advisers (Finra,
2019). Von Gaudecker (2015) finds that this results in more, balanced, diversified portfolios
which yield decent returns given their low-risk strategy. This result is echoed by Kramer &

 7
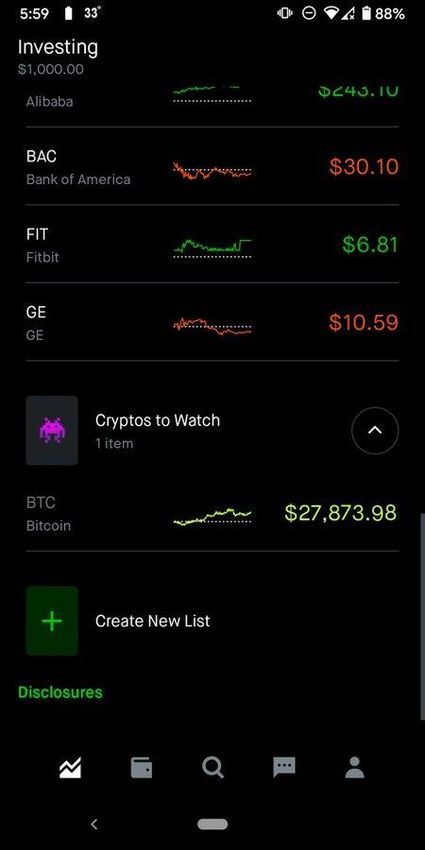
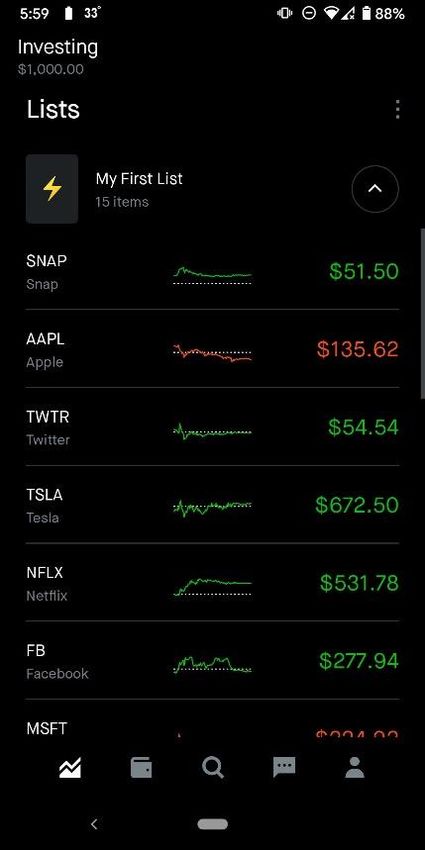
Lensink (2012) who further add that non-advised, illiterate self-deciders generally lose the
most. However, Hackethal et al. (2012) report different outcomes in their study,
investigating independent and bank-associated financial advisers. Based on Sharpe ratios
(to proxy risk-return trade-offs), the authors’ findings suggest that advised investors
perform worse than non-advised ones. These effects can be attributed to the higher turnover
(meaning higher transaction and commission costs) of these portfolios and that financial
advisers discourage direct stock holdings. An alternative explanation for this relative
underperformance of the advised investors could be low levels of numeracy or financial
literacy relative to self-deciders. This may impede on the quality of their assessment when it
comes to making financial decisions.
In the U.S., retail investors have multiple approaches of examining information sources
before making investment decisions. About two thirds of the retail investors indicates to use
the information of a financial professional before making investment decisions. A larger
share, however, conducts their own research and decides for him- or herself (Finra, 2019).
The degree to which investors on Robinhood use the services of financial advisers is
unknown. It is likely, however, that these investors are relatively self-directed. The main
selling point of Robinhood is the ease of commission-free trading of both simple and
complex products by providing a seamless user experience on the platform. Critics have even
dubbed the experience as a ‘gamification of trading’.15 After providing basic user data (name,
country of residence, social security number etc.) the Robinhood app asks for the user’s
investing experience and employment status. Subsequent of a deposit in the app, the user is
able to trade, making the barriers to entry on the platform low. When searching for securities
the homepage shows the user a basic overview of the top movers (highest daily
positive/negative return). Furthermore, the latest financial news is displayed. For a specific
stock, the daily trend is showed along with some basic statistics, relevant news, analysts’
ratings, recent earnings versus expectations, volatility and company profile.16 Although this
may seem like a wealth of information to Robinhood’s inexperienced investors, compared to
traditional financial information platforms it is rather meek.
Whether institutional or retail, the manner in which investors digest and act upon
information is crucial for their performance. If indeed Robinhood investors are self-directed
and we consider the findings of Kramer & Lensink (2012), Robinhood investors are unlikely
to generate returns exceeding commonly used market benchmark portfolios. Furthermore,
according to the Robinhood platform, its investors are relatively young with a median age of
31, making them likely to be relatively inexperienced and potentially financially illiterate.17
Considering that in the literature, these two factors are often found to have negative effects
on returns (Nicolosi et al., 2009; Bellofatto et al. 2018; Bianchi, 2018), the odds for
outperformance are not particularly stacked in their favour. Additionally, considering the

15
 See “Robinhood Has Gamified Online Trading Into An Addiction” on Medium; “Gamified’ investing leaves
millennials playing with fire” on Financial Times; “Confetti Free Stocks: Does Robinhood’s Design Make
Trading Too Easy?” on Wall Street Journal.
 16 The ease of use of Robinhood as described here was gathered from the YouTube video of Andrei Jikh called

 How To Use Robinhood – Step by Step Tutorial. (https://youtu.be/9XjD0cNg4WY), which was.
17 See “Robinhood Has Lured Young Traders, Sometimes With Devastating Results” on New York Times.

 8
age of the investors on Robinhood is relatively low, it may be the case that their attitude
towards investing is different than that of the average retail investor. Hillenbrand et al.
(2020) find stronger reactions to sensation-seeking motivations for investing in younger
investors than older ones. Hence, the inclination to trade for younger investors is the
excitement, novel or intense experience it brings to their lives. This finding is echoed by
Grinblatt & Keloharju (2009). The implication would be that Robinhood investors are
relatively risk seeking i.e. they prefer a high-risk, high-reward investing strategy.
The recent surge in the number of stock market participants can perhaps be partially
attributed to the monetary conditions of low interest rates and asset purchase programs. By
providing these accommodative conditions, central banks affect the allocation, perception
and expectation of risk within the economy, which leads to increased risk-taking (van den
End, 2016). Moreover, retail investors find little or even a negative return on their savings
account and consider alternative capital allocations. The returns on several asset groups are
more favourable than the interest rate on saving accounts, leading to a shift in capital
allocation towards these higher yielding assets. Besides this allocation effect, monetary
policy can also positively influence stock prices via different channels, one being a
transmission effect from the bond to the stock market (Chebbi, 2019; Goyenko et al., 2009).
Alternatively, monetary policy is found to have a direct effect on stock market sentiment
(Kurov, 2010; Galariotis et al. 2015). Hence, this evidence suggests that dovish policy or the
announcements thereof may stimulate stock prices. Subsequently, the upward swing in
prices of stocks (and therefore returns) may attract more retail investors to the stock market.
According to a survey conducted by Agarwal (2017), about a third of retail investors consider
monetary policy developments in their investing decisions. Whether this holds for the
Robinhood investors is unclear.
Lastly, the COVID-19 crisis left a substantial number of workers unemployed and others to
work from home. In combination with the free trading platforms that are currently available,
like Robinhood, and the rise of influencers promoting day-trading, it created the perfect
circumstances for people to start trading.18 The effect of COVID-19 is also reflected by the
retail trading barometer on Robintrack, which tracks the aggregate absolute change in the
number of users holding all trackable assets on Robinhood. This proxy for trading activity
shows a markable increase when COVID-19 hit the U.S. economy as shown in figure 2. The
contribution of retail investors in the total investing market is, however, negligible as the
large institutional investors still make up the lion’s share of the total funds managed
(Langevoort, 2009). In addition, institutional investors are more sophisticated given their
resources and capabilities they have at their disposal. Here, one can think of certain financial
data services, financial education, networks, computing power, access to foreign markets,
access to derivatives trading etc. In sum, the information that institutional investors are able
to gather relative to retail investors is more plentiful and likely to be superior. Consequently,
one would expect that institutional investors are at an advantage vis-à-vis retail investors.
Allegedly, a large part of Robinhood’s business model is a payment-to-order flow to high-

18 See “Social influencers feed the Robinhood hunger for investing 101” on Bloomberg.

 9
frequency traders.19 This entails that investors, predominantly high-frequency traders, can
gather data from Robinhood about which securities are bought and sold by Robinhood
investors before the transactions take place. In turn, buyers of this payment-to-order flow
can position themselves to benefit from this information.

Figure 2: The aggregate absolute change in the number of users holding on Robinhood. An indication of the trading
activity of the users. Source: Robintrack

2.2 Investor behaviour
The literature on behavioural finance provides some interesting insights into what investing
errors investors, not only retail investors, make. It follows from this line of research that
retail investors are not as disadvantaged as one might think. Strikingly, during the COVID-
19 crisis, retail investors outperformed the institutional ones (Glossner et al., 2020) and
Welch (2020) notes that Robinhood investors specifically did not underperform the market.
In their book on behavioural finance, Ackert & Deaves (2010) challenge the assumptions of
the efficient market hypothesis (EMH), a theory that has been highly influential in the
finance literature. This theory, finding its origin in the early 20th century, posits that asset
prices reflect all the available information. Within EMH, a distinction can be made between
the weak form, semi-strong form and strong form (Malkiel & Fama, 1970). Each of these
refers to a different subsets of information being reflected in the prices: the weak form
accounts only for historical prices; the semi-strong form considers all information that is
publicly available; the strong form concerns whether given investors or interest groups have
access to information relevant for price formation (i.e. private information is incorporated).
The main implication of the EMH is that an investor cannot consistently produce excess
returns.

 See “Robinhood to pay $65m to settle SEC claims it mishandled trades” on Financial Times; “Robinhood
19

Gets Almost Half Its Revenue in Controversial Bargain With High-Speed Traders” on Bloomberg.

 10
In the financial markets anomalies are found that go against the EMH: (1) a lagged reaction
to an earnings announcement, (2) small firms yield higher returns and (3) low P/E firms
have higher returns than high P/E firms. Regarding the first, Rendleman et al. (1982) find
that after an earnings announcement of a firm with a positive (negative) surprise there is a
significant period in which the stock price lingers positively (negatively). Depending on the
height of the surprise, the difference in stock price may be two percentage points between
the time of the earnings announcement and 90 days thereafter. Hence, investors could
systematically make a profit, providing evidence against the EMH. In the second case, Banz
(1981) found that a portfolio holding the common stock of the New York Stock Exchange’s
smallest firms by market capitalisation and shorting the largest ones would earn a 1.52%
monthly return during 1931 and 1975. While the information is available, this finding implies
that stock prices of small (or large) firms are consistently unfairly valued and is thus
inconsistent with the EMH. Thirdly, Basu (1977) finds that over a thirteen year period low
P/E firms consistently yield higher returns than high P/E firms, suggesting that markets are
not efficiently utilising with the information available. In their work, Ackert & Deaves (2010)
find evidence against one of the assumptions of the EMH, suggesting that investors are not
rational but are subject to plenty of biases and irrationalities. Moreover, they argue against
the second EMH assumption stating that errors of investors are not random. Rather, it is
found that sentiment and momentum in the stock market impact valuations of securities
more than assumed by EMH. Consequently, it is implied that in some instances most or all
investors wrongly value stocks as a result of social influences. This provides some indication
that herding effects are present in the market and that investors engaging in this type of
behaviour could have an impact on valuations in the market.
2.2.1 Prospect theory
An important example of seemingly irrational investor behaviour is the prospect theory put
forward by Kahneman & Tversky (1989), later generalised by Kahneman (2012). The most
important outcome of this theory is that investors do not fairly assess probability and
forthcoming risks as in expected utility theory, but weigh them according to reference points.
It is found that the framing of a problem is highly relevant and that losses weigh heavier
than gains resulting in an unwillingness to realise losses. Consequently, this leads to the
disposition effect: losses are less often realised than gains by decision-makers. What follows
from Kahneman & Tversky’s research is the question of whether or not investors integrate
or segregate their previous outcomes. That is, whether decision makers assess each decision
separately or add the effect of a new decision cumulatively to all preceding outcomes. The
literature is inconclusive about this integration problem as there is difficulty in determining
the reference point of the subjects in the study. Gärling & Romanus (1997) argue that in
many cases, the reference point is highly dependent on the research design, therefore
impeding empirical studies. Over the years, some evidence of the effects of prospect theory
on financial markets has emerged (Liu et al., 2014; Kaustia, 2010), however, consensus is
not yet present.
Prospect theory thus propagates that investors are heavily influenced by the framing of an
investment opportunity. The Robinhood platform highlights certain securities within its
user interface. Firstly, on its “Most popular” list it presents the most widely held securities

 11
among Robinhood investors. The securities listed here are often rather unaltered indicating
that Robinhood users are attracted to a particular set of stocks and once in possession do
not sell their position. Secondly, Robinhood presents a “Top movers” list where 20 of the
securities are presented with the most extreme daily absolute return.20 These types of list
may provide a frame for the active investors: the popular and ‘movers’ securities are
presented disproportionately relative to the other securities. The investors on the platform
could therefore be heavily influenced by such investment opportunities. The investors turn
towards the securities that are brought to their attention and will pick those. This is what
Barber & Odean (2008) dub the attention bias. In these authors’ research it is concluded
that this effect is particularly relevant for retail investors and less so for the institutional
ones. The latter are namely more likely to consider more securities and thus less likely to fall
for these influences. Retail investors on the other hand are more susceptible to these stimuli
and thus more easily swayed in their investment decision. Moreover, the effect of the “Top
movers” list on Robinhood could have anchoring effects for other securities, which become
less attractive when compared to the securities on this list. Overall, this list could provide
the less sophisticated investors with a frame if the stocks’ gain is not based upon
fundamentals. As a consequence, they could be persuaded to engage in herd behaviour. We
can formulate the following hypothesis.
 H1: Robinhood investors display the attention bias.
2.2.3 Emotions
Related to the above is the impact that emotions have on investor behaviour. A well-known
effect is the ‘weekend effect’ of stock markets. Prior to the weekend, investors are on average
in a good mood and optimistic about stock returns. On Mondays, the investors are in a worse
mood and view average stock returns in a more pessimistic manner. Consequently, the
returns on Mondays are significantly lower than on Fridays (French, 1980; Abraham et al.,
1994; Lakonishok & Maberly, 1990). Advanced algorithms stemming from the field of
computer science can take the emotional effect on stock markets a step further (Chen et al.,
2019). By utilising polarity lexicon (i.e. positive or negative classification of text) the authors
were able to extract the sentiment about the companies listed on the Taiwan 50. Using
130,000 articles as their inputs, the authors constructed a model that was able to predict
stock prices at a reasonable level reaching from 67 to 80 per cent accuracy rate. Other
authors, using similar approaches, report similar results (Affuso et al., 2019; Bollen et al.,
2011). This line of research therefore seems to suggest that market sentiment can be gauged
given enough computing power, relevant data sources and a sophisticated model.
Furthermore, by extrapolation, stock market prices can be reasonably predicted. The
combination of computing power and sophisticated models seem to be able to model the
aggregate emotion of the stock market, better known as sentiment. Following the sentiment
of the market is a commonly adopted strategy among investors and its ultimate form is the
strategy of interest of this paper.

20 See appendix 1A and 1B for examples.

 12
2.2.4 Herding
As aforementioned, Ackert & Deaves (2010) find that it is more likely that retail investors
often use several heuristics rather than advanced analyses. One such a heuristic is the
familiarity heuristic which manifests itself in multiple ways in investors’ stock selection. For
example, positive firm image may result in more individual investors picking the stock. This
effect even occurs when controlling for financial data and relevant attributes (Ackert &
Church, 2006). Consequently, the prices of stocks may be ‘sticky’. An extension of this
finding is that investors tend to follow positive market trends and become more bullish once
it is going up. The finding holds on an international level and therefore seems to be a
universal trait of individual investors (De Bondt, 1998; Kim et al., 2003). These findings
point to the notion of herd behaviour by individual investors. Like in nature, it appears to be
present in the capital markets. Bikchandani and Sharma (2000) state that an individual can
be said to exhibit herding behaviour if she would have made an investment without knowing
other investors’ decisions, but decides not to. Put differently, it is conforming to others’
decisions and disregarding one’s own. In the literature, the measurement of herd behaviour
has been a challenge as there is a significant identification problem. The difficulty arises
from the inability to distinguish between spurious (non-intentional) herding and intentional
herding. Regarding the former, following market sentiment, or positive feedback trading, is
not necessarily an irrational strategy as it may contribute to excess returns and is in the
literature found to be employed by many fund managers (Baltzer et al., 2019; Badrinath &
Wahal, 2002). The inflection point where non-intentional herding switches to intentional
herding is difficult to grasp and it might in fact be impossible as recording the intentions
behind a trade is troublesome. Still, it is from the definition of Bikchandani and Sharma
from which we depart on a further investigation.
In their literature review, Hirshleifer & Hong Teoh (2003) provide an extensive overview of
the different kinds of motives of herd behaviour. They find that herd behaviour stems from
social learning theories. These boil down to the process of analysing both private as well as
public information signals by investors. Markets may therefore move as a herd depending
on the degree, distribution of both the private and public signals and the reception thereof
by each investor. Bikchandani et al. (1998) outline this concept a bit more in detail and
discuss the notion of so-called ‘informational cascades’ which may lead to convergence of
behaviour. These cascades arise from the individuals having to decide on similar problems
and where one can interact with another individual or observe the behaviour of the other in
an environment where each individual’s decision is observed by all others. Consequently,
each individual has an information pool that exists of private and public signals. If an
assessment of an early-deciding individual is faulty, this can have large consequences for the
pool of information for all subsequent decision-makers. These may, as a result of social
learning effects, make unfounded decisions as they weigh the signals of others more strongly
than their private signal. Generally, it is found that the more investors are inconsiderate of
their private signals relative to the public signals, the more likely it is that they exhibit social
learning. This mechanism is also the foundation for herding behaviour on financial markets.
Once investors get a sufficiently strong signal by other traders either directly (i.e. social
interaction effect) or indirectly (i.e. capital gain or loss in market) they conform their
investment decisions. Bikchandani & Sharma (2000) note that this is not necessarily an

 13
irrational strategy as individuals cannot observe each other’s private information. A
counterargument could be made that traders can more easily observe each other’s decisions
as a result of internet investment communities. In this case, the onset of informational
cascades may occur more easily and more rapidly.
The social learning theory highlights the importance of asymmetric information in markets.
Several authors have linked this to the intensity of herding behaviour (e.g. Alhaj-Yaseen &
Rao, 2019; Brunnermeier, 2001). What the theory suggests is that the early private signals
add a lot of information to the public pool of information: they are relatively valuable
information. For the Robinhood platform a parallel could be made to a rapid riser on the
“Top Mover” list. Such a stock would catch the attention of a trader, as a result of which he
may decide to invest. If this happens on a large enough scale the price of the stock could rise.
Here, the average Robinhood trader profile (young, risk-seeking, financially illiterate)
should be considered. Along with the proposed social effects, these could be driving forces
for herding behaviour. Such a strategy, however, might be especially profitable on the
commission-free Robinhood platform as early adopters of the herd behaviour are able to
profit from their trades by selling their holdings with a capital gain (Brennan, 1990). For the
investors on Robinhood it seems that there exists some degree of herd behaviour when we
informally assess the data. In the empirical part, we will test this more formally.
 H2: Investors on the Robinhood platform display herd behaviour.
There is, however, large difficulty of measuring behaviour as there are numerous variables
that could explain flocks towards or from certain assets. Furthermore, as stated before,
herding strategies may not necessarily be irrational given their potential profitability. The
empirical literature on assessing herding can be divided into two strands. The first method,
first proposed by Christie and Huang (1995) and used by various authors (e.g. Chang et al.,
2000; Lao & Singh, 2011; Hwang & Salmon, 2003), is based on an aggregate market data
analysis. The variable of interest with this method is the so called Cross-Sectional Absolute
Deviation (CSAD). It is constructed from the absolute value of the difference between
systemic risk of a stock (βi) and the systemic risk of an equally-weighted market portfolio
(βm). When multiplying this term with the return of the market relative to the risk-free rate
and dividing by the number of stocks, one arrives at the expected CSAD. It is the relationship
between the CSAD and the market return which is relevant for measuring herd behaviour.
In the case of herding the return of the market will have a positive linear, yet less than
proportional effect on the CSAD as the investors move towards market consensus and the
betas converge. With this method, herding is essentially measured only by looking at the
individual asset return component of securities. Overall market effects are not accounted
for.
The second, more dominant method in the herding literature is a methodology found in
Lakonishok et al. (1992) or Wermers (1999). These researchers do not focus on stock
returns, but rather on the proportion of buyers or sellers of a security relative to what is
traded in total. If one subtracts the expected proportion if they were to decide independently
one arrives at the used measure of herd behaviour. The expected proportion is equal to the
number of money managers buying (selling) relative to the number of investors that are

 14
active. This value is then aggregated across all stocks that were traded in a certain period. In
this paper, we will draw more inspiration from this latter approach of measuring herd
behaviour. In this way, we use the available data that was extracted from the Robinhood
platform in the most optimal manner. More on the specifics of the employed methodology
can be found in the methodology section.
Both empirical methods to assess herding behaviour suffer from the fundamental
identification problem that comes with structurally analysing markets, an argument
outlined in Manski (2000). It is argued that econometric research can only make limited
inferences about the behaviour of actors in the market based on the observation of market
outcomes. Thus, next to the problem of distinguishing between intentional and non-
intentional herding, there are a myriad of other factors and decisions that influence the
outcomes in a market. Therefore, the credibility of the empirical findings is strongly
dependent on the assumptions and exclusions of the modelling approach. The analysis
conducted in this paper unfortunately also has to make assumptions in an attempt to explain
herd behaviour. A multitude of other influences that go beyond the variables considered in
the model are potentially relevant for the decision outcomes as well, yet are, for pragmatic
reasons not included. This shortcoming should be in considered at all times and we will get
back to this in the discussion section of the paper.
The empirical research of herding provides some interesting results. Wermers (1999) finds
that mutual funds display little herding behaviour for the average stock, yet higher levels of
herding are found for small stocks and growth-oriented mutual funds. Similar evidence is
reported by Grinblatt et al. (1995) and Lakonishok et al. (1992). An explanation provided by
Lakonishok et al. is that the sponsors of the fund are more sensitive to poor performing,
unknown small-cap stocks as opposed to poor-performing, recognisable larger stocks.
Hence, money managers engage in window-dressing by selling small-cap stocks. Another
explanation is the effect that herds driven by internet investing communities could have on
small-cap security’s valuation. These type of communities of have substantially increased in
popularity over recent years, amassing millions of members.21 These are pre-eminently a
place for the young, tech-oriented Robinhood investors. If a herd of investors originating
from these communities is initiated and sufficiently large, the stock price of a small-cap stock
can be significantly raised.22 By participating, herding investors are able to profit from a
capital gain resulting from the inflated valuation of a security. Several studies find sentiment
on such communities’ sentiment to be a predictor of next day’s stock prices (Sul et al., 2017;
Li et al.,2017), however, a relationship with herding is yet to be discovered. In a study of the
Chinese stock market, Yao et al. (2014) found that, besides the small-cap stocks, the largest
stocks are also subject to herding. The explanation that is provided by the authors is that
retail investors trade these more well-known, large-cap stocks relatively more frequently.
However, this is probably highly specific for the Chinese market, where 90% of turnover in
stock is contributable to retail investors (Lee et al., 2013). Furthermore, considering the

21 Examples include /r/WallStreetBets (1.8 million members), /r/investing (1.3 million members)
/r/Robinhood (396,000 members) on Reddit, StockTwits (2 million users), Twitter (unknown number of
users).
22 Notable examples are those of the Hertz Corporation, Kodak and more recently the GameStop Corporation.

 15
relative size of retail investors in total funds available as in Langevoort (2009), this
explanation seems less likely for our data. Therefore, we consider the following hypothesis.
 H3: Herding behaviour is more pronounced in small-cap stocks.
Furthermore, several authors report the relevance of past returns in explaining herding
behaviour (Grinblatt et al., 1995; Kremer & Nautz, 2013). Specifically, buying herds are
triggered by high past returns and selling herds by low past returns i.e. positive feedback
trading. In line with this finding, Barber et al. (2008) find large systematic movements of
U.S. based individual traders’ investments, which holds for long period of time. In their
research past stock returns are important drivers of herding. In an investigation into the
Chinese A-share stock market Chong et al. (2016) find that herd behaviour is caused by
analysts’ recommendations, short-term thinking by investors and firms highly exposed to
systematic risks. The first finding, measured as the number of analysts following the stock,
suggests that investors are sensitive to information in the environment as also put forward
by Hirshleifer & Hong Teoh. Moreover, in line with the last finding, several authors find that
herding behaviour is most pronounced in crises periods (e.g. Mobarek et al., 2014; Chiang
& Zheng, 2010; Walter & Moritz Weber, 2006). During these periods, a positive feedback
loop between market volatility and panic among investors arises. This financial contagion
causes investors to ignore their private signals and leaves them more likely to follow herds.
By coincidence, the data set analysed possesses a crisis period as the effects of the COVID-
19 pandemic on the financial markets. While this records a systemic downturn for all assets,
markets experiencing upside movements may also instigate herding. Particularly, the
findings of Walter & Moritz Weber (2006) and Grinblatt et al. (1995) suggest that in a bull
market, the buying herd effect is stronger than the selling herd effect in a bear market. A
possible explanation of this finding is that money managers display the disposition effect
found in the prospect theory of Kahneman & Tversky (1989). An alternative explanation is
that the mutual funds that are part of the sample face short-selling constraints.23 As a
consequence, they are limited in profiting from selling herds and thus less likely to engage
in them. Considering all of the above, we formulate the following hypothesis.24
 H4: Herd behaviour is more evident in securities with higher absolute returns.
In an empirical analysis of the Chinese stock market, Lee et al. (2013) make an even greater
distinction between different types of herding behaviour. These authors disaggregate the
market into both bull and bear markets and separate effects per industry and find that the
effects are context dependent. Some industries only show herding behaviour in bear
markets, others only in bull markets and some in both. By exploiting an extensive dataset,
Merli & Roger (2013) provide evidence that similar effects hold for the French retail
investors market. Given the results of these authors it is not unlikely that herding is also
industry dependent for the investors on Robinhood. Therefore, the following hypothesis will
be tested.

23See Wylie (2005).
24This hypothesis will be tested in multiple ways. First, the importance of the daily return of a security on herd
behaviour will be investigated. Secondly, pre- and post-COVID-19 samples will be analysed to investigate
herding effects in extreme return securities as result of a crisis period.

 16
H5: Herding effects on the Robinhood platform differ across industries.
Whether a herding strategy generates abnormal returns for an investor is uncertain.
Empirical evidence regarding the returns of herding investors is mixed. In a study
investigating almost 90,000 individual investors, Merli & Roger (2013) find that past
returns can determine the degree to which individual investors herd. Particularly, their
findings suggest that worse past returns of retail investors decrease the incentives to gather
information about potential investments. Consequently, copying other investors’ strategy
(i.e. herding) is opted for. The authors find that investors employing contrarian strategies,
although being more extreme in both gains and losses, perform better than investors using
a herding strategy. In an assessment of mutual funds, Grinblatt & Titman (1993) find that
some funds engaging in momentum positive feedback trading obtained abnormal returns.
Lai & Zhang report similar findings in an investigation into cross-listed stock. More
specifically, these authors discoveries suggest that obtaining abnormal returns from herding
depends on firm size and the industry that it is active in. In this paper, the performance of
the Robinhood investors will not be investigated. Welch (2020) reported on the aggregate
Robinhood investor portfolio and no significant underperformance was found from the
analysis.

3. Methodology
As put before, in the literature on herding, two methods of measuring herd behaviour
empirically have been most dominant. The first looks at dispersions in individual security
returns relative to market returns and was pioneered by Christie and Huang (1995). The
rationale behind this method is that in times of large price differentials, the returns of an
individual security will converge to the market return. Investors start to view all securities
more similarly, which according to the authors and other researchers is evidence for the
existence of herd behaviour. However, the assumed relationship is a bit of a stretch and does
solely relate to the asset-specific return component. The method neglects the other factors
that may instigate such an effect like as a shock in the overall market or a country. The data
set that is analysed includes for a significant part of its data the ripple effects of COVID-19
restrictions and thus has substantial market effects. Given these shortcomings, this
methodology will not be opted for.
The second and most dominant measure of herding was proposed by Lakonishok et al.
(1992), which looked at relative disproportionate buyers or sellers of a security relative to
what was expected. This method of assessing herd behaviour (further referred to as LSV)
measures herding on a continuous scale and has been imitated by many authors in the
literature.
The LSV method is formulated as follows.

 = | − | − (1)
 +
Where is the number of buyers of a security i at time t while is the number of sellers
of a security i at time t. stands for the expected proportion of the investors buying relative

 17
to the number that is active. AF stands for an adjustment factor that equals the expected
value of the first part of the equation under the null hypothesis of no herding behaviour.
The data used for analysis was extracted from Robintrack, a website that kept track of the
number of Robinhood users that held a particular security over time. The data from this
website has multiple issues when fitting it with the LSV measure. Firstly, the data does not
provide the number of active investors on the Robinhood platform. Given the business entity
of Robinhood and its limited liability form, this information is simply unknown. Therefore,
it is not possible to fairly calculate the proportion or . Furthermore, we only know
about the aggregate changes in the number of investors of a security and not about the
disaggregated buyers and sellers of security i. That is, only the net effect is given in the data
set. To illustrate, a security could have a value of security holders of 100 on day t and 110 on
day t+1, implying that ten more Robinhood investors hold the security on day t+1 than on
day t. This increase, however, could be the result of any combination of negative and positive
integers resulting in a positive value of ten. The possibilities are theoretically infinite
resulting in no correct way of disentangling buyers and sellers. Thus, also when it comes to
calculating the first, fractional part of the equation, there are problems. Furthermore, in an
attempt to attract users, Robinhood hands out a free stock to new users upon joining the
platform.25 This stock is selected based upon its popularity and its market capitalisation. 26
Consequently, investors may be recorded as a holder of a security without actually having
engaged in herding behaviour, thereby influencing the data. Lastly, it should be mentioned
that Robinhood investors are able to hold fractional shares. This implies that Robinhood
investors can hold as little as a millionth of a share. 27 While this may have the consequence
of inflating the data on users holding a particular security by lowering the barriers to invest,
it can still be a valid buy transaction. All things considered, the LSV measure of herd
behaviour unfortunately did not fit with the data. Hence, a measure is constructed is based
upon elements from the LSV measure.
The LSV measure is ultimately one that compares relative proportions to measure herding.
First, it does so by comparing the share of buyers (sellers) to the total amount of buyers and
sellers, the fraction part in (1). As a substitute for this element, the proportion of net trades
of a security relative to the aggregate absolute change of security holders on the Robinhood
platform ( ) is considered. A positive (negative) value measures the share of net buyers
(sellers) of a security relative to the total changes in investor’s positions on Robinhood. This
closely follows what is measured in the fraction of the LSV measure. Secondly, the LSV
measure uses for the expected proportion of buyers (sellers) of a stock. Here, the used
measure will slightly deviate. To account for this expected proportion, the mean value of
was taken. The time dimension of our sample equalled 565 days, thus it can be assumed that
the average is a fair estimation of the true mean value. By combining the two in a fraction,
highly irregular trading behaviour is accounted for, both relative the entire platform as well
itself. Herding episodes will be marked by these exuberant buying or selling patterns and
this measure is able record them. While this measure picks up on herding on Robinhood,

25 Refer to appendix 1C for a visual.
26 See “Open account, get free stock” on Robinhood website.
27 See “Fractional shares” page on Robinhood.

 18
You can also read