WORKING PAPER SERIES No. 24 | April 2020 - TRR 266 Accounting for Transparency
←
→
Page content transcription
If your browser does not render page correctly, please read the page content below
WORKING PAPER SERIES

                    No. 24 | April 2020

                    Hassan, Tarek. A. | Hollander, Stephan | van Lent, Laurence |
                    Tahoun, Ahmed

                    Firm-Level Exposure to Epidemic Diseases:
                    Covid-19, SARS, and H1N1

                             TRR 266 Accounting for Transparency
        Funded by the Deutsche Forschungsgemeinschaft (DFG, German Research Foundation):
Collaborative Research Center (SFB/TRR) – Project-ID 403041268 – TRR 266 Accounting for Transparency

                             www.accounting-for-transparency.de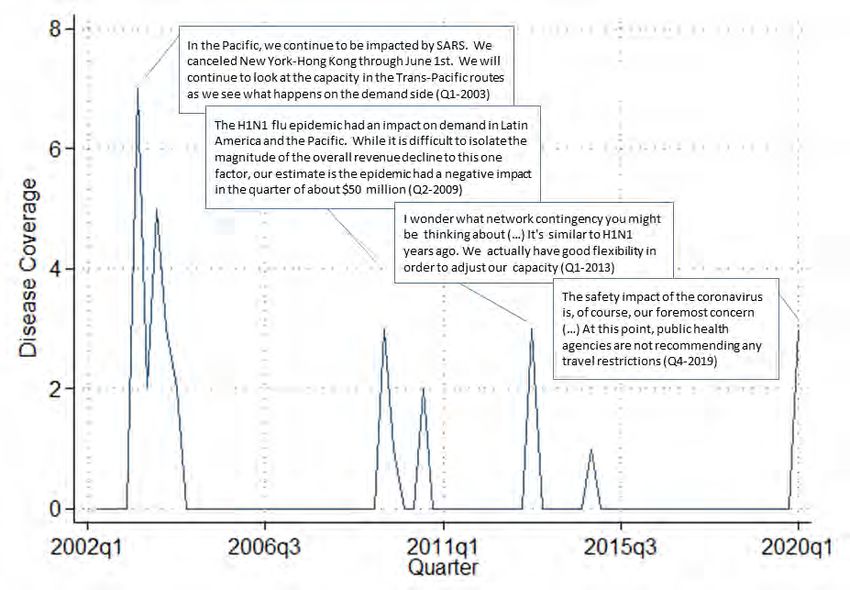
Firm-Level Exposure to Epidemic Diseases:
                          Covid-19, SARS, and H1N1∗

                     Tarek A. Hassan†                   Laurence van Lent§
                    Stephan Hollander‡                     Ahmed Tahoun¶
                                          April 1, 2020
                                               Abstract
        Using tools described in our earlier work (Hassan et al., 2019, 2020), we develop text-
        based measures of the costs, benefits, and risks listed firms in the US and over 80 other
        countries associate with the spread of Covid-19 and other epidemic diseases. We iden-
        tify which firms expect to gain or lose from an epidemic disease and which are most
        affected by the associated uncertainty as a disease spreads in a region or around the
        world. As Covid-19 spreads globally in the first quarter of 2020, we find that firms’
        primary concerns relate to the collapse of demand, increased uncertainty, and disrup-
        tion in supply chains. Other important concerns relate to capacity reductions, closures,
        and employee welfare. By contrast, financing concerns are mentioned relatively rarely.
        We also identify some firms that foresee opportunities in new or disrupted markets
        due to the spread of the disease. Finally, we find some evidence that firms that have
        experience with SARS or H1N1 have more positive expectations about their ability to
        deal with the coronavirus outbreak.

Keywords: Epidemic diseases, pandemic, exposure, virus, firms, uncertainty, sentiment, ma-
chine learning
      The data set described in this paper is publicly available on www.firmlevelrisk.com.
  ∗
     Preliminary and incomplete. We thank Steve Davis for helpful comments. Aakash Kalyani and
Markus Schwedeler provided excellent research assistance. Tahoun sincerely appreciates continued support
from the Institute for New Economic Thinking (INET). Van Lent gratefully acknowledges funding from the
Deutsche Forschungsgemeinschaft Project ID 403041268 - TRR 266.
   †
     Boston University, NBER, and CEPR; Postal Address: 270 Bay State Road, Boston, MA 02215,
USA; E-mail: thassan@bu.edu.
   ‡
     Tilburg University; Postal Address: Warandelaan 2, 5037 AB Tilburg, the Netherlands; E-mail:
s.hollander@tilburguniversity.edu.
   §
     Frankfurt School of Finance and Management; Postal Address: Adickesallee 32-34, 60322 Frank-
furt am Main, Germany; E-mail: l.vanlent@fs.de.
   ¶
     London Business School; Postal Address: Regent’s Park, London NW1 4SA, United Kingdom; E-
mail: atahoun@london.edu.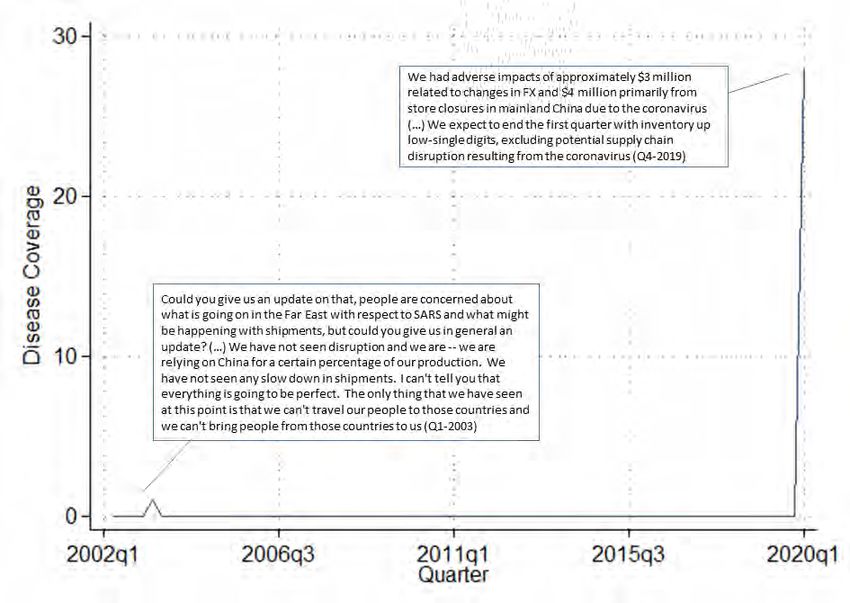
“[D]o you want to touch on cancellations and just the whole hype around coronavirus?”
— Colin V. Reed, Chairman and CEO, Ryman Hospitality Properties, February 25, 2020

   When the World Health Organization declared the outbreak of the Covid-19 virus a
pandemic on March 11, 2020, the disease had already wreaked havoc in large swathes of
China and in Northern Italy. At that point, 118,319 infections with the virus had been
confirmed, and 4,292 people had died from the disease. What started as a new illness in a
middling city in China, had grown within a few months to a global public health crisis the
likes of which had been unseen for a century. Stock markets around the world crashed. After
an Oval Office address by US President Trump failed to calm markets on March 11, major
stock indices fell another 10 percent on the following day.1 Even though governments rushed
in equal measure to stem the further spread of the virus, locking down entire regions and
restricting (international) travel, and to support a suddenly wobbling economy, providing
emergency relief measures and funding, it became quickly clear that the shock would leave
few untouched.
   While the Covid-19 pandemic provides an extreme case, outbreaks of epidemic diseases
are not without precedent in recent times and much can be learned about the resilience of
the corporate sector from previous examples. However, given the extraordinary nature of
the current crisis, these earlier experiences need to be carefully calibrated against the unique
features of today’s challenge: existing models and policy remedies might no longer apply
(Adda, 2016; Barro et al., 2020). In an effort to aid evidence-based policy responses, in this
paper, we construct a time-varying, firm-level measure of exposure to epidemic diseases.
   The measure we introduce is based on a general text-classification method and identifies
the exposure of firms to an outbreak of an epidemic disease by counting the number of times
the disease is mentioned in the quarterly earnings conference call that public listed firms
host with financial analysts. This approach has been validated in recent work by Hassan
et al. (2019, 2020) in the context of measuring a firm’s exposure to political risk, Brexit, and
   1
     See Baker et al. (2020) and Ramelli and Wagner (2020) for an early discussion of the stock market
response to Covid-19.

                                                  1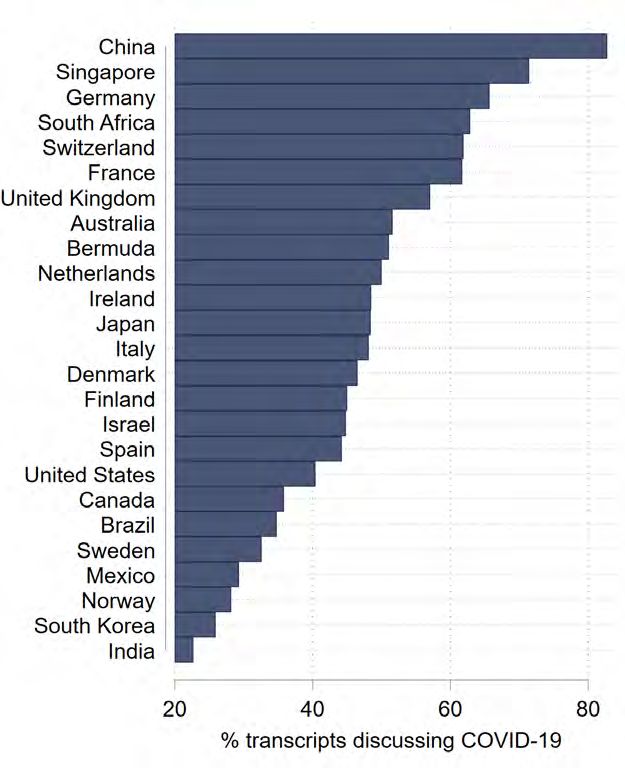
to shocks such as the Fukushima nuclear disaster.
   Intuitively, the idea of constructing a measure of firm-level exposure to a particular shock
from earnings call transcripts rests on the observation that these calls are a venue in which
senior management has to respond directly to questions from market participants about the
firm’s prospects. Not only are these disclosures therefore timely, but as they consists of a
management presentation and, importantly, a Q&A session, they also require management to
comment on matters they might not otherwise have voluntarily proffered. In most countries,
earnings conference calls are held quarterly, which allows us to track changes in firm-level
disease exposure over time. Indeed, we plan to continuously update our measures to reflect
the impact of concurrent (Covid-19 related) events as they unfold. At the same time, we
begin by using our approach to consider a given firm’s exposure to earlier significant epidemic
diseases, namely SARS, MERS, H1N1, Ebola, and Zika.
   In addition to this exposure measure, we also construct—following Hassan et al. (2019,
2020)—measures of epidemic disease sentiment and risk. These latter two measures intend to
capture the first and second moment, respectively, of a given firm’s exposure to an epidemic
disease outbreak. Doing so is important, not only because first and second moments tend
to be correlated and estimating the impact of uncertainty on firm outcomes requires one to
control for the effect of the outbreak on the mean of the firm’s expected future cash flows,
but also because it allows us to separate those firms which expect to gain from these events
from those that expect to lose. While it might sound callous to talk about firms benefiting
from a life-threatening disease as “winners,” we use these labels nevertheless for ease of
exposition. Once we identify these winners and losers, we can then turn to the details of the
conversation in their transcripts to systematically catalogue the reasons why they believe
they can benefit from or are harmed by the outbreak.
   Having constructed these new firm-level epidemic disease exposure measures, we docu-
ment a set of empirical findings for the impact of outbreaks on firms in 71 countries. We
present findings that are not just of interest in their own right, but which also help to allay

                                              2
any potential concerns about the validity of our measures. For example, we show that the
time-series pattern of exposure to certain diseases follows the infection rates in the popu-
lation of these diseases, consistent with the idea that investors are most concerned about
the firm’s exposure when an outbreak is most virulent. We not only document over-time
patterns, but also show, by aggregating exposure scores geographically, how countries differ
in the average impact of an outbreak. What is more, we show how sensitive different sectors
in the economy are to epidemic diseases.
       Moving beyond validating the measure, we then examine the resilience of the corporate
world to the rise and spread of Covid-19. An emerging literature on the macroeconomic
impact of pandemics emphasizes that the spread of the disease itself, and the policy responses
attempting to mitigate it, may result in large shocks to supply, demand, and financing
(Eichenbaum, Rebelo, and Trabandt, 2020; Gourinchas, 2020). At the firm level, these
shocks may manifest in a variety of different ways. For example, the firm’s supply chain
may be disrupted, it may suffer labor shortages, shutdowns of production facilities, a sudden
drop in demand, or difficulty in accessing credit lines.2,3
       We produce evidence on which of these potential concerns are current for firms around the
globe during the coronavirus outbreak. Based on a detailed reading of the conversations in
the transcripts, we document that concerns as of the first quarter in 2020 concentrate on (1)
decreasing demand, (2) disruption of the supply chain and closure of production facilities,
and (3) increased uncertainty. By contrast, as of the first quarter in 2020, relatively few
firms appear concerned with their financing position. For a smaller subset of firms we find
that they see opportunities arising from the disruption of competition in their markets. For
this group of firms, the shock to demand can even be positive rather than negative, for
example because they sell medical supplies or believe that the competitor’s brand is tainted
   2
     Atkeson (2020) and Eichenbaum et al. (2020) argue for integrating SIR models of the spread of the
disease with conventional macroeconomic models to study the effects of policy interventions in this context.
   3
     Some prior work even points to effects on labor supply several generations in the future (Almond, 2006),
and that disease shocks can divert savings away from investment in all types of capital into treatment of the
sick and that the loss of lifetime family income can further reduce savings, ultimately producing a fall in the
level of physical capital (Bell and Lewis, 2004).

                                                      3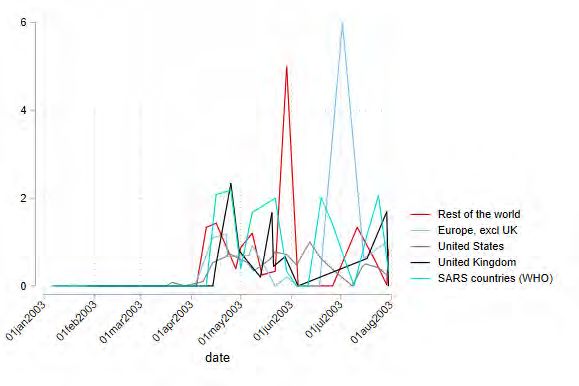
by association with regions stricken by the virus. We also document the extent to which
firms (especially early on in the pandemic) argue that their business is not affected by the
disease. Having a deeper understanding of the various ways in which epidemics affect firms,
is a sound starting point for developing effective government and/or corporate intervention
policies. Clearly, supply-side disruptions should be met with a substantially different toolkit
than is appropriate for demand-related shocks.
   We also show that firms which previously experienced an epidemic disease generally have
higher (more positive) sentiment; i.e., their expectations about how the disease will affect
their future cash flows are more positive than firms without such experience. These more
optimistic expectations are also reflected in subsequent stock market tests. In these analyses,
we show that short-window earnings-call returns, capturing the information released during
the earnings call, as well as first-quarter cumulative returns, are generally lower for firms with
higher measured exposure, negative sentiment, and risk related to the Covid-19 outbreak.
   In sum, we provide novel data and first evidence on the extent to which epidemic diseases
(and in particular the Covid-19 outbreak) affects the corporate world. The data show that
the scale of exposure to the coronavirus is unprecedented by earlier outbreaks, spans all
major economies and is pervasive across all industries. It also highlights the variety of issues
firms and markets worry about amid the coronavirus outbreak; while uncertainty about
the consequences of the outbreak is prevalent, it is foremost the firms’ expectations about
reductions in future cash flows that catch the limelight in earnings calls and explain the
stock market’s response.

                                           1.   Data

We use transcripts of quarterly earnings conference calls held by publicly listed firms to con-
struct our measures of firm-level exposure to epidemic diseases. These transcripts are avail-
able from the Refinitiv Eikon database and we collect the complete set of 326,247 English-
language transcripts from January 2001 to March 2020 for 11,943 firms headquartered in 84

                                                4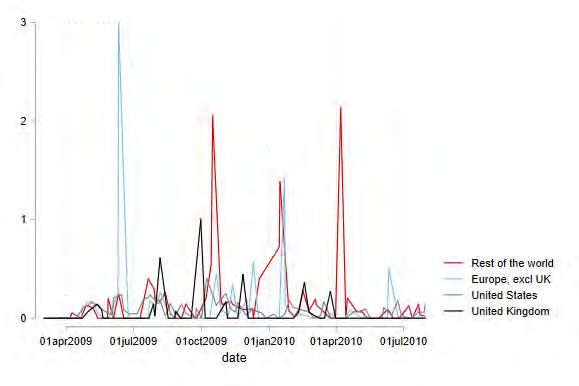
countries.4 Earnings calls are key corporate events on the investor relations agenda and allow
financial analysts and other market participants to listen to senior management presenting
their views on the company’s state of affairs and to ask these company officials questions
about the firm’s financial performance over the past quarter and, more broadly, discuss cur-
rent developments (Hollander et al., 2010). As epidemic diseases potentially have a global
impact, it is important that our data covers a significant proportion of firms in the world.
Appendix Table 1 presents the details of the extensive global coverage of listed firms in our
sample.
       We also use financial statement data, including data on total assets, which are taken
from Standard and Poor’s Compustat North America (US) and Compustat Global (non-US)
files. Stock return information is from Center for Research in Securities Prices and Refinitiv
Datastream. Data on firms’ headquarters country are also from Refinitiv Datastream.5

              2.   Measuring Firm-Level Exposure to Epidemic Diseases

We base our approach on a combination of the methods described in Hassan et al. (2019) and
Hassan et al. (2020). The computational linguistic algorithms described in these two prior
studies ultimately rest on a simple count of word combinations in earnings call transcripts to
measure a given firm’s political uncertainty or exposure to Brexit in a given quarter, respec-
tively. In Hassan et al. (2019), a fundamental step is to determine which word combinations
denote discussions about political topics. These political “bigrams” follow from comparing
training libraries of political text with those containing non-political text. In contrast, in
Hassan et al. (2020), the word needed to identify discussions about “Brexit” is self-evident.
Nevertheless, parts of that study are devoted to showing how researchers can construct a
list of identifying words when the shock or event of interest is less well-circumscribed, such
as in the case of the Fukushima disaster.
   4
     This description applies at the moment of writing this paper. The publicly available data set on www.
firmlevelrisk.com is continuously updated as new transcripts become available.
   5
     Note that this variable is meant to measure the location of the operational headquarters rather than the
country of incorporation, which is often distorted by tax avoidance strategies.

                                                     5
Herein, we follow an approach close to the recommendations of Hassan et al. (2020)
for the latter case. Specifically, we begin by taking the list of pandemic and epidemic
diseases maintained on the website of the World Health Organization and focus on those
outbreaks that occur within our sample period, which starts in 2002.6 We then further
restrict the list to diseases that, in our judgement, attracted sufficient international audience
and potentially were a concern to investors. This restriction eliminates such outbreaks as
the 2019 Chikungunya events in Congo and the 2018 Monkeypox in Nigeria.
For the remaining list of outbreaks, we identify the most common synonyms of each
disease in online resources and in newspaper articles at the time of the event. We also
perform a human audit on a limited sample of transcripts to verify that we are using the
disease word (combinations) that were in use during each of these outbreaks. Finally, we
verify that word combinations intended to capture diseases have no alternate meaning, such
as for example is the case for MERS and the “Malaysian Emergency Response Services 999.”
Appendix Table 2 lists the words (combinations) used per disease.
Having thus compiled our word (combination) list, our time-varying measure of a given
firm’s exposure to an epidemic disease d, denoted DiseaseExposured , is constructed by
parsing the available earnings call transcripts and counting the number of times the synonyms
from Appendix Table 2, associated with each disease d are used. We then divide this number
by the total number of words in the transcript to account for differences in transcript length:
Bit
1 X
(1) DiseaseExposuredit = 1[b = Diseased ],
Bit b=1
where b = 0, 1, ...Bit represents the words contained in the transcript of firm i in quarter t.
To construct a measure of epidemic disease risk, denoted DiseaseRisk d , we augment this
6
www.who.int/emergencies/diseases/en/
6procedure by conditioning on the proximity to synonyms for risk or uncertainty:
Bit
1 X
DiseaseRiskitd = {1[b = Diseased ] × 1[|b − r| < 10]},
Bit b=1
where r is the position of the nearest synonym of risk or uncertainty. Following the example
of Hassan et al. (2019, 2020), we condition on a neighborhood of 10 words before and after
the mention of an epidemic disease and obtain a list of synonyms for “risk” and “uncertainty”
from the Oxford English Dictionary.7
A major challenge for any text-based measure of risk is that innovations to the variance
of shocks are likely correlated with innovations to the conditional mean. Thus, teasing out
the effects of disease-related uncertainty on a firm’s actions also requires controlling for the
effect of the disease event on the conditional mean of the firm’s future earnings. Thus, the
construction of epidemic disease sentiment, denoted DiseaseSentimentd , closely follows the
procedure for DiseaseRisk d in that it counts the words associated with disease d ; however,
instead of conditioning on the proximity to words associated with risk, we condition on
positive- or negative-tone words to capture the first moment. These positive- and negative-
tone words are identified using the Loughran and McDonald (2011) sentiment dictionary:8
Bit
( b+10
!)
1 X X
DiseaseSentimentdit = {1[b = Diseased ] × S(c) ,
Bit b=1 c=b−10
7
See Appendix Table 3 for a list of these synonyms.
8
Thirteen of the synonyms of risk or uncertainty used in our sample earnings calls also have negative
tone according to this definition. Examples include ‘exposed,’ ‘threat,’ ‘doubt,’ and ‘fear.’ Our measures
thus explicitly allow speakers to simultaneously convey risk and negative sentiment. Empirically, when
we include both DiseaseRisk d and DiseaseSentimentd in a regression, any variation that is common to
both of these variables (as a result of overlapping words) is not used to estimate parameters of interest.
For this reason, overlap does not, in principle, interfere with our ability to disentangle DiseaseRisk d from
DiseaseSentimentd .
7where S assigns sentiment to each c:
+1 if c ∈ S+
S(c) = −1 if c ∈ S −
0 otherwise.
Positive words include ‘good,’ ‘strong,’ ‘great,’ while negative include ‘loss,’ ‘decline,’ and
‘difficult.’9,10 Appendix Tables 4 and 5 show the most frequently used tone words in our cor-
pus. As might be expected, descriptive statistics suggest that disease-related discussions in
earnings-call transcripts are dominated by negative-tone words. Accordingly, in subsequent
analysis, we sometimes bifurcate DiseaseSentimentd into DiseaseN egativeSentimentd and
DiseaseP ositiveSentimentd , simply by conditioning on either negative or positive sentiment
words, respectively.
3. Exposure to Epidemic Diseases
3.1. Descriptive evidence
In this section, we use our newly developed measures of firm-level exposure to epidemic
diseases to document some salient empirical patterns present in the data. The emphasis in
the discussion is on the firm-level exposure to the corona pandemic, but we have occasion to
present some findings on the earlier epidemic diseases in our sample period too.
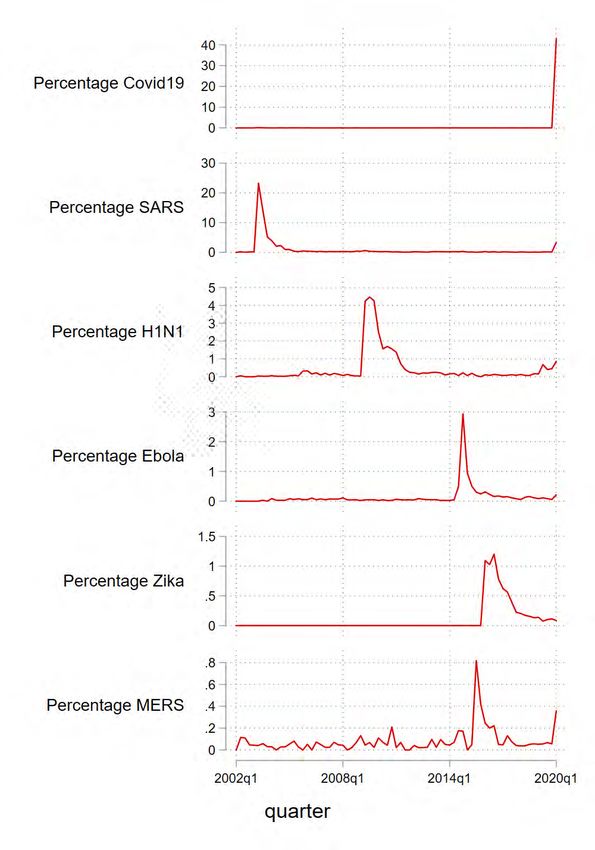
Indeed, Figure 1 depicts the time-series of the percentage of transcripts in which a given
disease is mentioned in a quarter separately for Covid-19, SARS, H1N1, Ebola, Zika, and
MERS, respectively (moving from the top panel to the bottom).11 Reassuringly, these pat-
9
We choose to sum across positive and negative sentiment words rather than simply conditioning on their
presence to allow multiple positive words to outweigh the use of one negative word, and vice versa.
10
One potential concern that has been raised with this kind of sentiment analysis is the use of negation,
such as ‘not good’ or ‘not terrible’ (Loughran and McDonald, 2016). However, we have found that the use
of such negation is exceedingly rare in our sample, so we chose not to complicate the construction of our
measures by explicitly allowing for it.
11
Our sample currently ends with calls held on March 7, 2020, so that the first quarter of 2020 is cut short
8terns closely follow the infection rates for each of the diseases in the population. For example,
SARS, according to the WHO, was first recognized in February 2003 (although the outbreak
was later traced back to November 2002), and the epidemic ended in July 2003. Accordingly,
discussions of SARS in earnings conference calls peak in the first quarter of 2003 and quickly
trail off after the epidemic ends. SARS, which is also a coronavirus disease, starts to become
a subject in earnings calls again in the first quarter of 2020, when it becomes clear that
Covid-19 shares much in common with the former outbreak.
Nonetheless, even at this early point in the development of the epidemic, Covid-19 is
exceptional. Forty percent of transcripts discuss the outbreak: a much larger proportion
than all previous outbreaks (with SARS as the closest “competitor” at just over 20 percent).
In Appendix Figure 1, we provide additional detail for the separate cases of China, the
United States, and Europe (including the UK). Interestingly, SARS was a pervasive topic of
discussion in China (even more so than Covid-19 so far), whereas the Ebola-virus did not
feature at all in earnings calls of firms headquartered in China. Also, the time span over
which diseases are discussed in earnings calls held by China-based companies is much tighter
than for firms in Europe and in the US.
We further compare the time series of Covid-19, SARS, and H1N1 in more detail in
Figure 4. For each of these three diseases, we zoom in on the period in which the epidemic
was ongoing, and plot the weekly average frequency in which a given disease is mentioned
in earnings-call transcripts. We do so separately for different regions/countries in the world.
One immediate takeaway that follows from comparing the plots is that Covid-19 is unique.
The “peak”—i.e., the maximum value of frequency—is much higher than for any of the
previous outbreaks. Further, the discussion frequency of diseases during their epidemic
episode is much less synchronised for SARS and H1N1 than for Covid-19. In the latter case,
we also observe that Chinese companies appear to have reached their peak late February, and
the frequency of its discussion in earnings calls thereafter is trending downward—consistent
by 24 days.
9with the hot spot of Covid-19 infections moving from China to Iran and Italy at the same
time.
Figure 2 shows the percentage of transcripts by country in which Covid-19 is mentioned
(provided that more than 25 transcripts are available for a given country). The figure
excludes transcripts from firms in the healthcare industry and pharmaceuticals in an effort to
highlight the country-level exposure in sectors other than health. Not surprisingly, China has
the highest exposure (to date), with over 80 percent of the transcripts mentioning Covid-19;
followed by Singapore and Germany. Perhaps more remarkable is the relatively low ranking
of heavy-hit areas such as South Korea and Italy. About 40 percent of firms headquartered
in the United States discuss the coronavirus in their earnings calls (again, this includes all
earnings calls held through March 7, 2020).
The frequency of Covid-19 discussion in transcripts varies not only by country, but also
by sector, as shown in Figure 3. One noteworthy finding, which is likely due to our sample
period ending in the first week of March (i.e., before the extreme stock market volatility
started), is that the Finance, Insurance and Real Estate sector has little discussion of the
outbreak, whereas transcripts of earnings calls held by firms in the Manufacturing and the
Wholesales and Retail trade sectors discuss Covid-19 in about half of the cases.
A similar pattern is apparent in Table 1, Panel A, which provides a list of the top
ten firms that discuss the coronavirus most extensively in their earnings calls. These calls
take place mostly at the end of February and early March, 2020. Fashion retail firms such as
Abercrombie & Fitch and Crocs Inc. feature prominently, as do firms active in healthcare and
pharmaceuticals, including PPD Inc. and Agilent Technologies Inc. Panel B of Table 1 adds
further color to this description by listing the firms with the earliest earnings calls featuring
discussion of the coronavirus. Not completely unexpected, airline firms such as American
Airlines Group and United Airlines Holdings vie for a top position with Covid-19 discussions
in their earnings calls already happening at the end of January 2020.12 Although one might
12
Much earlier, however, is the appearance of talk about the coronavirus in the November 11, 2019 earnings
call of Immucell Corp, an animal health company which develops disease prevention products against the
10expect Chinese companies to feature high on the list of early discussions, an institutional
factor might prevent this from happening: by law, firms reporting under Chinese accounting
rules have a fiscal year end in December, making it likely that their first opportunity to
discuss the pandemic is in an earnings call held in the first quarter of 2020, when their
annual financial statements for 2019 are released.
3.2. Content Analysis of Earnings Calls
While our algorithm to measure firm-level exposure to epidemic diseases centers on counting
synonyms of each disease in earnings-call transcripts, having the full conversation between
management and market participants available, allows us to probe much deeper into the
underlying concerns of firms and financial analysts about how a disease impacts corporate
policies and performance.
Focusing on the case of the coronavirus, we identify all 2,175 transcripts that mention a
Covid-19 synonym and single out all text fragments within a given transcript that include
these synonyms. These “snippets” contain ten words on each side of the synonym. In total,
we find 8,600 snippets. Then, we randomly sample 200 transcripts, spread equally over the
months January, February, and March 2020, read all the snippets in each transcript within
this random sample, and identify which issue associated with the coronavirus is discussed
therein.
We identify six key issues: (1) supply chain disruption, (2) a fall in demand, (3) employee
welfare and labor market, (4) production capacity reduction and/or retail store closures,
(5) increased uncertainty, and (6) financial market/financing concerns. In addition, some
managers indicate that the coronavirus crisis (1) has had no impact (yet) or (2) creates
market opportunities for the firm. In 18.5 percent of the transcripts, the coronavirus is
mentioned in a snippet but we are not able to specify the concern. Typically, in these
instances, management would say something non-specific similar to “all of us around the
coronavirus for cattle.
11world follow the dynamic situation regarding the outbreak of the coronavirus in China ...
[and we are] monitoring any impact it may have on our business.”13
Table 2 tabulates the findings from our human reading of the sample of coronavirus tran-
scripts. (Note that each transcript can mention more than one corona-related concern, and
thus the percentages do not add up to 100; instead the reported percentages are the propor-
tion of total transcripts that mention a given concern.) The most commonly voiced concern
when the discussion turns to the possible impact of the pandemic on the firm is the sudden
drop in demand that happened as more and more countries in the world adopted stringent
“social distancing” measures. Indeed, 43.5 percent of transcripts mention a “softening of
demand,” sometimes as witnessed in our showcased snippet, in particular markets (often
China), but sometimes referring to a global shock in the demand for the firm’s products.
Financial analysts also question management about disruptions to the supply chain (27
percent) and the closure of a given firm’s own production facilities and/or stores (18 percent).
These discussions are frequently couched in terms of increased (generic) uncertainties (27.5
percent). In some cases, firms explicitly mention that they have taken precautionary mea-
sures to diversify the supply lines based on their prior experience with an epidemic disease
(most often SARS). As mentioned above, in 18.5 percent of the transcripts the coronavirus is
mentioned, but without offering any further context. Very few transcripts mention financing
issues, which at this point in the crisis, appears not to be the most prominent worry.
In addition to these concerns, some transcripts highlight (13.5 percent) that the firm is
currently not experiencing any impact on their operations. A handful of firms (7.5 percent),
in particular those that have business lines in antiviral medication, testing equipment, and
specialist pulmonary equipment, describe that the corona outbreak provides market oppor-
tunities. Some see chances in the market disruption associated with the crisis, others see
branding opportunities, such as the spokesperson of Shiseido Co. in the snippet reported in
Table 2: “First is the Chinese people as a result of this kind of coronavirus, they may actu-
13
This quote is taken from the February 2, 2020 earnings call of Fluence Corp. Ltd.
12ally heighten or elevate the trust to reliability to Japan or Japanese products. So including
that ...” (sic).
Table 3 presents the changes in frequency in which each of these aforementioned cat-
egories are discussed in earnings calls over the three months of the first quarter of 2020.
Perhaps the most noteworthy finding is that, as the quarter progresses, more and more firms
express concerns about the welfare of their employees and describe the measures they have
implemented (including travel restrictions and the ability to work from home). Similarly,
over the course of three months, concerns related to firms’ supply chain almost triple from
12.12 percent to 32.84 percent of snippets mentioning the virus.
Together, these findings showcase the richness of earnings call transcripts as a source of
detailed data on the operations of firms and how these are affected by shocks like the coro-
navirus outbreak. Combining this source material with simple but powerful computational
linguistic algorithms offers deep insights in a large and important part of the global economy.
We exploit these possibilities more in the case studies described next.
3.3. Two Case Studies
We further demonstrate the working of our DiseaseExposured measure by providing two
case studies. We choose two illustrative firms, plot their exposure scores to epidemic diseases
during the sample period (summing across all diseases d), and include text excerpts taken
from their conference call transcripts to explain the peaks in exposure. Figure 4, Panel A
depicts the case of United Airlines, which has had significant exposure to successively SARS,
H1N1, and Covid-19. An interesting excerpt from the Q1-2013 earnings call refers to United’s
earlier experience with H1N1 and how the airline has made sure it has flexibility in its
capacity to deal with demand shocks. Both SARS and H1N1 receive ample attention during
their respective outbreaks as the firm discusses how demand for air travel is (regionally)
affected. The coronavirus makes its appearance in the first quarter of 2020, but the firm
indicates that travel has not been impacted yet by any restrictions imposed by public health
13agencies.
The second case study, shown in Panel B of Figure 4, is on the US casual wear retailer
Abercrombie & Fitch. In some ways, this company provides a good illustration of how unique
the coronavirus outbreak is—its plot shows very little exposure to epidemic diseases before
Covid-19, yet a large peak in Q1 2020. There is some discussion of how company operations
are impacted during the SARS epidemic. The excerpt provided in the plot discusses how the
firm experienced little disruption in its supply chain, even though movement of employees
had been restricted. In the earnings call held in the first quarter of 2020, however, the
outlook is much different. Abercrombie & Fitch estimate a drop in earnings due to store
closures in mainland China, possible supply chain disruption, and increases in inventory.
Compared with the earlier SARS exposure, the amount of discussion of the disease in the
earnings call is much more extensive.
4. Firm-level Resilience to Epidemic Diseases
In this section, we ask whether firms’ expectations regarding their first moment exposures
to epidemic diseases vary predictably in the cross-section.14 In particular, based in part on
our reading of earnings-call transcripts, we consider whether a firm’s prior exposure to the
next-most virulent diseases, SARS and the swine flu H1N1, allows firms to learn from the
experience and shapes their expectations for the corona-epidemic. As noted earlier, man-
agement, with some frequency, mention their prior experience with SARS (or H1N1) in the
first quarter 2020 calls when the discussion turns to the possible impact of the coronavirus.
While firms might learn from their prior experience, ultimately, the SARS and H1N1 epi-
demics were of a much smaller magnitude and with less severe macroeconomic consequences
than the Covid-19 outbreak. Thus, firms might very well overestimate their preparedness
based on their SARS experience. Prior exposure, in other words, might at the outset help as
well as harm firms in dealing with Covid-19. Both possibilities, however, would suggest that
14
In the appendix, we report fully on our findings for Covid19Exposurei and Covid19Riski .
14prior epidemic experience is associated with less negative sentiment related to Covid-19.
We provide some first evidence on this question by estimating Ordinary Least Squares
regressions specified as follows:
0
(2) Covid19N egativeSentimenti = δc +δs +βP riorEpidi +θitCovid19Exposurei +Zi ν +i
where P riorEpid is the scaled (by the length of the transcript) count of the SARS and
H1N1 synonyms (measured at the peak of their outbreaks in 2003 and 2009, respectively).
Covid19N egativeSentimenti (scaled by the length of the transcript) counts the use of
negative-tone words used in conjunction with discussions of Covid-19. This variable, as well
as Covid19Exposurei , is indexed by i as we only have at most one earnings call transcript
per firm that discusses the coronavirus at this time.
The vector Z contains the natural logarithm of the firm’s (one year) lagged assets as a
control for size and the stock return beta, calculated by regressing daily returns in 2018 for
firm i on the S&P500 index (to measure the firm’s exposure to the US capital market). We
include both headquarters country (δc ) and two-digit SIC industry (δs ) fixed effects. We
drop firms in the healthcare industry and pharmaceuticals as their circumstances during a
public health crisis are plausibly different in manifold ways from all other companies. In
these essentially cross-sectional estimations, standard errors are robust.
Summary statistics for all these variables are reported in Table 4. For ease of interpre-
tation, we multiply all firm-level exposure, sentiment, and risk variables by 1,000, so that,
for example, the mean of Covid19Exposure of 0.246 means that, on average 0.0246 per-
cent of words used in earnings call transcripts in the first quarter of 2020 are synonyms for
coronavirus. Further, we winsorize the control variables at the one percent level.
Table 5 presents our estimation results. Discussions surrounding the coronavirus are over-
whelmingly negative. Accordingly, in column 1, the estimated coefficient on Covid19Exposure
shows that on average, each mention of the coronavirus is accompanied by 0.280 (s.e.=0.0154)
15negative tone words.
Turning next to the question of whether prior epidemic experiences are associated with
more negative expectations for the future during the coronavirus period, we find some evi-
dence consistent with the conjecture that firms that had more extensive discussions in their
earnings calls of SARS or H1N1 in the past (i.e., higher P riorEpid), have significantly less
negative coronavirus-related sentiment scores. For example, in column 2, a one standard
deviation increase in prior epidemic exposure (4.044) is associated with a 2.3 percent de-
crease (relative to the mean) in the frequency of negative tone words used in conjunction
with discussions of coronavirus. In terms of expectations (first moment) at least, it thus
appears that firms with prior experience are somewhat more positive about the impact of
the coronavirus on their business.
In Appendix Table 7, we supplement these analyses by considering Covid19Exposure
and Covid19Risk as the dependent variables. While we find that prior experience with
SARS or H1N1 is associated with higher exposure to the current coronavirus outbreak, there
is no significant correlation between prior experience with SARS and H1N1 and coronavirus-
related discussions of risk. Taken together, these results suggest that while a firm’s dealings
with past epidemic diseases is likely associated with their current corona pandemic exposure,
this historical experience improves the sentiment, but does not change the firm’s epidemic
disease risk.
Having documented that the discussions about the coronavirus in earnings calls of firms
with prior disease experience is somewhat more positive than for firms without such history,
we next ask whether this sentiment explains the variation in stock price changes in a short
window centered on the earnings call date or in a longer window covering the first quarter of
2020 (ending on 15 March). Intuitively, standard asset pricing models suggest that a change
in stock price occurs when investors, on aggregate, revise their views on expected future
cash flows and/or on the expected discount rate. Thus, a more positive sentiment about an
epidemic disease should be associated with an increase in returns, whereas a higher perceived
16risk is expected to be negatively associated with the selfsame.
We test these predictions using the following regression:
0
(3) Reti = α0 + δj + δc + βCovid19Xi + Zi ν + i ,
where Ret is either the cumulative return over a three-day (-1,1) window around the date
of the earnings call or the “quarter to date” cumulative return starting on January 1 and
ending on March 15, 2020; Covid19X, is either our coronavirus Exposure, Sentiment, or Risk
score; and the vector Z includes our standard set of control variables. Return variables are
winsorized at the one percent level. As before, we include sector and country fixed effects
and report robust standard errors.
Table 6 presents our estimation results using the short-window returns as the depen-
dent variable, which we detail for the full sample (columns 1-4) and separately for the US
(columns 5-8). We document a significantly negative association between a firm’s coron-
avirus Exposure score and its stock return (in columns 1 and 5). Thus, firms with more
extensive discussions in their earnings call about the Covid-19 outbreak experience a greater
stock price decline than firms with less exposure. For example, in column 1, a one standard
deviation increase in Covid19Exposure (0.455) is associated with a 1.16 percentage point
lower return in this narrow window around the conference call. Next we consider whether
this return response derives from investors revising their expectations of future cash flows, as
measured by Covid19Sentiment, or their expectations of the firm’s required rate of return,
captured by Covid19Risk (Gorbatikov et al., 2019).
When regressing each of these variables onto the cumulative returns separately, results
show that both explain variation therein (columns 2-3 and 6-7). Note, however, that the
association between Covid19Sentiment and returns appears to be due to negative Covid-19
sentiment. Indeed, positive Covid-19 sentiment, measured by conditioning the presence of
coronavirus-related synonyms on nearby positive-tone words only, is not significantly asso-
17ciated with the short-window return. However, when we include both Sentiment and Risk
at the same time (in columns 4 and 8), it becomes evident that the market responds most
strongly to the extent of negative sentiment related to the coronavirus, consistent with re-
vised cash flow expectations, rather than changes in beliefs about risk, driving these findings.
We repeat this analysis in Table 7, using a long-window return accumulated over the
period January 1-March 15, 2020.15 For the full sample, the patterns using these quarter
returns are very similar to what we have documented using short-window returns: higher
Covid19Exposure is associated with lower returns, though now the association is quantita-
tively larger. A one standard deviation increase in coronavirus exposure is now associated
with a 2.48 percentage point decrease in the firm’s stock return (8% of the average decline in
stock prices during this period reflected in the large constant term of -29.87%). Bifurcating
this exposure effect into its components, we find again that Covid19N egativeSentiment
explains most of the return variation. However, over this long-window, belief revision is not
limited to expected future cash flows. In column 4, we find significant negative coefficients
on both Covid19N egativeSentiment and on Covid19Risk, suggesting that investors also
(re)consider the firm’s discount rates. Indeed, turning to the US sample specifically, we find
that the association between Covid19Exposure and quarter returns is mostly due to changes
in Covid19Risk rather than Covid19Sentiment.
5. Conclusions
At the time of the writing of this paper, we are still in the early stages of the Covid-19
outbreak. Despite this, we are witnessing never-before seen events. Severely overcrowded
hospitals, doctors and nurses succumbing to infections contracted while treating critically ill
patients, far-reaching limits on personal freedoms, and governments stretched to the limits
to provide an adequate response to this public health emergency. Uniquely, these events are
not confined to a small region or set of countries, but affect the entire world. Unprecedented
15
We also report tests using a long-window return measured over (-90,0), with the earnings call date as t
= 0, in Appendix Table 6.
18is also the effect on the global economy. Stock markets have plummeted, more than 3 million
American lost their jobs in a single week in March (Bui and Wolfers, 2020), and governments
committed trillion dollar relief packages in an effort to support the economy.
Having data on how the Covid-19 pandemic is affecting corporations, employees, con-
sumers, and markets is paramount if one hopes to formulate an effective policy answer to
the challenges posed by the crisis. Just as data appears to have guided the first effective
health policy responses to the virus, so is data likely going to be helpful in improving the
efficiency of government interventions. Media reports about abuses of government aid pack-
ages have already emerged (Lipton and Fandos, 2020; Alemany, 2020) and the scramble by
professional lobbyists to get a foot in the door when the various governments draw up their
rescue plans has been called a gold rush (Vogel et al., 2020).
We provide measures of the exposure of individual firms to epidemic diseases, including
the firm’s exposure, sentiment, and risk related to the corona pandemic. We do so for a global
sample of firms, based on their quarterly earnings conference calls with market participants
to discuss the release of their earnings numbers. Using these earnings-call transcripts, we can
not just measure each firm’s exposure to the disease, but can also extract information about
the nature of the concern. This additional detail, together with the timely measurement of
the firm’s exposure (as firms host these calls every quarter), renders the data potentially
well-suited for policy purposes as well as for longer-haul fundamental work which is sure to
emerge once the dust has settled.
19References
Adda, J. (2016). Economic Activity and the Spread of Viral Diseases: Evidence from High
Frequency Data. The Quarterly Journal of Economics 131 (2), 891–941.
Alemany, J. (2020, Mar 23). Power up: Trump won’t rule out possibility his private business
could benefit from coronavirus stimulus. The Washington Post.
Almond, D. (2006). Is the 1918 Influenza Pandemic Over? Long-Term Effects of In Utero In-
fluenza Exposure in the Post-1940 U.S. Population. Journal of Political Economy 114 (4),
672–712.
Atkeson, A. (2020, March). What will be the economic impact of covid-19 in the us? rough
estimates of disease scenarios. Working Paper 26867, National Bureau of Economic Re-
search.
Baker, S., N. Bloom, S. Davis, K. Kost, M. Sammon, and T. Viratyosin (2020, Mar 27).
The unprecedented stock market reaction to COVID-19. Working paper, Northwestern
University.
Barro, R. J., J. F. Ursúa, and J. Weng (2020, March). The coronavirus and the great
influenza pandemic: Lessons from the “spanish flu” for the coronavirus’s potential effects
on mortality and economic activity. Working Paper 26866, National Bureau of Economic
Research.
Bell, C. and M. Lewis (2004). The economic implications of epidemics old and new. World
Economics 5 (4), 137–174.
Bui, Q. and J. Wolfers (2020, Mar 26). More than 3 million Americans lost their jobs last
week. See your state. The New York Times.
Eichenbaum, M. S., S. Rebelo, and M. Trabandt (2020, March). The macroeconomics of
epidemics. Working Paper 26882, National Bureau of Economic Research.
Gorbatikov, E., L. van Lent, N. Naik, V. Sharma, and A. Tahoun (2019). Is firm-specific
political exposure priced? Working paper, London Business School .
Gourinchas, P.-O. (2020). Flattening the pandemic and recession curves. mimeo UC Berke-
ley.
Hassan, T. A., S. Hollander, L. van Lent, and A. Tahoun (2019). Firm-level political risk:
Measurement and effects. The Quarterly Journal of Economics 134 (4), 2135–2202.
Hassan, T. A., S. Hollander, L. van Lent, and A. Tahoun (2020). The Global Impact of
Brexit Uncertainty. Working Paper 26609, National Bureau of Economic Research.
Hollander, S., M. Pronk, and E. Roelofsen (2010). Does silence speak? An empirical analysis
of disclosure choices during conference calls. Journal of Accounting Research 48 (3), 531–
563.
Lipton, E. and N. Fandos (2020, Mar 19). Senator Richard Burr sold a fortune in stocks as
G.O.P. played down coronavirus threat. The New York Times.
Loughran, T. and B. McDonald (2011). When is a liability not a liability? Textual analysis,
dictionaries, and 10-Ks. The Journal of Finance 66 (1), 35–65.
20Loughran, T. and B. McDonald (2016). Textual analysis in accounting and finance: A survey.
Journal of Accounting Research 54 (14), 1187–1230.
Ramelli, S. and A. Wagner (2020, Mar 9). Feverish stock price reactions to covid-19. Swiss
Finance Institute Research Paper, No. 20-12 .
Vogel, K., C. Edmondson, and J. Drucker (2020, Mar 20). Coronavirus stimulus package
spurs a lobbying gold rush. The New York Times.
21Figure 1: Percentage of Earnings Calls Discussing Epidemic Diseases
Notes: This figure plots the percentage of earnings calls discussing epidemic diseases
(COVID-19, SARS, H1N1, Ebola, Zika, and MERS) by quarter, from Q1-2002 to Q1-2020.
We exclude pharmaceuticals (SIC = 2834) and healthcare firms (2-digit SIC = 80).
22Figure 2: Percentage of Earnings Calls Discussing Covid-19 by Country
Notes: This figure shows the percentage of earnings calls discussing covid-19 by country in
the first quarter of 2020. We only include countries for which the total number of earnings
call transcripts held in 2020 (till March 7, 2020) per country ≥ 25. Pharmaceuticals (SIC =
2834) and healthcare firms (2-digit SIC = 80) are excluded.
23Figure 3: Percentage Earnings Calls Discussing COVID-19 by Industry
Notes: This figure shows the percentage of earnings calls held in the first quarter of 2020
(through March 7) discussing COVID-19 by industry (one-digit SIC). Pharmaceuticals (SIC
= 2834), healthcare firms (2-digit SIC = 80), and SIC ≥ 9900 (“Nonclassifiable”) are ex-
cluded.
24Figure 4: Two Case Studies
(a) United Airlines
(b) Abercrombie & Fitch
Notes: This figure shows the sum d DiseaseExposuredit as defined in Section 2 for two
P
illustrative firms: United Airlines (Panel a) and Abercrombie & Fitch (Panel b).
25Figure 4: Discussion COVID-19, SARS, H1N1 by Region
(a) COVID-19: November 1, 2019 to March 10, 2020
(b) SARS: January 1-July 31, 2003
26Figure 4: Discussion COVID-19, SARS, H1N1 by Region (C’d)
(c) H1N1: March 1, 2009 to July 31, 2010
Notes: This figure plots the mean number of times an epidemic disease (Panel A: Covid-19,
Panel B: SARS, Panel C: H1N1) is mentioned in earnings call transcripts by week per region.
SARS affected countries include China, Hong Kong, Singapore, Vietnam, and Canada (https:
//www.who.int/ith/diseases/sars/en/).
27Table 1: Firms with Extensive or Early Discussion of Covid-19
Company name Call date Covid19 Country
Exposure
Panel A: Top-10 firms with highest Covid19Exposure
Abercrombie & Fitch 04-Mar-2020 0.31 United States
Biomerieux SA 26-Feb-2020 0.30 France
Crocs Inc 27-Feb-2020 0.29 United States
Advanced Energy Industries Inc 18-Feb-2020 0.28 United States
PPD Inc 05-Mar-2020 0.27 United States
Wolverine World Wide Inc 25-Feb-2020 0.27 United States
Descartes Systems Group Inc 04-Mar-2020 0.26 Canada
Agilent Technologies Inc 18-Feb-2020 0.25 United States
Watts Water Technologies Inc 11-Feb-2020 0.25 United States
Matson Inc 25-Feb-2020 0.24 United States
Panel B: Top-10 firms with highest Covid19Exposure in January
United Airlines Holdings Inc 22-Jan-2020 0.03 United States
Vinda Intl Hldgs Ltd 22-Jan-2020 0.01 Hong Kong
Keppel Corporation Ltd 23-Jan-2020 0.01 Singapore
Avnet Inc 23-Jan-2020 0.01 United States
American Airlines Group Inc 23-Jan-2020 0.01 United States
SThree 27-Jan-2020 0.01 United States
Dr Reddy’s Laboratories Ltd 27-Jan-2020 0.01 India
Sanmina Corp 27-Jan-2020 0.02 United States
Perkinelmer Inc 27-Jan-2020 0.05 United States
Whirlpool Corp 28-Jan-2020 0.02 United States
Notes: Panel A lists firms with the highest Covid19Exposure (×1000). Only
observations for which length > the sample mean are included. Panel B lists
the first ten firms discussing covid-19 in earnings calls held in 2020.
28Table 2: Covid-19-related Concerns and Opportunities expressed by Management
Category Perc. Transcript excerpt
Negative demand shock 43.5 the waterborne coatings tied especially to container shipping con-
tainers is still off because of the trade war now because the coro-
navirus is exacerbating that situation so demand is relatively soft
in china epichlorohydrin specifically i dont know george if you have
(Q4-2019 Hexion Inc, March 3, 2020)
Increased uncertainties 27.5 not a crystal ball to predict to what duration and to what extent
important markets will be affected by the coronavirus we have
to deal with the fact that our business has been already affected
significantly in china to a lesser (Q4-2019 Hugo Boss AG, March 5,
2020)
Supply chain disruption 27.0 been getting these questions im sure others have as well anything
we should be concerned or thinking about around the coronavirus
impact on potentially supplies of strips cuffs or devices no we have a
varied supply chain across the world and (Q4-2019 Livongo Health
Inc, March 2, 2020)
Production capacity reduc- 18.0 i turn it over to john i want to take a minute to talk about the recent
tion/retail store closures outbreak of the coronavirus in china similar to other companies
that operate in the region we are keeping our factory shut down
week longer (Q4-2019 Knowles Corp, February 4, 2020)
Concerns about employee 17.5 the economy was trending in a positive direction and seemed to be
welfare and labor market better until the most recent macro event the coronavirus briefly
dxp was developing programs to help keep our employees safe as
possible therefore keeping our customers exposure to a (Q4-2019
DXP Enterprises Inc, March 6, 2020)
Financial market/financing 2.5 lower it is important to reiterate that the thirdparty price used
concerns is not necessarily our expectation with respect to the coronavirus
that its having a significant global impact on everything from travel
to supply chain to the financial market we are (Q4-2019 IDH Fi-
nance PLC, March 5, 2020)
No impact 13.0 a very little amount thats happening in asia in january we didnt see
an impact to our business because of coronavirus we did see slight
softness in hong kong and australia but youre talking about since
asia is a relatively small (Q4-2019 WEX Inc, February 13, 2020)
Market opportunities 7.5 i think theres ways to look at this first is the chinese people as a
result of this kind of coronavirus they might actually heighten or
elevate the trust to reliability to japan or the japanese products so
including that that (Q4-2019 Shiseido Co Ltd, February 6, 2020)
Notes: We manually classified a total of 200 randomly selected covid-19-related excerpts (+/- 10 words around
the synonym for coronavirus or covid-19) into predefined categories. This table reports a breakdown per
category. Numbers in the column ‘Perc.’ denote percentages out of classified transcripts. We do not tabulate
a separate category of “unspecified” which includes the 18.5 percent of transcripts which have snippets that
while mentioning the coronavirus do not state an explicit related concern.
29Table 3: Covid-19-related Concerns and Opportunities expressed by Management by Month
2020
Jan Feb Mar Overall
Negative demand shock 42.42 37.31 50.75 43.50
Increased uncertainties 18.18 29.85 34.33 27.50
Supply chain disruption 12.12 35.82 32.84 27.00
Production capacity reductions/retail store closure 12.12 22.39 19.40 18.00
Concerns about employee welfare and labor market 15.15 10.45 26.87 17.50
No impact 6.06 14.93 17.91 13.00
Market opportunities 7.58 10.45 4.48 7.50
Notes: We manually classified a total of 200 randomly selected covid-19-related excerpts
(+/- 10 words around the synonym for coronavirus or covid-19) into predefined categories.
This table reports a breakdown per category by month separately for January, February
and March 2020, respectively. The numbers given denote percentages out of classified
transcripts in the respective month. We do not tabulate a separate category of “unspecified”
which includes the 18.5 percent of transcripts which have snippets that while mentioning
the coronavirus do not state an explicit related concern.
30Table 4: Summary Statistics
All firms US firms Non-US firms Total
Mean Median SD Mean SD Mean SD N
Panel A: Covid19 variables
Covid19NegativeSentiment 0.069 0.000 0.187 0.068 0.195 0.070 0.175 3,392
Covid19NetSentiment -0.040 0.000 0.164 -0.040 0.168 -0.042 0.158 3,392
Covid19Exposure 0.246 0.000 0.455 0.240 0.461 0.256 0.446 3,392
Covid19Risk 0.022 0.000 0.084 0.020 0.081 0.025 0.088 3,392
PriorEpid 0.865 0.000 4.044 1.129 4.746 0.487 2.697 3,392
Panel B: Other epidemic variables
Sars03Exposure 0.046 0.000 0.199 0.040 0.172 0.074 0.288 11,550
H1N1Exposure 0.017 0.000 0.153 0.015 0.142 0.019 0.173 17,687
Panel C: Firm specific variables
Total assets, log 8.418 8.297 2.126 8.031 1.874 8.990 2.337 3,351
Market beta 0.661 0.636 0.428 0.870 0.365 0.361 0.321 3,046
Notes: This table shows the mean, median, standard deviation, and the number of firms for the variables
used in the subsequent analysis. Columns 1 to 3 refer to the sample of all firms, Columns 4 and 5 to
the sample of US firms, and Columns 6 and 7 to the sample of non-US firms. Covid19NegativeSentiment,
Covid19NetSentiment, Covid19Exposure, and Covid19Risk are calculated, as defined in Section 2 and
multiplied by 1,000. All Covid19 variables are calculated using firms’ transcripts from the first quarter
in 2020. PriorEpid is the sum of SARSExposure (measured for calls held in 2003) and H1N1Exposure
(measured for calls held in 2009) by firm, multiplied by 1,000. Total assets per 2019 year-end are obtained
from Compustat. Market beta is calculated by regressing daily returns in 2018 for firm i on the SP500
index.
31You can also read