Yearly Technical Outlook 2022 - ICICI Direct

Page created by Robin Marsh
 
CONTINUE READING
Yearly Technical Outlook 2022 - ICICI Direct
Research Analysts:
                                                          Yearly Technical Outlook 2022
Dharmesh Shah
dharmesh.shah@icicisecurities.com

Nitin Kunte, CMT                    Ninad Tamhanekar, CMT                  Pabitro Mukherjee                   Vinayak Parmar
nitin.kunte@icicisecurities.com     ninad.tamhanekar@icicisecurities.com   pabitro.mukherjee@icicisecurities   vinayak.parmar@icicisecurities.com
Yearly Technical Outlook 2022 - ICICI Direct
Mega bull cycle on the anvil...

Technical Outlook                                                                               Nifty (17086)
Indian equities outperformed in CY21 riding a strong recovery post Covid lockdowns. In           Nifty - Weekly bar chart                                             Target @ 21000

                                                                                                                                                                                                                         2022
this report, we have deciphered the history of mega bull cycles over the past three                                                                                       12%

                                                                                                                                                                                                              Strategy –PICK
decades to construct our CY22 and beyond technical outlook.                                                                                                         18604
What we expect

                                                                                                                                                                                                        MOMENTUM
The Indian equities are in the initial phase of a multi year structural bull market post last                                                       8%
year’s resolute breakout above 2018 highs of 12400. Going by the history of three
decades, we expect the ongoing bull market to extend for the next few years with                                                                                               Support
                                                                                                                                                                 32%

                                                                                                                                                                                                    Technical
multifold gains. Our Nifty target for CY22 is 21000 based on classical chart reading and                                                                                      @ 15500
bottom up prognosis of Nifty constituents, wherein strong support exists at the 15500                                            9%
zone. While the midcap space is expected to extend its outperformance, we expect IT to                                                                           52 weeks
lead the rally supported by cyclicals like Capital goods, BFSI, Real Estate and Auto. Our                          10%                    35%
                                                                                                                                                                 EMA
thesis is based on the following key observations
 There have been three mega bull cycles in past 35 years, each measuring at least 2x
  price wise from major breakout and lasting for three to four years time wise. We                                        34%
  expect Nifty to head towards 24800 by CY24, based on empirical evidence                               7511
* In our 2018 outlook, we had focused on mega bull trend in Indian equities, wherein we                          32%
have envisaged target of at least 17600 by CY22 that has been achieved

                                                                                                                                                                                                   ICICI Securities – Retail Equity Research
 Ongoing bull cycle resembles the CY03-07 bull market on multiple counts:
    •   BSE200 index (dollar terms) breaking out of decadal consolidation similar to CY04        Techno-Funda Top Picks                                                Time Frame: 12 Months
    •   Relative performance ratio of Nifty equal weight index with Nifty50 (free float
        weight), which measures broad based nature of the rally, is on the cusp of              Scrip                            I-Direct Code   Market Cap   Buying Range    Target     Upside%
        reversal from multi-year downtrend, first instance since CY04                           HCL Technologies                 HCLTEC            3,44,038     1230-1285      1,485        17%
    •   Multiple sectoral indices like metal, capital goods, realty have managed to resolve     United Spirits                   UNISPI             64,249        850-910      1,080        22%
        out of 10-12 year long consolidation, indicating the structural turnaround and
        broad based nature of the ongoing bull cycle                                            ABB India                        ABB                46,559      2160-2240      2,750        25%

 Our in-house breadth indicator, which captures mega bull trends, has generated a              Aditya Birla Fashion and Retail ADIFAS              25,636        265-285       360         31%
  rare bullish signal only for the third time in two decades. Each of earlier two the           Indian Hotels                    INDHOT             23,738        170-182       238         34%
  signals (2004 and 2014) were followed by a multi year bull phase
                                                                                                SKF India                        SKFIND             17,995      3520-3700      4,700        29%
 Relative outperformance of Midcap Universe is in mid-cycle of multi year bull phase.
  We expect this outperformance to get further amplified
                                                                                                Jindal Stainless                 JINSTA              9,680        182-196       240         24%
                                                                                                Transport Corporation of India   TRACOR              5,491        680-740       950         34%
 Indian equities are expected to relatively outperform Emerging Markets as verified by
  multi year breakout on relative charts                                                        Gabriel India                    GABIND              1,897        128-136       175         33%
 Going by history, the US and Indian equities have continued their structural bull             * Market cap as per BSE as on 27th December 2021
  phases even in times of interest rate hikes in US starting 1993, 2004, 2015
                                                                                                *CY21 Performance - No. of Recommendations: 7 Strike rate: 100%              Average gain: 25%
 Source: Bloomberg, ICICI Direct Research
December 27, 2021                                                    ICICI Securities Ltd. | Retail Equity Research                                                                           1
Yearly Technical Outlook 2022 - ICICI Direct
Ride the mega bull trend…

                                   Major bull cycles over past three decades                                   Nifty - Monthly bar chart                       Target for CY24
                                            Time                                 Price
                                                                                                                                                                  @ 24800
                 Preceding                                  No. of                                   Rally
 Instruments                                                                                                                               Target for CY22 @ 21000
                 Correction         From               To   Months      From              To      (in times)

                                                                                                                                                                                           MOMENTUM PICK
Sensex              -39%           Oct-88          Apr-92     43         664             4,546        7
                                                                                                                                                              18604
Nifty               -49%           Dec-03          Jan-08     50        1,818            6,357        3
Nifty               -60%           Dec-13          Aug-18     57        6,357            11,760       2
                                                                                                                                                        40%
                                                                                                                                                   12430
Nifty               -40%          Nov-20           Oct-21     11        12,430           18,604       1
Minimum             -39%                                      43                                      2

   In the past three decades, there                                                                                 60%
    were three mega bull cycles in                                                                                                                         7511
    Indian equities, each preceded by                                                                               6357                            2x
    minimum 40% correction and
    transitory breach of long term
    200-week      moving      average,
    similar to CY20
                                                                                                                                           200 weeks

                                                                                                                                                                                     ICICI Securities – Retail Equity Research
   Subsequent mega bull markets                                                                                                           EMA
    extended     for   minimum    43
    months wherein the index gained
    minimum 2x after resolving out of
    the previous high, thereby                                                            49%
                                                                                1818                               3x      2539
    creating massive opportunity for
    investors with long term mindset
   As per Dow theory, when the
    previous high is taken out, new
    major trend emerges. Taking
    cognizance of history, we expect
    the ongoing bull cycle from CY20
                                                                                           920
    high of 12400 to continue over
    the next few years with potential
    Nifty target of ~24800 by CY24

 Source: Bloomberg, BSE India, ICICI Direct Research
December 27, 2021                                                          ICICI Securities Ltd. | Retail Equity Research                          Click here to go to top       2
Yearly Technical Outlook 2022 - ICICI Direct
…buy with conviction in transitory corrections as Nifty
headed for 21000 in CY22
  In a secular bull market,                  Nifty - Monthly bar chart                                                                          Target for CY22 @ 21000
   secondary correction is a                                                                                                                                   12%
   common phenomenon                                                                                                                                     18604

                                                                                                                                                                                         MOMENTUM PICK
                                              Projection of 21000 for CY-22 is based on:                                                                 8%
  Over the past two mega phases              • Since April 2020, magnitude of each major rally has been at least 30%. In
                                                                                                                                          15%                        Support
   spanning two decades, an                      current scenario, 30% rally from December low of 16410 will mature at 21300
                                                                                                                                                 12430               @15500
   average transitory correction                                                                                                        11171
   has been to the tune of 14%.                                                                                               25%
   Investing in such corrections                                                                                           9119                          9%
   and ignoring noise has been
   rewarding
                                                                          6357                   29%          18%                                 7511
  In a secular bull market, mean                                                         6338                                  6825
   reversion towards 52 weeks
   offers a buying opportunity                                                    16%
                                                                    16%
                                                             31%
  At current juncture, as 11%
                                                                                                  4531
   correction is behind us (from                            3774
   life high of 18600) investors
                                                                    `            19%

                                                                                                                                                                                   ICICI Securities – Retail Equity Research
   should focus on building a                                                                                                   18600           Key Support @ 15500
   quality portfolio in staggered                                                       Nifty - Weekly bar chart                                as it is:
                                                  36%                                                                                           • 61.8%% retracement
   manner from medium to long                                2596
   term perspective                                                                     Major rallies since                                         of last up move
                                             2015                            2252                                              32%                  (14151-18604)
                                                                                        April 2020
                                                                                                                                                • 52 week’s EMA at
                                                                                                                                                    15500
                                                                                                                    35%
                                                                                                                          52 weeks
                                                   1292                                                34%                EMA
                                                                                                 32%
                                            920

 Source: Bloomberg, ICICI Direct Research
 December 27, 2021                                        ICICI Securities Ltd. | Retail Equity Research                                         Click here to go to top       3
Yearly Technical Outlook 2022 - ICICI Direct
… also validated by bottom up approach

                                                                             The size of the bubble is the product of breadth and expected price performance
                                                                   85
                                                                                  Market Performer                                                                                                         Outperformer

                                                                                                                                                                                                                                                 MOMENTUM PICK
                                                                                                                                                                                 Bajaj
                                                                                                                                                                                Finserv
                                                                                                                                                                   Tech
                                                                                                                                          TCS
                                                                                                                                                                  Mahindra                    Tata
  Stocks from Outperformer and                                     80                                                                                   LT                                    Steel
  Bargain Buy quadrants, commanding                                                                             Sun
  total weightage of 60% are expected                                                                          Pharma        Divi's
                                                                                                                                    Asian                               Tata
  to deliver average returns in excess                                                                                     Laborat…                                                   Adani                                  JSW
                                                                                                                                    Paints                             Motors
  of 25%                                                                                                                                                                              Ports                                  Steel
                                                                   75                                                                                  Titan

                                                                   Breadth
                                                                                                               BPCL
                                                                                                                                      Bharti                    Reliance
                                                                                                                      Hindalco
                                                                                                                                      Airtel      HDFC
                                                                                                Cipla        Power
                                             Contribution 70                                                                                                                 SBI
               No. of Aggregate  Projected                                                                    Grid      Ultratech
 Category                                      to Nifty
               Stocks Weightage Avg. Returns                                                                            Cement
                                               (points)

                                                                                                                                                                                                                                           ICICI Securities – Retail Equity Research
Outperformer    17          50             27%            9,543
                                                                   65
Bargain Buy      8          10             25%            4,158                       Nestle                            Axis                                                          ONGC
                                                                                                                                    HDFC                       Kotak
                                                                                                                        Bank        LIFE        NTPC                   Indusind
  Market                                                                                                                                                       Bank
                16          32             16%            5,322                     HUL                                                                                  Bank
 Performer
                                                                   60                                                   Maruti                  Coal
  Neutral        9           8             9%             1,684                                                                                 India

                                      Nifty Target        20,707
                                                                                  Neutral                                                                                                                  Bargain Buy
                                                                   55
                                                                             5%                10%             15%                  20%                  25%                 30%                35%                    40%               45%

                                                                                                                                    Expected Return %
                                                                             Notes:
                                                                             • Y-Axis: The summation of the weekly positive candle and number of weeks closing above 52 weeks EMA in each of Nifty constituents.
                                                                             • X-Axis: The expected return of the Nifty Constituents calculated on the closing price of 23rd December 2021
   Source: Spider Software, nseindia.com, ICICI Direct Research
   December 27, 2021                                                                      ICICI Securities Ltd. | Retail Equity Research                                                              Click here to go to top        4
Yearly Technical Outlook 2022 - ICICI Direct
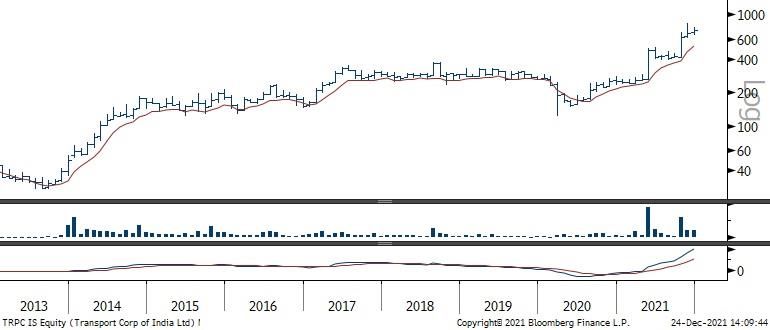
Ongoing bull run resembles CY03-07

  The BSE 200 index (in dollar              Nifty
   terms) has given a strong                                                     CY03-07
   breakout from decade long

                                                                                                                                              MOMENTUM PICK
   consolidation.              This
   development is significant for
   foreign investors as they are
   poised to benefit. Similar
   breakout was last observed in
   CY04, which then led to a
   strong multi year rally backed
   by incremental foreign inflows
                                            Dollex 200
  In another comparison with
   CY03-07, relative ratio of Nifty
   Equal weight index with Nifty50
   (free float based) is breaking
   out of multi year down trend.
   This development highlights

                                                                                                                                        ICICI Securities – Retail Equity Research
   broad based nature of current
   bull market, similar to 2003-07

                                            Equal Weight Nifty/ Nifty

 Source: Bloomberg, ICICI Direct Research
December 27, 2021                                        ICICI Securities Ltd. | Retail Equity Research   Click here to go to top   5
Yearly Technical Outlook 2022 - ICICI Direct
Rare bullish reading on breadth indicator signals multiyear
bull cycle
  Our in-house breadth indicator                        Nifty 500
   that measures market strength            16000
   on longer degree charts, has

                                                                                                                                                                                           MOMENTUM PICK
                                            14000                        Each of these rallies were supported by rare bullish
   generated a rare bullish signal                                       crossover that unfolded in multi year bull market
   (reading above 75) in CY21,              12000
   only for the third time in the
   last two decades                         10000

  Reading of 75 signifies that              8000
   index has managed to post
   positive close on monthly basis           6000
   75% of the times during trailing          4000
   12 months
                                             2000
  In the previous two instances of
   CY03 and CY14, an indicator                  0
   reading above 75 was followed                Nov-99   Nov-01      Nov-03     Nov-05      Nov-07      Nov-09      Nov-11       Nov-13   Nov-15        Nov-17        Nov-19    Nov-21
   by multiyear bull cycle

                                                                                                                                                                                     ICICI Securities – Retail Equity Research
                                                                                             Indicator surpassing key threshold of 75
  In the current context, post               100        Nifty 500 breadth
   crossover,       the     indicator
   continues to sustain exhibiting             90
   strength and supports the
   structural bullish stance                   80

                                               70

                                               60

                                               50

                                               40

                                               30

                                               20
                                                Nov-99   Nov-01      Nov-03      Nov-05     Nov-07      Nov-09       Nov-11      Nov-13   Nov-15        Nov-17         Nov-19   Nov-21

 Source: Bloomberg, ICICI Direct Research
 December 27, 2021                                         ICICI Securities Ltd. | Retail Equity Research                                          Click here to go to top      6
Yearly Technical Outlook 2022 - ICICI Direct
Midcaps: outperformance to get amplified..

  We          expect      relative                                                                                                Midcap ratio is leading the
   outperformance of midcap and                    Mid cap Index / Nifty                                                           broader market outperformance
                                            2.0
   small cap universe to extend in

                                                                                                                                                                         MOMENTUM PICK
   the coming year going by
   historical evidence.
  As seen in earlier two
   instances, the outperformance
   cycle of Midcaps progress for a
   few years post falling channel           1.5
   breakout,    initially led  by
   Midcaps and then followed by
   Small caps.
  Further, each cycle witnessed
   ratio challenging previous cycle
   high. In the current cycle, post         1.0
   CY20 breakout, we are still                Nov-05         Nov-07         Nov-09        Nov-11        Nov-13   Nov-15   Nov-17            Nov-19          Nov-21

                                                                                                                                                                   ICICI Securities – Retail Equity Research
   midway to challenging the
   CY18 peak
                                                  Small cap Index / Nifty
                                            1.0                                                                              Ratio is at the midway of
                                                                                                                             challenging CY18 peak
                                            0.9

                                            0.8

                                            0.7

                                            0.6

                                            0.5

                                            0.4
                                              Nov-05         Nov-07         Nov-09        Nov-11        Nov-13   Nov-15   Nov-17            Nov-19         Nov-21
 Source: Bloomberg, ICICI Direct Research
December 27, 2021                                              ICICI Securities Ltd. | Retail Equity Research                 Click here to go to top       7
Yearly Technical Outlook 2022 - ICICI Direct
Midcap index in sync with global peers…

                                            Nifty 500
        Historically, Indian equities
         have rallied in each of bull
         run in tandem with global

                                                                                                                                                 MOMENTUM PICK
         peers     exhibiting   strong
         positive correlation. E.g. In
         CY03-07 bull cycle equity
         markets globally were in
         secular bull trend
                                            Russell Midcap Index
        We expect this relationship to
         continue as even present bull
         cycle in Indian equities post
         CY20 is in sync with major
         developed and Emerging
         markets
        It is noteworthy that similar to
         multi     year   breakout     in   STOXX Europe Mid 200

                                                                                                                                           ICICI Securities – Retail Equity Research
         NIfty500 last year, Russell
         Midcap (US), Stoxx Europe
         Mid200 and Topix Mid400
         have all posted a multi year
         breakout

                                            TOPIX Mid 400

 Source: Bloomberg, ICICI Direct Research
December 28, 2021                                           ICICI Securities Ltd. | Retail Equity Research   Click here to go to top   8
Yearly Technical Outlook 2022 - ICICI Direct
Indian equities to relatively outperform emerging markets

  MSCI India relative to MSCI EM           MSCI India Index vs MSCI Emerging Market - ratio line chart
   has registered a breakout above
   a five year range highlighting

                                                                                                                                                                                     MOMENTUM PICK
   strength in the Indian market
   over other Emerging market
   peers. A similar range breakout
   in    CY04     &    CY12    saw                        A breakout from multi-year range has resulted in
   outperformance by MSCI India in                        outperformance of MSCI India in the next couple of years
   the next couple of years

                                                                                                                                                                               ICICI Securities – Retail Equity Research
                                                                                                                     MSCI India Index to MSCI Emerging market
                                                                                                                     index is breaking above five year’s range
                                                                                                                     highlighting India outperformance to continue

 Source: Bloomberg, ICICI Direct Research
 December 27, 2021                                           ICICI Securities Ltd. | Retail Equity Research                                      Click here to go to top   9
Fed rate hike not to distort longer term trend…

  There has been a lot of noise                      5000    Fed Rate                                                                                                    9
   about potential rate hike in the                           S&P 500
   US. The perceived notion is

                                                                                                                                                                                               MOMENTUM PICK
                                                                                                      Over the past three decades, despite upsurge
   that rising interest rate is                       4500                                                                                                                8
                                                                                                      in interest rate equities have seen decent rally
   negative for equity
  However, contrary to perceived
                                                      4000
   wisdom, the empirical evidence                                                                                                                                         7
   displays a divergence in facts.
   In the last three cycles (as
                                                      3500
   shown in adjoining chart), the
                                                                                                                                                                          6
   S&P 500 index has rallied
   despite interest rate hike by the
                                                      3000
   Federal Reserve
                                                                                                                                                                          5
  During the same phase, Indian

                                                                                                                                                                              FED Rate
                                            S&P 500

   equities remained in a positive                    2500
   trend in tandem with the US

                                                                                                                                                                                         ICICI Securities – Retail Equity Research
   market                                                                                                                                                                 4
                                                      2000

                                                                                                                                                                          3
                                                      1500
                                                             Rate hike
                                                             during 1993
                                                                                                                                                                          2
                                                      1000                                                                         Rate     hike
                                                                                                                                   during 2015

                                                       500                                                                                                                1
                                                                                                      Rate hike
                                                                                                      during 2004
                                                         0                                                                                                                0

 Source: Bloomberg, ICICI Direct Research
 December 27, 2021                                           ICICI Securities Ltd. | Retail Equity Research                                     Click here to go to top       10
MOMENTUM PICK
                    Top Picks CY22

                                                                                                     ICICI Securities – Retail Equity Research
December 27, 2021    ICICI Securities Ltd. | Retail Equity Research   Click here to go to top   11
HCL Technologies(HCLTEC): Secular uptrend to bolster stock

                  Technical Outlook                 Rec. Price           1230.00-1285.00              Target                1485.00                   Upside                         17%
•      The     IT    sector    has    been
                                               Monthly Bar Chart                                                                                                    Target @ 1485

                                                                                                                                                                                                      MOMENTUM PICK
       spearheading the ongoing bull run
       and HCL Technology has been in a                                                                                                                                1377
       steady secular uptrend post its
       multi year breakout in CY20 (| 618)
                                                                                                                    Breakout from multi
•      Post breakout uptrend is well                                                                                 year consolidation                                       1090
       defined by stronger rallies, shallow
       retracements, key ingredient of                                                                                                                           891
       major bull phase. During this phase                                                                                                618
       incremental buying demand is
       getting attracted at five month                                                                                                                     5 month average
       average, held since May 2020 and
       even in recent correction
                                                           Monthly RSI sustains above its bull market trajectory (40) and generated positive cross over on monthly chart
•      We expect stock price to extend its
       bull trend and head towards | 1485

                                                                                                                                                                                                ICICI Securities – Retail Equity Research
       as it is 138.2% external retracement
       of recent correction (|1377-1090)

                                                                                                                                                                       Time Frame: 12 Months
                                                                             Fundamental Outlook
 •     HCL Tech is an IT service and product company catering to various segments like banking & insurance (~22% of revenues), manufacturing (~17%), technology
       & services (~17%), lifesciences & healthcare (~14%)
 •     Geographically, the company generates ~63% revenues from Americas, ~28% from Europe and ~9% from RoW. In terms of revenue breakup, services wise,
       IT services contribute 72% of the revenue,15% from ER&D while products form 13% of the revenue mix
 •     The company is well positioned to deliver strong growth in IT services and ER&D space due to i) improving TCV ii) broad based nature of growth across services
       iii) improving client metrics and strengthening of management capabilities in Australia, Canada, France, Germany, etc
 •     The weakness in the P&P (product) business is behind now. It is expected to recover in the coming quarters. We remain positive on the stock

    Source: Bloomberg, ICICI Direct Research
    December 27, 2021                                              ICICI Securities Ltd. | Retail Equity Research                                                                          12
United Spirits (UNISPI): Getting high, post six year ageing…

                  Technical Outlook                  Rec. Price              850.00-910.00                Target                  1080.00                 Upside                     22%
•      Liquor stocks posted a strong
                                                Quarterly Bar Chart                      6 year range breakout puts stock into higher orbit                             Target @ 1080

                                                                                                                                                                                                      MOMENTUM PICK
       recovery in CY21 leading their way
       to new highs scripting turnaround                                           816                                      801
       on long term charts. United Spirits’
       price has resolved out of its six year
       consolidation phase (| 800-450)
       signalling structural turnaround and
       new bull cycle ahead                                                                                                            438              442
•      We expect the stock price to head                                                                   355
       towards | 1080 as it is 161.8%
                                                                                                                       As per change of polarity concept, multi year consolidation
       external retracement of entire six
                                                                                                                       breakout area of |800 is expected to act as support
       year range (| 816-355)
•      MACD oscillator has generated
       crossover above its nine period                                             MACD generated cross over above its long term average for first time in 5 years signaling strength
       average on a quarterly time frame

                                                                                                                                                                                                ICICI Securities – Retail Equity Research
       signalling strong momentum over
       the medium term

                                                                                                                                                                        Time Frame: 12 Months
                                                                                Fundamental Outlook
 •     United Spirits (USL) is India’s leading alcoholic beverage company and subsidiary of global leader Diageo plc. It manufactures and sells premium liquor brands
       such as Johnnie Walker, Black Dog, Black & White, Vat 69, Antiquity, Signature, Royal Challenge, McDowell’s No 1, Smirnoff and Captain Morgan
 •     Prestige and above (premium) segment comprises 67% of its revenues. It aims to grow its revenues in double digits and expects its operating margin to remain
       in mid to high-teen levels in the medium term
 •     Better product mix and higher RoI brands are expected to drive EBITDA performance leading to double-digit return ratios & strong cash generation. Newer
       distribution channels (e-commerce), portable packaging (Hipster) are expected to provide a connect with the young customer base
 •     With its broad portfolio and focus on placing existing brands in the upper prestige segment, along with introduction of its several iconic brands from Diageo
       stable, USL is well placed to capitalise on the rapidly growing premiumisation trend in the sector. We remain positive on the long term growth prospects of the
       stock
    Source: Bloomberg, ICICI Direct Research
    December 27, 2021                                                 ICICI Securities Ltd. | Retail Equity Research                                                                       13
ABB (ABB): Decade long range breakout spells new bull cycle…

                  Technical Outlook                 Rec. Price              2160.00-2240.00               Target               2750.00                   Upside                  25%
•      The BSE capital good index is
                                               Monthly Bar Chart                                                                                                    Target @ 2750

                                                                                                                                                                                                   MOMENTUM PICK
       coming out of 13 year’s hibernation                                  Decade long consolidation breakout supported by faster retracement of the last
       exhibiting strength. Within capital                                  falling segment
       goods      space,    we      remain                                                                                                 1495
                                                   1537
       constructive on ABB as it has
       already logged a breakout above
       decade long consolidation and
       continues to trend higher while
       maintaining a higher high-low
                                                                                                                                               Faster             722
•      It witnessed a faster retracement of                                                                        12 Months
       the last falling segment as the nine                                                                           EMA                   Retracement
                                                                                                                                                               Support @ 1850
       quarter decline (| 1495-722) was                                                                                                                        - Rising trendline
       completely retraced in just four                                                                368                                                     - 12 months average
       quarters                                                  294

•      We expect it to head higher                                                          Monthly RSI remain in up trend while holding above its nine periods average

                                                                                                                                                                                             ICICI Securities – Retail Equity Research
       towards | 2750 as it is the
       measuring implication of entire
       range breakout (| 1537-294)
                                                                                                                                                                     Time Frame: 12 Months
                                                                                 Fundamental Outlook
•      ABB India (ABB) is an Indian subsidiary (75%) of Swedish-Swiss based global company ABB Ltd. ABB’s key business segment includes electrification products
       (switchgears, solar inverters, EV chargers)(41% of revenue), robotics and motion (industrial robots, drives, motors, generators) (38% of revenues) and industrial
       automation (process automation, enterprise solutions) (22% of revenue) serving customers in utilities, industry and transport & infrastructure
•      ABB continues to see a recovery in certain segments and industries like datacentre, renewables, electronics, food & beverages and pharma. It continues to focus
       on order win and seamless execution across projects
•      Expect revenue, EBITDA to grow at CAGR of ~18.8%, 28.5%, respectively, in CY21E-23E due to strong traction in short cycle products and services
•      Further penetration of automation & digitisation products and services across segments to drive long term growth. Hence, we remain long term positive on the
       stock

    Source: Bloomberg, ICICI Direct Research
    December 27, 2021                                                  ICICI Securities Ltd. | Retail Equity Research                                                                  14
Aditya Birla Fashion & Retail (ADIFAS): Changing orbit…

                  Technical Outlook                 Rec. Price            265.00-285.00               Target               360.00                    Upside                31%
•      The stock has recently generated a                                                                                                                        Target @ 360
                                               Monthly Bar Chart              Breakout above six years range backed by faster retracement of the entire

                                                                                                                                                                                             MOMENTUM PICK
       resolute breakout above its last six
       year’s range (| 258-88) as it                                          decline signals start of a new bull phase
                                                                   238                                                                258
       resolved above the long term rising
       supply line joining the highs of
       CY16 (| 238) and CY20 (| 258)
       signalling start of a new bull phase
•      It   has    witnessed   a    faster
                                                                                                                                                              Support @ 245
       retracement of the entire 52
                                                                                                                                                              - Breakout area
       month’s corrective decline (| 258-                                                                                 Faster                              - Last        two
       88) in just 18 months signalling a                                                                              Retracement              88               months lows
       robust price structure
•      We expect the thrust from the                                                      Recent price rise and the breakout is supported by strong volume
       recent breakout to lead the share
       price to | 360 in coming months as                                      Monthly RSI is seen rebounding taking support at its nine periods average

                                                                                                                                                                                       ICICI Securities – Retail Equity Research
       it is 161.8% external retracement of
       the entire previous major decline
       CY20 (| 258-88)
                                                                                                                                                              Time Frame: 12 Months
                                                                             Fundamental Outlook
•      ABFRL combines Madura’s portfolio of leading power brands (Allen Solly, Van Heusen, Louis Philippe and Peter England) with Pantaloons’ forte of largest value
       fashion retailer. The company has a robust distribution network having, 2874 brand stores, along with 342 Pantaloons stores. Madura contributes ~60% of
       revenues, while Pantaloons derives 40%
•       The company has charted out growth strategies to become a ~US$2.8 billion entity (| 21000 crore) by FY26E, translating to 15% CAGR in FY20-26E. It has
       enhanced focus on ethnic wear segment (through its recent acquisitions). Furthermore, it has recently forayed into sports and active wear segment through
       acquiring licencing rights to sell Reebok products in India
•      ABFRL has aggressive store addition plans for FY22E with 60+ Pantaloons store and 400+ lifestyle brand stores. Besides, it has a target of opening 100
       Pantaloons stores annually over the medium term
•      ABFRL has strengthened its balance sheet through recent equity infusion with net debt declining sharply from | 2500 crore to ~| 870 crore. We believe ABFRL
       with lighter balance sheet and strong bouquet of brands is well placed to accelerate the pace of store addition and revenue growth. We remain structurally
       positive on the stock
    Source: Bloomberg, ICICI Direct Research
    December 27, 2021                                              ICICI Securities Ltd. | Retail Equity Research                                                                 15
Indian Hotel (INDHOT): Structural turnaround…

                  Technical Outlook                  Rec. Price              170.00-182.00               Target                 238.00                        Upside                     34%
•      The hospitality sector witnessed
                                                Quarterly Bar Chart               A resolute breakout above rising supply line joining highs of the last 15
                                                                                                                                                                             Target @ 238

                                                                                                                                                                                                          MOMENTUM PICK
       renewed buying interest in the last
       year. Within hospitality space Indian                                      years signals a structural turnaround
                                                                                                                                                               158
       Hotel has remained a clear outlier                                 121
       as it resolved out of 15 year long
       rising   supply     line,  indicating
       structural turnaround that augurs                                                                                                                                               91
       well for multi year up trend                                                                                                                                    70
•      The breakout above the long term                                                                                                         Support @ 145 as it is confluence of:
       supply line is supported by all time                                                                            31                       - The value of the rising demand line
                                                                                     28
       high volumes of more than double                                                                                                         - 61.8% retracement of the major up
       the 10 quarter’s average volume of                                                                                                          move (| 91-229)
       23 lakh shares per quarter
                                                                                                                  Breakout supported by strong volume
•      The last two month’s breather
       towards the major breakout area

                                                                                                                                                                                                    ICICI Securities – Retail Equity Research
       provides fresh entry opportunity for                                                                Quarterly MACD has generated a buy signal
       target of | 238 as it is the measuring
       implication of entire range breakout
       (| 158-70)
                                                                                                                                                                            Time Frame: 12 Months
                                                                                Fundamental Outlook
•      Indian Hotels (IHCL) with room inventory of 19,425 rooms, is a diversified player in the hotel industry through brands such as Taj, Vivanta, SeleQtions and
       Ginger. It also has a select presence in the luxury segment in the US, the UK, Africa, Sri Lanka, the UAE and Maldives through owned/managed properties
•      The ongoing pandemic would likely restrict overall room supply in the industry that augurs well for branded players like Indian Hotels from a three to four year
       perspective
•      We expect the business to recover to 97% of pre-Covid levels with EBITDA surpassing pre-Covid levels by FY23E; margins are seen at over 24% in FY23E vs.
       21% in FY20, which has the potential to further expand to 30%
•      The recent equity infusion through rights issue and divestment of non-core assets would help the company become debt free going forward. Hence, we remain
       positive on the stock

    Source: Bloomberg, ICICI Direct Research
    December 27, 2021                                                 ICICI Securities Ltd. | Retail Equity Research                                                                           16
SKF India (SKFIND) : Bearing fruits of secular uptrend…

                  Technical Outlook                   Rec. Price           3520.00-3700.00               Target               4700.00                  Upside                       29%
•      The capital goods sector continues
                                                 Monthly Bar Chart                                                                                                  Target @ 4700

                                                                                                                                                                                                     MOMENTUM PICK
       to outperform over the last few
                                                                                                   Breakout above long term rising supply line
       months after breaking above 13
                                                                                                        signals acceleration of up move
       years long consolidation. SKF India
       is our top pick among midcap                                                                                                      2317
       capital goods. It has witnessed                                                                     1969                                                    2512
       steady uptrend post its multi year                      1540
       breakout in June 2021 (| 2602)
•      Post breakout, uptrend is well                                                                                                       1230
                                                                                                                                                    5 month average has acted as
       defined by higher high-low in long                                                                                                            strong support in the entire
       term chart and stronger rallies and                                                                                                            rally since November 2020
       shallow       retracements,       key
       ingredient of structural bull phase
•      We expect the stock to resume up                                                           Price rally and breakout is supported by strong volume
       move and head towards | 4700

                                                                                                                                                                                               ICICI Securities – Retail Equity Research
       levels as it is the price parity of the
       previous major up move (|3057-
       4164) as projected from the recent
       trough of | 3520                                                                                                                                           Time Frame: 12 Months
                                                                                Fundamental Outlook
•      SKF India is one of the leading bearing manufacturers in India known for its deep grove ball bearings and has a presence across industrial & auto segment. It has
       three manufacturing facilities across India and has product portfolio that includes mounted bearings and housings, super-precision bearings, slewing bearings,
       industrial and automobile seal. It has almost equal presence in OEMs and aftermarket (both 50% each) while ~95% of revenues come from sales of
       manufactured goods and 5% from sales of services
•      Geographically, 90% of revenues comes from domestic market and 10% from exports. Segment wise, it generates 45% revenue from auto, and 55% from
       industrial manufacturing
•      We expect the company to continue to make a steady improvement in financials in coming quarters due to the fact that industrial manufacturing and
       automobiles sales are expected to grow. Apart from that, the company is also making strides into digital sales, which reduces sales time and enable the
       company to reach wider customers and reduces counterfeit products. It is also focusing on opportunities that are available in electric 2-W segment
•      We build in revenue, EBIDTA, PAT CAGR of 21.4%, 20.8%, 21%, respectively. Further, SKF boasts of a debt free balance sheet, coupled with consistent RoCE &
       RoICs upwards of 20% and has maintained healthy cash flow generation and has a consistent dividend payout policy. Hence, we remain positive on the stock
    Source: Bloomberg, ICICI Direct Research
    December 27, 2021                                                 ICICI Securities Ltd. | Retail Equity Research                                                                      17
Jindal Stainless (JINSTA): Rising from decade long hibernation…

                  Technical Outlook                   Rec. Price              182.00-196.00               Target                240.00                     Upside                       25%
•      The share price of Jindal Stainless
                                                 Quarterly Bar Chart                                        Price moving above multiple year highs with elevated            Target @ 240

                                                                                                                                                                                                         MOMENTUM PICK
       has remained resilient within the
       metal stocks. It has entirely retraced                                                               buying demand at the long term rising demand line
       past 10 quarter decline (|132-21) in
                                                                                                                                                     132
       just 6 quarters and is seen
       sustaining    above      the    same,
       highlighting     turnaround       after                                                                                                                                    105
       decade long consolidation
                                                                                                                                                                             43
•      The stock has managed to hold
       above upward sloping support
       trend line joining lows since June                                                                                                                              21
       2020, highlighting elevated buying                                                                                                          Faster
       demand that signifies inherent                                                                                                           Retracement
       strength
                                                                                                    Quarterly MACD in strong up trend diverging from its nine periods average
•      We expect the stock to maintain its

                                                                                                                                                                                                   ICICI Securities – Retail Equity Research
       relative outperformance and head
       towards its all-time high of CY08
       around | 240 levels in the coming
       year                                                                                                                                                          Time Frame: 12 Months
                                                                                 Fundamental Outlook
•      Jindal Stainless (JSL) is India’s largest stainless steel manufacturer. JSL operates an integrated stainless steel plant at Jajpur, Odisha. The complex has a total
       stainless steel capacity of 1.1 million tonnes per annum (MTPA). JSL has readily leveragable infrastructure for cost efficient brownfield expansion (800+ acre of
       land)
•      JSL’s stainless steel plant in Jajpur, Odisha is strategically located 16 km from the national highway, 30 km from the Sukinda chrome ore mines and ~110-130
       km from Paradip and Dhamra ports
•      JSL is augmenting is stainless steel melt capacity from 1.1 MTPA to 2.1 MTPA and also enhancing downstream capacity with 1.6x expansion of hot rolled
       annealed pickled (HRAP) from 0.8 MTPA to 1.25 MTPA and 1.7x expansion of cold rolled annealed pickled (CRAP) from 0.45 MTPA to 0.75 MTPA. It is also
       expanding backward integration with 1.4x expansion of ferro chrome from 0.25 MTPA to 0.35 MTPA
•      For JSL, the Jajpur brownfield expansion plan will leverage ready availability of world class infrastructure at Jajpur, such as land, roads, railways, utilities, etc
    Source: Bloomberg, ICICI Direct Research
    December 27, 2021                                                  ICICI Securities Ltd. | Retail Equity Research                                                                         18
Transport Corporation of India (TRACOR): Elongation of rallies
signifies acceleration…
                  Technical Outlook               Rec. Price32              680.00-740.00                Target               950.00                   Upside                    34%
•      The      logistic    sector     has                                                                                                                          Target @ 950
       outperformed during CY21. Within        Quarterly Bar Chart                                                                          Five years range

                                                                                                                                                                                                  MOMENTUM PICK
       logistic    space     we     remain                                                                                                      breakout
       constructive on TCI based on                                                                       388                  375
       following technical observations:
                                                                                                                                                                       388
•      Since CY20 lows, rallies are getting
       elongated followed by shallow
       correction while sustaining above                                                           143                                             122
       five month’s EMA, highlighting
       robust price structure. In the                                                                                                        Support @ 610 as it is :
       process, it     logged a resolute                                                                                                     - 50% retracement (| 388-838)
       breakout from five years range (|                                                                                                     - November low is placed at | 614
       388-122), indicating acceleration of                                                              Multi year range breakout on the back of robust volumes
       upward momentum that augurs
       well for extension of ongoing rally
                                                  Monthly MACD inching northward while diverging from its nine period average, indicating acceleration of upward momentum

                                                                                                                                                                                            ICICI Securities – Retail Equity Research
•      We expect the stock to extend the
       current rally and head towards
       | 950 levels in the coming year as it
       is the implied target of recent
       consolidation (| 800-650)                                                                                                                                    Time Frame: 12 Months
                                                                               Fundamental Outlook
•      TCI is a leading provider of integrated multimodal logistics and supply chain solutions. The company has over six decades of experience and moves nearly
       2.5% of India's GDP by value. TCI has 9000+ trucks in operation, six owned coastal ships, 12 million square feet warehousing space and 900 offices. In FY21,
       freight formed 52% of revenues while SCM and coastal shipping contributed 34% and 14%, respectively
•      TCI captures higher wallet share of its customers by providing diversified range of services via a single window. The variety of services also helps TCI to ride
       over volatile periods
•      Debt levels are substantially down from previous D/E of 0.22 in FY21 to current 0.07 in H1FY22. Strong fundamentals (b/s, CF) together with improvement in
       margins and higher asset turnover, are expected to push return ratios to 16-17% in FY23 (from 12-14% range over FY19-FY21)
•      TCI has been delivering exceptional results for the last few quarters and has been the beneficiary of rising surface and ocean freight charges. With unlocking of
       the economy, we expect earnings momentum to continue in the foreseeable future. We remain positive on the long term growth prospects of the stock
    Source: Bloomberg, ICICI Direct Research
    December 27, 2021                                                ICICI Securities Ltd. | Retail Equity Research                                                                    19
Gabriel India (GABIND): Placed at key support

                  Technical Outlook                 Rec. Price            128.00-136.00               Target                   175.00                     Upside                   33%
•      The auto ancillary space continued
                                               Monthly Bar Chart                            222 Base formation at the lower band of the rising channel and 12 months EMA

                                                                                                                                                                                                    MOMENTUM PICK
       its primary up trend. Technically,
                                                                                                offers fresh entry opportunity with favorable risk reward set up         Target
       we are constructive on Gabriel
                                                                                                                                                                  168    @ 175
       India, which we expect to
       outperform in the coming year
                                                                                                                                                 127
•      The stock is currently placed near
       the key support area of | 125-130
                                                                                    12 months                                                                      96
       being the confluence of rising 12
       months EMA (currently at | 130)                                                 EMA
                                                                                                                                                     75
       and the lower band of the rising
       channel in place since June 2020,                                                                                                          Placed at the 12 months EMA and
       thus offering entry opportunity with                                                                                                       the lower band of the rising channel
       favourable risk reward set up                                                                                                        40    in place since June 2020
•      We expect the stock to resume up                                                                             Monthly MACD in rising trend thus supports the positive bias
       move and head higher towards

                                                                                                                                                                                              ICICI Securities – Retail Equity Research
       | 175 in coming quarters as it is the
       upper band of the rising channel.

                                                                                                                                                                    Time Frame: 12 Months
                                                                             Fundamental Outlook
•      Gabriel India (GIL) is a global top-10 shock absorber (suspension product) manufacturer serving 2-W/3-W, PV, CV, railway and aftermarket segments. Its FY21
       revenue mix was at ~67% 2-W/3-W, ~21% PV, ~12% CV & railways. As of H1FY22, GIL commands a market share of ~25% in 2-W/3-W space, ~21% in PV
       and ~75% in CV & railways
•      GIL’s product profile is EV proof with the company already present with EV players in 2-W/3-W space and is currently the sole supplier of suspension products
       for Ola Electric
•      With ~83% of revenues being derived from the OEM channel and CV space on the cusp of cyclical revival, we build in 16.3% net sales CAGR over FY21-23E.
       PAT CAGR in the similar timeframe is placed at 38.2%, building in 220 bps improvement in EBITDA margins to 8.5% by FY23E. It has a healthy balance sheet
       with net cash surplus of ~₹ 250 crore and trades at inexpensive valuation of ~17x P/E on FY23E EPS. We have a position view on the stock

    Source: Bloomberg, ICICI Direct Research
    December 27, 2021                                              ICICI Securities Ltd. | Retail Equity Research                                                                        20
Performance Scorecard

          CY21 Performance
          Rec. Date    Stock Recommended                     Rec Price (|)      Target (|) % Profit/Loss Comment

                                                                                                                                                                           MOMENTUM PICK
          22-Dec-20              Can Fin Home                          465              580             27.0 Target Achieved
          22-Dec-20              Timken                               1103             1360             23.0 Target Achieved
          22-Dec-20              Relaxo                                790              985             31.0 Target Achieved
          22-Dec-20              Infosys                              1225             1410             15.0 Target Achieved
          22-Dec-20              United spirit                         545              660             12.0 Booked profit at 630
          22-Dec-20              Bharat Electronics                    113              158             40.0 Target Achieved
          22-Dec-20              Dr Lal path labs                     2207             2840             28.0 Target Achieved

          Yearly Technical Performance Since 2013
          Year                                        2021     2020    2019     2018     2017     2016      2015     2014      2013

                                                                                                                                                                     ICICI Securities – Retail Equity Research
          Avg return on positive calls (in %)         25        3       18       26       28      25         33       27       23
          Avg. Strike Rate                            100%     14%      71%      57%      100%    50%       100%     100%      64%
          No of Calls                                  7        7        7        8           8    8          9        9       12
          *Average Strike rate over past 9 years is 73%

                                                                                                                                      Click here to go to top
 Source: ICICI Direct Research
December 27, 2021                                                             ICICI Securities Ltd. | Retail Equity Research                                    21
MOMENTUM PICK
                    Appendix

                                                                          ICICI Securities – Retail Equity Research
December 27, 2021   ICICI Securities Ltd. | Retail Equity Research   22
Magnitude of average secondary corrections over past
two decades is -14%

                                                                                                                                                                                                  MOMENTUM PICK
                                                             Nifty Index: Magnitude of secondary Corrections over past two decades
                                 Time               No. of           Price              Correction            Time            No. of           Price                Correction
                         From                To     Months    From            To           (% )       From            To      Months   From             To             (% )
                        Sep-03             Sep-03     1       1431           1285         -10.20     Feb-12      May-12         4      5629            4770             -15
                        Oct-03             Oct-03     1       1574           1435         -8.80      Oct-12          Oct-12     1      5815            4888             -16
                        Jan-04             May-04     4       2015           1292         -35.90     Feb-13          Apr-13     2      6112            5477             -10
                        Jan-05             Jan-05     1       2120           1894         -10.70     May-13          Aug-13     4      6229            5118             -18
                        Mar-05             Apr-05     2       2183           1896         -13.10     Mar-15          Feb-16     12     9119            6825             -25
                        Oct-05             Oct-05     1       2669           2307         -13.60     Sep-16          Dec-16     4      8968            7893             -12
                        May-06             Jun-06     2       3774           2596         -31.20     Jan-18          Mar-18     3      11171           9952             -11
                        Jul-06             Jul-06     1       3209           2878         -10.30     Sep-18          Oct-18     1      11760           10005            -15
                        Dec-06             Dec-06     1       4047           3658         -9.60      Jun-19          Aug-19     2      12103           10637            -12

                                                                                                                                                                                            ICICI Securities – Retail Equity Research
                        Feb-07             Mar-07     1       4245           3554         -16.30     Apr-20      May-20         1      9889            8807             -11
                        Jul-07             Aug-07     1       4648           4002         -13.90     Apr-20          Apr-20     1      9889            8807             -11
                        Oct-07             Oct-07     1       5737           5070         -11.60     Jun-20          Jun-20     0      10328           9544              -8
                        Nov-07             Nov-07     1       6012           5394         -10.30     Sep-20          Sep-20     0      11794           10790             -9
                        Jan-09             Mar-09     2       3147           2539         -19.30     Jan-21          Jan-21     0      14753           13597             -8
                        Jun-09             Jul-09     2       4693           3918         -16.50     Feb-21          Apr-21     1      15431           14151             -8
                        Nov-09             Nov-09     2       5181           4538         -12.40     Oct-21          Dec-21     2      18604           16782            -10
                        Jan-10             May-10     5       5310           4675         -12.00
                                                                                                                                                   Average              -14

Source: Bloomberg, ICICI Direct Research
December 27, 2021                                                    ICICI Securities Ltd. | Retail Equity Research                                          Click here to go to top   23
Stock selection: Deciphering the bottom-up way…

 Over the past few years, our emphasis on building a statistical model for stock selection, based on our in-house technical screeners, has provided rich dividends.
 Year on year, we have strengthened our parameters to adapt to changing market dynamics. The virtues of such a statistical approach are:

                                                                                                                                                                                           MOMENTUM PICK
 (a) removing individual biases in stock picking; (b) efficient screening of market internals, which helps to build a holistic bottoms-up approach;

 (c) achieving more objectivity in market analysis to arrive at high probability investment ideas

                                            Technical
     Define Universe                        Screening                              Bucketing                       Optimisation                    Top Picks CY22

                                                                  Step 2 1

                                                                                                     Step 31

                                                                                                                                     Selection 1
                             Step 1 1

                                                                                                                                        Final

                                                                                                                                                                                     ICICI Securities – Retail Equity Research
                                                                                                                   116 stocks
                                                                                                                                                    Top Picks CY22:
                                                                                170 stocks
                                                                             -   Outperformers: Robust         -    Insights on Sectoral           HCL Technologies
                                            170 stocks                          price structure                    views                          United Spirits
     849 NSE stocks                    -    Relative Strength,                                                -    Risk/Rewards set up            ABB India
 -    Average daily                                                          -   Structural Turnaround:
                                             Momentum                            from elongated period of      -    Volatility                     Aditya Birla Fashion and Retail
      volume >5k                        -    Trend and volume                                                  -    Peer comparison                Indian Hotels
 -    Market Capital > 100                                                       underperformance
                                             analysis                        -   Market Performer                                                  SKF India
      Crores                            -    Qualitative and                                                                                       Jindal Stainless
 -    Minimum 1 year price                                                   -   Performance in tandem
                                             compliance filters                  with benchmark                                                    Transport Corporation of India
      history                                                                                                                                      Gabriel India
                                                                             -   Bargain Buys:
                                                                                 Price/Time correction
                                                                                 done
 December 27, 2021                                                ICICI Securities Ltd. | Retail Equity Research                                                               24
…Stock selection: Bottom up way

                                                                            Market Capital       Returns       Returns                    Structural
    NSE Symbol               Company Name                    Idirect Code                                                 Outperformer                 Market Performer   Bargain Buy
                                                                                 (| crore)       (6M) %       (12M) %                    turnaround

                                                                                                                                                                                                   MOMENTUM PICK
                             Agri and Chemicals
    DEEPAKNTR                Deepak Nitrite                  DEENIT                  31745            32        163.87          √
    NAVINFLUOR               Navin Fluo.Intl.                NAVFLU                  19801            17         56.46          √
    PHILIPCARB               Phillips Carbon                 PHICAR                    4255            -1        47.40                       √
    PIIND                    P I Industries                  PIIND                   44709              6        32.45                                        √
    SRF                      SRF                             SRF                     68355            65        113.93          √
    TATACHEM                 Tata Chemicals                  TATCHE                  22481            22         85.47          √
    VINATIORGA               Vinati Organics                 VINORG                  19640              6        69.22          √

                             Auto and Auto ancilliary
    ASAHIINDIA               Asahi India Glas                ASAIND                  11768            49        101.92                       √

                                                                                                                                                                                             ICICI Securities – Retail Equity Research
    ASHOKLEY                 Ashok Leyland                   ASHLEY                  36503              5        35.98                       √
    BALKRISIND               Balkrishna Inds                 BALIND                  41318             -3        38.12          √
    ESCORTS                  Escorts                         ESCORT                  24797            57         49.68          √
    GABRIEL                  Gabriel India                   GABIND                   1944            12         37.92                                                        √
    JKTYRE                   JK Tyre & Indust                JKTYRE                    3325            -7        85.13                       √
    MINDACORP                Minda Corp                      MINCOR                    4104           29        108.19                       √
    MINDAIND                 Minda Industries                MININD                  33922            85        208.20          √
    TATAMOTORS               Tata Motors                     TATMOT                 167910            39        185.24          √
    TVSMOTOR                 TVS Motor Co.                   TVSMOT                  29326              0        32.77                                                        √

    * Stocks highlighted in Bold and Italics are our CY22 recommendations. Stocks are listed in Sector and Alphabetical order
    Note: The list of stocks enlisted in this report is selected on the basis of certain statistical and technical models. This report recommends only 9 stocks and
    other stocks mentioned are only of analysis purpose. Market Cap and past returns are as of 22nd December 2021

Source: Bloomberg, ICICI Direct Research
December 27, 2021                                                     ICICI Securities Ltd. | Retail Equity Research                                                                    25
…Stock selection: Bottom up way

                                                                            Market Capital       Returns       Returns                    Structural
    NSE Symbol               Company Name                    Idirect Code                                                 Outperformer                 Market Performer   Bargain Buy
                                                                                 (| crore)       (6M) %       (12M) %                    turnaround

                                                                                                                                                                                                   MOMENTUM PICK
                             BFSI
    AXISBANK                 Axis Bank                       AXIBAN                 205331             -9        13.50                                                        √
    BAJAJFINSV               Bajaj Finserv                   BAFINS                 253759            31         78.39          √
    BSE                      BSE                             BSE                       8491          111        212.06          √
    CANBK                    Canara Bank                     CANBAN                  35865            30         71.61                                                        √
    FEDERALBNK               Federal Bank                    FEDBAN                  17089             -4        31.55                                                        √
    HDFC                     HDFC                            HDFC                   459763              1         5.63          √
    KOTAKBANK                Kotak Mah. Bank                 KOTMAH                 349588              0        -7.39          √
    PEL                      Piramal Enterp.                 PIRENT                  61814              6        93.94                                        √
    SBIN                     St Bk of India                  STABAN                 406828              9        77.06                       √

                                                                                                                                                                                             ICICI Securities – Retail Equity Research
                             Capital Goods:
    ABB                      ABB                             ABB                     48409            31         92.67                       √
    ACE                      Action Const.Eq.                ACTCON                    2561            -6        64.07                       √
    ADORWELD                 Ador Welding                    ADOWEL                     906           11        161.85                       √
    GRINDWELL                Grindwell Norton                GRINOR                  19948            54        175.61          √
    KABRAEXTRU               Kabra Extrusion                 KABEXT                    1142           94        301.18          √
    LT                       Larsen & Toubro                 LARTOU                 262845            25         48.17                       √
    ORIENTREF                RHI Magnesita                   ORIREF                    5812           13         42.00                       √

    * Stocks highlighted in Bold and Italics are our CY22 recommendations. Stocks are listed in Sector and Alphabetical order
    Note: The list of stocks enlisted in this report is selected on the basis of certain statistical and technical models. This report recommends only 9 stocks and
    other stocks mentioned are only of analysis purpose. Market Cap and past returns are as of 22nd December 2021

Source: Bloomberg, ICICI Direct Research
December 27, 2021                                                     ICICI Securities Ltd. | Retail Equity Research                                                                    26
…Stock selection: Bottom up way

                                                                            Market Capital       Returns       Returns                    Structural
    NSE Symbol               Company Name                    Idirect Code                                                 Outperformer                 Market Performer   Bargain Buy
                                                                                 (| crore)       (6M) %       (12M) %                    turnaround

                                                                                                                                                                                                   MOMENTUM PICK
    SANGHVIMOV               Sanghvi Movers                  SANMOV                     911             6       105.92                                                        √
    SIEMENS                  Siemens                         SIEMEN                  84336            19         57.04                       √
    SKFINDIA                 SKF India                       SKFIND                  18368            42       128.13           √
    THERMAX                  Thermax                         THERMA                  19962            21         90.42                       √
    VOLTAMP                  Volt.Transform.                 VOLTRA                    1952           40         65.69                       √

                             Consumption & Retail
    ABFRL                    Aditya Bir. Fas.                ADIFAS                  25987            31         83.97                       √
    ASIANPAINT               Asian Paints                    ASIPAI                 314626              9        26.12          √
    BAJAJELEC                Bajaj Electrical                BAJELE                  15563            33        123.20          √
    BUTTERFLY                Butterfly Gan Ap                BUTGAN                    1848           50        123.60                       √

                                                                                                                                                                                             ICICI Securities – Retail Equity Research
    DIXON                    Dixon Technolog.                DIXTEC                  32123            19        116.33          √
    HAVELLS                  Havells India                   HAVIND                  85894            37         55.75          √
    KAJARIACER               Kajaria Ceramics                KAJCER                  19552            27         81.94          √
    LAOPALA                  La Opala RG                     LAOPA                     4707           56         93.81                       √
    MCDOWELL-N               United Spirits                  UNISPI                  65670            34         62.60                       √
    RELAXO                   Relaxo Footwear                 RELFOO                  31107            13         57.58          √
    SHOPERSTOP               Shoppers Stop                   SHOSTO                    3779           50         78.01                       √
    SUPREMEIND               Supreme Inds.                   SUPIND                  28303              3        35.23          √
    TATACONSUM               Tata Consumer                   TATGLO                  65886             -6        24.12                                        √
    TCNSBRANDS               TCNS Clothing Co                TCNCLO                    4933           35         77.32          √

    * Stocks highlighted in Bold and Italics are our CY22 recommendations. Stocks are listed in Sector and Alphabetical order
    Note: The list of stocks enlisted in this report is selected on the basis of certain statistical and technical models. This report recommends only 9 stocks and
    other stocks mentioned are only of analysis purpose. Market Cap and past returns are as of 22nd December 2021
Source: Bloomberg, ICICI Direct Research
December 27, 2021                                                     ICICI Securities Ltd. | Retail Equity Research                                                                    27
…Stock selection: Bottom up way

                                                     Idirect      Market Capital     Returns      Returns                   Structural    Market
NSE Symbol              Company Name                                                                        Outperformer                                Bargain Buy
                                                     Code              (| crore)     (6M) %      (12M) %                    turnaround   Performer

                                                                                                                                                                                 MOMENTUM PICK
TITAN                   Titan Company                TITIND               204169           31       53.44         √
TRENT                   Trent                        TRENT                 37143           22       50.95         √

                        Energy
HINDPETRO               HPCL                         HINPET                40875           -5       36.66                                                    √
TATAPOWER               Tata Power Co.               TATPOW                69658           80      204.26                       √

                        Infrastructure
ADANIPORTS              Adani Ports                  ADAPOR               147588           -3       54.24         √
BLUEDART                Blue Dart Expres             BLUDAR                14728            6       63.71         √
CONCOR                  Container Corpn.             CONCOR                37435          -13       59.05                       √

                                                                                                                                                                           ICICI Securities – Retail Equity Research
JKLAKSHMI               JK Lakshmi Cem.              JKLAKS                 6255           -8       63.58                                                    √
KNRCON                  KNR Construct.               KNRCON                 8059           28       72.28                                                    √
TCI                     Transport Corp.              TRACOR                9700           78      183.00          √
TCIEXP                  TCI Express                  TCIEXP                 9700          79       183.54         √
ULTRACEMCO              UltraTech Cem.               ULTCEM               212955           8        46.92         √

                        Media
NETWORK18               Netwrk.18 Media              NETW18                 9255           66      147.27                       √
TVTODAY                 T.V. Today Netw.             TVTNET                 2541           39      104.66                       √

* Stocks highlighted in Bold and Italics are our CY22 recommendations. Stocks are listed in Sector and Alphabetical order
Note: The list of stocks enlisted in this report is selected on the basis of certain statistical and technical models. This report recommends only 9 stocks and other
stocks mentioned are only of analysis purpose. Market Cap and past returns are as of 22nd December 2021

Source: Bloomberg, ICICI Direct Research
December 27, 2021                                              ICICI Securities Ltd. | Retail Equity Research                                                         28
…Stock selection: Bottom up way

                                                          Idirect     Market Capital    Returns     Returns                  Structural    Market
NSE Symbol              Company Name                                                                          Outperformer                              Bargain Buy
                                                          Code             (| crore)    (6M) %     (12M) %                   turnaround   Performer

                                                                                                                                                                                 MOMENTUM PICK
                        Metals
HINDALCO                Hindalco Inds.                    HINDAL             104123          26       99.81          √
JSL                     Jindal Stain.                     JINSTA               9387          76     178.67                       √
SAIL                    SAIL                              SAIL                 46551         -11      97.20                      √
TATAMETALI              Tata Metaliks                     TATME                 2610         -26      40.61                                                  √
TATASTEEL               Tata Steel                        TATSTE             137845           1       87.72                                                  √
VSSL                    Vardhman Special                  VARSPE                902           4       80.87          √

                        Others
BALRAMCHIN              Balrampur Chini                   BALCHI                6494          -4      89.38                      √
CHAMBLFERT              Chambal Fert.                     CHAFER               15874         24       74.35          √
INDHOTEL                Indian Hotels Co                  INDHOT              23924          33      60.07                       √

                                                                                                                                                                           ICICI Securities – Retail Equity Research
INDIGO                  Interglobe Aviat                  INTAVI               73785         12       21.94                      √
INOXLEISUR              Inox Leisure                      INOX                  4583         17       39.52                                  √
MHRIL                   Mahindra Holiday                  MAHHOL                3872         14       48.85                      √
PRAJIND                 Praj Industries                   PRAIND                5572         -17     191.54                      √
TRIVENI                 Triven.Engg.Ind.                  TRIENG                5172          20     199.86          √
VIPIND                  V I P Inds.                       VIPIND                7805         41       67.87                      √

                        Pharmaceuticals and Healthcare:
ABBOTINDIA              Abbott India                      ABBIND               38717          9       17.47                                                  √
APOLLOHOSP              Apollo Hospitals                  APOHOS               68665         47       98.29          √
CAPLIPOINT              Caplin Point Lab                  CAPPOI                5754         14       59.21                      √

* Stocks highlighted in Bold and Italics are our CY22 recommendations. Stocks are listed in Sector and Alphabetical order
Note: The list of stocks enlisted in this report is selected on the basis of certain statistical and technical models. This report recommends only 9 stocks and other
stocks mentioned are only of analysis purpose. Market Cap and past returns are as of 22nd December 2021
Source: Bloomberg, ICICI Direct Research
December 27, 2021                                                   ICICI Securities Ltd. | Retail Equity Research                                                    29
…Stock selection: Bottom up way

                                                     Idirect      Market Capital     Returns      Returns                   Structural    Market
NSE Symbol              Company Name                                                                         Outperformer                               Bargain Buy
                                                     Code              (| crore)     (6M) %      (12M) %                    turnaround   Performer

                                                                                                                                                                                 MOMENTUM PICK
CIPLA                   Cipla                        CIPLA                 71780           -7       11.91                                    √
DIVISLAB                Divi's Lab.                  DIVLAB               121147            6       22.64         √
FORTIS                  Fortis Health.               FORHEA                20973           20       79.98                       √
SEQUENT                 Sequent Scien.               SEQSCI                 4021          -40        -3.02                                                   √

                        PSU
BEL                     Bharat Electron              BHAELE                49560           34       81.20         √
HAL                     Hind.Aeronautics             HINAERON              41648           24       56.89                       √
IDBI                    IDBI Bank                    IDBI                  49246           19       35.50                                                    √
IRCTC                   IRCTC                        INDRAI                67180         102       200.11         √

                        Real Estate
DLF                     DLF                          DLFLIM                93381           27       71.99                       √

                                                                                                                                                                           ICICI Securities – Retail Equity Research
KOLTEPATIL              Kolte Patil Dev.             KOLPAT                 2229           32       31.76                       √
MAHLIFE                 Mahindra Life.               MAHLIF                 3504           14      108.30                       √
OBEROIRLTY              Oberoi Realty                OBEREA                30839           38       56.17         √
PHOENIXLTD              Phoenix Mills                PHOMIL                16523           17       31.63                                                    √
PRESTIGE                Prestige Estates             PREST                 18315           58       78.79                       √

                        Technology
BSOFT                   Birlasoft Ltd                KPITEC                13942           30      115.10         √
COFORGE                 Coforge                      NIITEC                33320           38      113.56         √
HCLTECH                 HCL Technologies             HCLTEC             331827            25       33.81          √
INFY                    Infosys                      INFTEC               767399           21       49.50         √

* Stocks highlighted in Bold and Italics are our CY22 recommendations. Stocks are listed in Sector and Alphabetical order
Note: The list of stocks enlisted in this report is selected on the basis of certain statistical and technical models. This report recommends only 9 stocks and other
stocks mentioned are only of analysis purpose. Market Cap and past returns are as of 22nd December 2021
Source: Bloomberg, ICICI Direct Research
December 27, 2021                                               ICICI Securities Ltd. | Retail Equity Research                                                        30
…Stock selection: Bottom up way

                                                     Idirect      Market Capital     Returns      Returns                   Structural    Market
NSE Symbol              Company Name                                                                        Outperformer                                Bargain Buy
                                                     Code              (| crore)     (6M) %      (12M) %                    turnaround   Performer

                                                                                                                                                                                 MOMENTUM PICK
LTI                     L & T Infotech               LTINFO              124864            73       99.44         √
MPHASIS                 Mphasis                      MPHLIM               59413            58      122.81         √
PERSISTENT              Persistent Sys               PERSYS               34694            76      229.65         √
TCS                     TCS                          TCS                1343033            10       26.40         √
TECHM                   Tech Mahindra                TECMAH              161067            57       75.70         √
ZENSARTECH              Zensar Tech.                 ZENTE                10463            55      102.27                       √

                        Telecom
BHARTIARTL              Bharti Airtel                BHAAIR              376067            30       39.44                       √
RELIANCE                Reliance Industry            RELIND             1599996             6       22.17         √
TATACOMM                Tata Comm                    TATCOM               39749            10       38.82         √

                                                                                                                                                                           ICICI Securities – Retail Equity Research
                        Textile
AMBIKCO                 Ambika Cotton                AMBCOT                 1030           56      119.76                       √
GOKEX                   Gokaldas Exports             GOKEXP                 1688           97      232.97                       √
KPRMILL                 K P R Mill Ltd               KPRMIL                20939           94      245.74         √
RAYMOND                 Raymond                      RAYMON                 4228           47       95.13                       √
VTL                     Vardhman Textile             VARTEX                12926           63      119.12         √

* Stocks highlighted in Bold and Italics are our CY22 recommendations. Stocks are listed in Sector and Alphabetical order
Note: The list of stocks enlisted in this report is selected on the basis of certain statistical and technical models. This report recommends only 9 stocks and other
stocks mentioned are only of analysis purpose. Market Cap and past returns are as of 22nd December 2021

Source: Bloomberg, ICICI Direct Research
December 27, 2021                                              ICICI Securities Ltd. | Retail Equity Research                                                         31
MOMENTUM PICK
                Commodity and Currency Outlook

                                                                               ICICI Securities – Retail Equity Research
December 27, 2021        ICICI Securities Ltd. | Retail Equity Research   32
Gold spot ($1805): Consolidate with positive bias, test all-
time high of $2075…
 Gold prices are expected to              Monthly Bar Chart
  consolidate with positive bias                                                                                                                                   2075
  while holding above the major

                                                                                                                                                                                      MOMENTUM PICK
  support area of $1650 and                                                   1921             Shallow retracement and a higher base at
  gradually head higher to test its                                                            12 month’s average highlights positive price
  all-time high of $2075 in the                                                                structure
  coming year.
                                                                                                                                                            1676
                                                 2001-11 multifold
                                                       rally
                                                                                                                      1380

                                                                                                                                       1160

                                                                                                                                                                                ICICI Securities – Retail Equity Research
                                                                                                               1025                Support @ 1650 as it is confluence of
                                                                                                                                   the rising 12 month’s average and 50%
                                                                                                                                   retracement of entire 2018-20 rally
                                                                                                                                   (1160-2075)

                                                                        12 Months
                                                                         average

                                                      681

Source: Bloomberg, ICICI Direct Research
December 27, 2021                                              ICICI Securities Ltd. | Retail Equity Research                                                              33
Brent Futures ($75): Consolidation likely in range of $55-95..

 Brent prices after the strong up         Quarterly Bar Chart
  move in the last 19 months are                                               147                                                 Stiff resistance at $95 as it is the
  witnessing profit booking in the                                                                                                 previous major breakdown area of

                                                                                                                                                                                      MOMENTUM PICK
                                                                                             128
  last    two     months      amid                                                                                                 CY14 and 61.8% retracement of the
  overbought      placement      of                                                                                                entire decline ($147-16)
  quarterly    stochastic.   Going
  ahead, we expect Brent prices to                                                                                                             87
  enter into a consolidation in the                                                                  94
  broad range of $55-95 in the
  coming year

                                                                                         Breakdown area of 2011-                                                 60
                                                                                          14 consolidation range

                                                                                36                                                                          36

                                                                                                                                                                                ICICI Securities – Retail Equity Research
                                                                                                                            27

                                                                                                      Confluence of multiple retracement and March
                                                                                                      2021 low around $55-60 makes it a major
                                                                                                      support in medium term
                                                                                                                                                          16

                                                                                                       Quarterly stochastic reacting lower from the overbought territory

Source: Bloomberg, ICICI Direct Research
December 27, 2021                                            ICICI Securities Ltd. | Retail Equity Research                                                                34
LME Copper ($9560): On cusp of decade long
consolidation breakout signifies structural turnaround….
                                            Quarterly Bar Chart                                                                                           161.8% external
      LME Copper prices are on the
                                                                                                               Faster retracement as it               retracement @ 11800
       cusp of breaking above
       decade long consolidation                                                                               retraced 37 quarters corrective

                                                                                                                                                                                       MOMENTUM PICK
       phase, which has been                                                                                   phase in just five quarters                   10729
                                                                                              10179
       backed by faster pace of
       retracement of the entire                                                9000
       decline, signifying a structural
       turnaround                                                                                                                         7323
      We expect it to continue its
       positive    momentum        and
       head higher towards $11800
       in the coming year as it is the
       161.8% external retracement
       of the last two quarter’s                                                                                            4310                     4577
       breather ($10729-8766)
                                                                                                                                       Key support is placed at $8400 as

                                                                                                                                                                                 ICICI Securities – Retail Equity Research
                                                                                                                                       it is 38% retracement of entire
                                                                                 2768                                                  rally ($4577-10729)

                                           1318

                                                                          Quarterly RSI is resolving out of multi year trendline resistance indicating positive bias

Source: Bloomberg, ICICI Direct Research
December 27, 2021                                             ICICI Securities Ltd. | Retail Equity Research                                                                35
LME Aluminium ($2830): Higher base formation around
all-time high likely in coming quarters…
 The prices, after a stupendous             Quarterly Bar Chart
  rally from March 2020 to
                                                                           3292
  October 2021 ($1420-3180))

                                                                                                                                                                                  MOMENTUM PICK
                                                                                                                                                                3180
  witnessed profit booking in the
  last two months from near the                                                                                 Faster retracement as it
  previous all-time high of CY09                                                                                retraced 35 quarters corrective
  (3292). Going ahead, post a                                                               2772                phase in just six quarters
  sharp up move we expect a
  higher base formation around its                                                                                                          2603
  all-time high in the coming
  quarters in the broader range of
  $2200-3300

                                                                                                                                                                            ICICI Securities – Retail Equity Research
                                                                                                                        1424                        1420

                                           1243                               1251                         Major support @ $ 2200
                                                                                                           - 50% retracement of entire rally ($ 1420-3180)
                                                                                                           - Lower band of the consolidation of Apr-July 2021

Source: Bloomberg, ICICI Direct Research
December 27, 2021                                              ICICI Securities Ltd. | Retail Equity Research                                                          36
Rupee (75): Downside capped around 78….

      In the last decade, on three        Quarterly Bar Chart (Inverted scale)
       occasions, the rupee has
                                                                                                                                                         Key support
       seen sharp depreciation of

                                                                                                                                                                                  MOMENTUM PICK
       more than 20% as in CY08-                                                                                                             76.9           at 78
       09, CY13-14 and CY18-20.                                                                          19     quarter
       The sharp depreciation is                                                                         consolidation
       followed by multi year                                                                                                                         72.2
       consolidation (minimum of
       11 quarters)                                                                             68.9
      In the current scenario, the                                                                                            63.5
       rupee after depreciating
       from 63.5 to 76.9 during
       CY18-20,       has     been
       consolidating in a narrow
       range in the last seven
       quarters. As per historical
       evidence, we expect the                                         11   quarter                    58.5
                                                                                                                          Key hurdle at 72 levels

                                                                                                                                                                            ICICI Securities – Retail Equity Research
       current consolidation to                                        consolidation                                      o Rising trendline joining lows since 2013
       extend in the coming year                                                                                          o Lower band of last year’s consolidation
       in the broad range of 72-78                                52
                                                                                                                             placed around 72 levels
                                                                                         53.5

                                                                                  43.7

                                                       39.2

Source: Bloomberg, ICICI Direct Research
December 27, 2021                                             ICICI Securities Ltd. | Retail Equity Research                                                           37
Notes

•    It is recommended to enter in a staggered manner within the prescribed range provided in the
     report

                                                                                                                          MOMENTUM PICK
•    The recommendations are valid for twelve months and in case we intend to carry forward or exit the
     position early, it will be communicated on i-click to gain page of our website, mobile notification and
     email

                                                                                                                    ICICI Securities – Retail Equity Research
    December 27, 2021                               ICICI Securities Ltd. | Retail Equity Research             38
MOMENTUM PICK
Pankaj Pandey                     Head – Research                    pankaj.pandey@icicisecurities.com

                                                                                                         ICICI Securities – Retail Equity Research
                                  ICICI Direct Research Desk,

                                  ICICI Securities Limited,

                                  1st Floor, Akruti Trade Centre,

                                  Road No 7, MIDC,

                                  Andheri (East)

                                  Mumbai – 400 093

                                  research@icicidirect.com

December 27, 2021   ICICI Securities Ltd. | Retail Equity Research                                  39
Disclaimer
We/I, Dharmesh Shah, Nitin Kunte, Ninad Tamhanekar, Pabitro Mukherjee, Vinayak Parmar Research Analysts, authors and the names subscribed to this report, here by certify that all of the views expressed in this
research report accurately reflect our views about the subject issuer(s) or securities. We also certify that no part of our compensations, is, or will be directly or indirectly related to the specific recommendation(s) or
view(s) in this report. We confirmed that above mentioned Analysts of this report have not received any compensation from the companies mentioned in the report in the preceding twelve months and do not serve
as an officer, director or employee of the companies mentioned in the report

                                                                                                                                                                                                                                      MOMENTUM PICK
Terms & conditions and other disclosures:

ICICI Securities Limited (ICICI Securities) is a full-service, integrated investment banking and is, inter alia, engaged in the business of stock brokering and distribution of financial products.
ICICI Securities is Sebi registered stock broker, merchant banker, investment adviser, portfolio manager and Research Analyst. ICICI Securities is registered with Insurance Regulatory Development Authority of India
Limited (IRDAI) as a composite corporate agent and with PFRDA as a Point of Presence. ICICI Securities Limited Research Analyst SEBI Registration Number – INH000000990. ICICI Securities Limited SEBI Registration
is INZ000183631 for stock broker. ICICI Securities is a subsidiary of ICICI Bank which is India’s largest private sector bank and has its various subsidiaries engaged in businesses of housing finance, asset
management, life insurance, general insurance, venture capital fund management, etc. (“associates”), the details in respect of which are available on www.icicibank.com.
Recommendation in reports based on technical and derivative analysis centre on studying charts of a stock's price movement, outstanding positions, trading volume etcas opposed to focusing on a company's
fundamentals and, as such, may not match with the recommendation in fundamental reports. Investors may visit icicidirect.com to view the Fundamental and Technical Research Reports. Our proprietary trading and
investment businesses may make investment decisions that are inconsistent with the recommendations expressed herein.
ICICI Securities Limited has two independent equity research groups: Institutional Research and Retail Research. This report has been prepared by the Retail Research. The views and opinions expressed in this
document may or may not match or may be contrary with the views, estimates, rating, target price of the Institutional Research.
The information and opinions in this report have been prepared by ICICI Securities and are subject to change without any notice. The report and information contained herein is strictly confidential and meant solely
for the selected recipient and may not be altered in any way, transmitted to, copied or distributed, in part or in whole, to any other person or to the media or reproduced in any form, without prior written consent of
ICICI Securities. While we would endeavour to update the information herein on a reasonable basis, ICICI Securities is under no obligation to update or keep the information current. Also, there may be regulatory,
compliance or other reasons that may prevent ICICI Securities from doing so. Non-rated securities indicate that rating on a particular security has been suspended temporarily and such suspension is in compliance
with applicable regulations and/or ICICI Securities policies, in circumstances where ICICI Securities might be acting in an advisory capacity to this company, or in certain other circumstances.
This report is based on information obtained from public sources and sources believed to be reliable, but no independent verification has been made nor is its accuracy or completeness guaranteed. This report and

                                                                                                                                                                                                                                ICICI Securities – Retail Equity Research
information herein is solely for informational purpose and shall not be used or considered as an offer document or solicitation of offer to buy or sell or subscribe for securities or other financial instruments. Though
disseminated to all the customers simultaneously, not all customers may receive this report at the same time. ICICI Securities will not treat recipients as customers by virtue of their receiving this report. Nothing in
this report constitutes investment, legal, accounting and tax advice or a representation that any investment or strategy is suitable or appropriate to your specific circumstances. The securities discussed and opinions
expressed in this report may not be suitable for all investors, who must make their own investment decisions, based on their own investment objectives, financial positions and needs of specific recipient. This may
not be taken in substitution for the exercise of independent judgment by any recipient. The recipient should independently evaluate the investment risks. The value and return on investment may vary because of
changes in interest rates, foreign exchange rates or any other reason. ICICI Securities accepts no liabilities whatsoever for any loss or damage of any kind arising out of the use of this report. Past performance is not
necessarily a guide to future performance. Investors are advised to see Risk Disclosure Document to understand the risks associated before investing in the securities markets. Actual results may differ materially
from those set forth in projections. Forward-looking statements are not predictions and may be subject to change without notice.
ICICI Securities or its associates might have managed or co-managed public offering of securities for the subject company or might have been mandated by the subject company for any other assignment in the past
twelve months. ICICI Securities or its associates might have received any compensation from the companies mentioned in the report during the period preceding twelve months from the date of this report for
services in respect of managing or co-managing public offerings, corporate finance, investment banking or merchant banking, brokerage services or other advisory service in a merger or specific transaction.
ICICI Securities encourages independence in research report preparation and strives to minimize conflict in preparation of research report. ICICI Securities or its associates or its analysts did not receive any
compensation or other benefits from the companies mentioned in the report or third party in connection with preparation of the research report. Accordingly, neither ICICI Securities nor Research Analysts and their
relatives have any material conflict of interest at the time of publication of this report.
Compensation of our Research Analysts is not based on any specific merchant banking, investment banking or brokerage service transactions. ICICI Securities or its subsidiaries collectively or Research Analysts or
their relatives do not own 1% or more of the equity securities of the Company mentioned in the report as of the last day of the month preceding the publication of the research report.
Since associates of ICICI Securities and ICICI Securities as a entity are engaged in various financial service businesses, they might have financial interests or beneficial ownership in various companies including the
subject company/companies mentioned in this report. ICICI Securities may have issued other reports that are inconsistent with and reach different conclusion from the information presented in this report. Neither
the Research Analysts nor ICICI Securities have been engaged in market making activity for the companies mentioned in the report.
We submit that no material disciplinary action has been taken on ICICI Securities by any Regulatory Authority impacting Equity Research Analysis activities.
This report is not directed or intended for distribution to, or use by, any person or entity who is a citizen or resident of or located in any locality, state, country or other jurisdiction, where such distribution,
publication, availability or use would be contrary to law, regulation or which would subject ICICI Securities and affiliates to any registration or licensing requirement within such jurisdiction. The securities described
herein may or may not be eligible for sale in all jurisdictions or to certain category of investors. Persons in whose possession this document may come are required to inform themselves of and to observe such
restriction.

December 27, 2021                                                               ICICI Securities Ltd. | Retail Equity Research                                                                                            40
You can also read