Your best guide to financial markets
←
→
Page content transcription
If your browser does not render page correctly, please read the page content below

Your best guide to
      financial markets

                            Weekly Research Reports

                    GROWING TOGETHER   www.hpmgshares.com
HPMG Wealth (weekly)

Top Sectors for the Week

                             CONTENTS
                               Title                              Page No.

                               HPMG Wealth (Weekly)                  03-04

                               Top Sectors for the Week              05-14

                               Weekly Pivot Table (Equities)            15

                               Weekly Pivot Table (Commodities)         16

                               Disclaimer                               17
HPMG WEALTH WEEKLY
   Let Your Money Grow Confidently !

                                       Stock ideas backed by
                                                 strong research

                                                          HPMG Wealth Weekly… Getting rich is easy
                                                          with help of HPMG Wealth Weekly.
                                                          This weekly research report helps you to identify
                                                          the best five momentum stocks for the week.
                                                          ‘Pick of the week’ is best among the mentioned
                                                          five and is always with detailed ‘Technical &
                                                          Macro outlook’.
                                                          The trick to “Get Rich quickly and to Stay Rich
                                                          forever” is a combination of alertness and
                                                          awareness. With the right information on stocks
                                                          from HPMG Wealth Weekly, your money is likely
                                                          to grow confidently and living the “rich” life, is
                                                          achievable.

                                       GROWING TOGETHER        www.hpmgshares.com
HPMG WEALTH WEEKLY                                                                                                                        Monday
                                                           Let Your Money Grow Confidently !                                                                                    09th August, 2021

        STOCKS                         CMP             BIAS                                    TRADING/ INVESTMENT STRATEGY
                                                                     Incorporated in the year 1984, AARTI INDUSTRIES (AIL) is a global leader in Benzene based derivative products. The company
                                                                     has a diversified product portfolio with end users in pharma, agrochemicals, specialty polymers, paints & pigments. The stock is
                                                                     currently trading near its all-time-highs as the management is confident of embarking on strong growth trajectory from FY22 given
                                                                     improvement in demand across specialty chemicals and pharma space. The firm commands a market cap of 33876 crores. The
    AARTI INDUSTRIES                     956           Positive      biggest positive catalyst in favor of AARTI INDUSTRIES is the firms’ improved outlook on backdrop of issues in China. AIL's
                                                                     management expects to deliver 15% CAGR in overall profitability over FY20-23. Look to buy at CMP, and on dips between 825-
                                                                     850 zone, targeting psychological 1000 mark and then at 1121 mark. Stop at 785. Holding period 3-5 Months.
                                                                     Aggressive 1-year targets at 1225-1250 zone.

                                                                     Incorporated in 1986, Accelya is a leading global provider of technology platforms, software, and services to the travel and transport
                                                                     industry. Accelya has been delivering business-critical financial, commercial, cargo, and analytics solutions for more than 40 years.
                                                                     The company has over 250 airline customers, operations spread across 9 countries, and employs 2,500 professionals worldwide.
   ACCELYA SOLUTIONS                    1460           Positive      Accelya’s solutions are organized around customers’ key functions including commercial planning and optimization, sales and
                                                                     distribution management, and financial reconciliation and settlement. By 2023, airlines’ direct channels (digital and offline) will
                                                                     account for 56% of bookings – a 12% increase in just three years. Buy at CMP, and on dips between 1250-1275 zone,
                                                                     targeting 1600 mark and then at psychological 1750 mark. Stop at 1187. Holding period 3-5 Months.

                                                                     Cipla is a leading global pharmaceutical company with presence in over 80 countries and amongst the top 3 players in
                                                                     branded formulations in India accounting for more than 40% of business.The firm has 1,500 plus products across various
                                                                     therapeutic categories and is known for inhalers and anti-retrovirals. # Q1FY22 revenue rose 27% YoY led by growth in
            CIPLA                        911           Positive      India (+68% YoY) # API business grew 69 per cent YoY in dollar terms #24% growth in profit after tax (PAT) to Rs 715
                                                                     crore for the June quarter. Simply buy at CMP, and on dips between 850-875 zone, targeting psychological
                                                                     1000 mark and then aggressive targets at 1125-1150 zone. Stop 751. Holding Period 3-5 months.

                                                                     Incorporated in the year 1973, SAIL has a market cap of Rs 58654 Crore and operates in Metals - Ferrous sector. The key
                                                                     positive catalyst in favor of the stock is the firms’ higher operating leverage due to high conversion cost, the strength in
                                                                     China HRC export price, tight demand supply scenario in the domestic market, backward integrated with captive iron ore,
             SAIL                        142           Positive      permission from government to sell 25% of Iron ore production of previous fiscal and iron ore fines accumulated as
                                                                     waste over past 5-6 decades, and also demand from Railways which should keep its average NSR higher. Establish buy
                                                                     positions at CMP, and on dips between 125-127.50 zone, targeting 153 mark and then aggressive targets
                                                                     at psychological 175 mark. Stop 113. Holding period 2-3 months.

                                                                     Incorporated in the year 1965, Vedanta Ltd is one of the world's leading diversified resources producing company
                                                                     which include aluminum, Oil & Gas, copper, Iron Ore, zinc-lead-silver, Power and scrap. Vedanta is also one of the largest
                                                                     resources company in India. The key positive catalyst in favor of Vedanta’s stock price is the firm’s improving operating
                                                                     performance, supported by stable volume across business segments and increased commodity prices. 85%+ of EBITDA
          VEDANTA                        141           Positive
                                                                     comes from Zinc, Aluminium and Oil & Gas. Buy between 283-287 zone, targeting 327 mark and then
                                                                     aggressive targets at 375 mark. Holding Period: 3 Months+. Stop at 269. Aggressive 9-12 months
                                                                     psychological targets at 400 mark.

      Analyst’s Pick: STEEL AUTHORITY (CMP 141). Target: 175.
Theme: A metal stock with the mettle to outperform…
Buy STEEL AUTHORITY (SAIL) (CMP 141. Targets at 175):
Steel Authority of India Limited - A Maharatna · One of the largest steel producers in India and operates in Metals -
Ferrous sector. SAIL is owned and operated by the Ministry of Steel, Government of India having an annual steel
making capacity of about 21 million tonnes. The Government of India owns about 65% of SAIL's equity and retains
voting control of the Company.
Incorporated in the year 1973, SAIL has a market cap of Rs 58261 Crore. SAIL produces iron and steel at five
integrated plants and three special steel plants, located principally in the eastern and central regions of India and
situated close to domestic sources of raw materials. SAIL manufactures and sells a broad range of steel products
The key positive catalyst in favor of the stock is the firms’ higher operating leverage due to high conversion cost, the
strength in China HRC export price, tight demand supply scenario in the domestic market, backward integrated with
captive iron ore, permission from government to sell 25% of Iron ore production of previous fiscal and iron ore fines
accumulated as waste over past 5-6 decades, and also demand from Railways which should keep its average NSR
higher.
SAIL is seen delivering across all front and strong margins in steel business are likely to drive momentum in stock price on the upside.
For the June 2021 quarter, SAIL returned to the black, posting a consolidated net profit of Rs 3,897.36 crore The company had posted a Rs 1,226.47-crore net loss in the year-ago
quarter. Its net income during April-June 2021 more than doubled to Rs 20,754.75 crore, compared with Rs 9,346.21 crore in the year-ago period.
Robust operating performance seen aided by lower cost on backdrop of efficient working capital management coupled with sharp capital allocation is likely to improve prospects
further.
Technically, brace yourselves for a breakout play on the weekly and daily time frames. The recent sequence of higher high/low is intact on all time-frames. An impulse uptrend is seen
forming on the monthly time scale too, with positive SAR series.
Add to that a bullish divergence and a rising stochastic signal (on daily charts) with recent increase in volumes signaling a larger rebound. The 200 days Exponential Moving Average
(EMA) of the stock on the daily chart is currently at 83 zone. The level of 83-87.50 zone will act as a strong support zone and any sharp panic declines to these levels offer opportunities
to initiate aggressive long positions.
Establish buy positions at CMP, targeting 153/169 and then aggressive targets at psychological 200 mark. Stop 111.50. Holding period 3-5 months.

                                                                                            GROWING TOGETHER                                                www.hpmgshares.com
Top Sectors for the Week

           Relative Strength
             Performance
              with HPMG
             Top Sectors

                                          Top Sectors for the Week is a
                                          Technical and Macro report containing
                                          everything you need to have…a clear,
                                          precise and detailed view on the five
                                          top momentum sectors... listed in BSE.
                                          This detailed multi-analyzed Macro-
                                          Technical report is a smart way to enter
                                          or exit an outperforming or
                                          underperforming sector using the
                                          relative strength function.

                                          Top Sectors for the Week reports have
                                          an unbeatable track record...You can
                                          look out for our previous reports at our
                                          website www.hpmgshares.com

                     GROWING TOGETHER   www.hpmgshares.com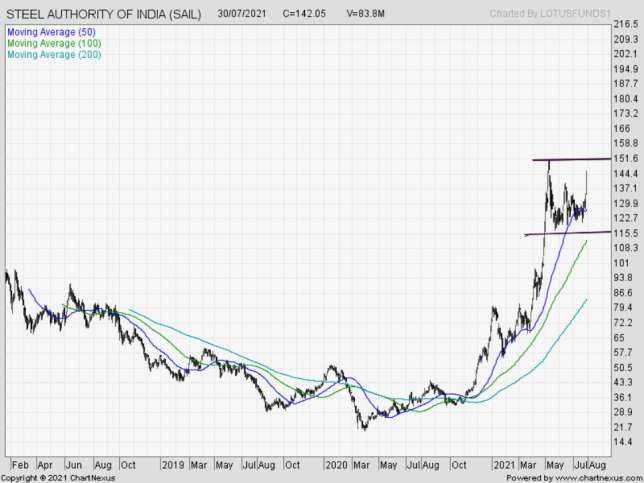
Monday
                     Top Sectors for the Week                                                    09th August, 2021

            Sector Analysis: Relative Strength Performance

    Sectors          Relative to Sensex...    Outperforming stocks                Underperforming stocks

 Nifty Auto Index     UNDERPERFORMER              ASHOK LEYLAND,                           M&M
                                                  HERO MOTO CORP

 Bank Nifty Index          NEUTRAL                 ICICI BANK, SBI                   AXIS BANK, RBL BANK,
                                                                                      BANDHAN BANK

  Nifty IT Index       OUTPERFORMER            INFY, TECH MAHINDRA, COFORGE,               TCS
                                                 MINDTREE, MPHASIS, ACCELYA
Nifty Pharma Index     OUTPERFORMER            DIVISLABS, SUN PHARMA,               BIOCON, WOCKHARDT
                                             TORRENT PHARMA, ALKEM LAB

Nifty Metals Index     OUTPERFORMER          SAIL, TATA STEEL, HINDALCO, NALCO,      COAL INDIA, NMDC
                                              VEDANTA, JINDAL STEEL & POWER

                                             GROWING TOGETHER                         www.hpmgshares.com
Top Sectors for the Week

                                                   From HPMG Research Desk…

The Week That Was: Nifty and Sensex scale new highs.
Sensex: 54,278.
Nifty: 16,238.
The benchmarks, Sensex & Nifty finally moved higher after consolidating for past 9 weeks. Sensex registered an all-time high at 54717 while Nifty scaled 16349 mark.
Eventually, Sensex ended 3% higher at 54717 while Nifty closed 3% higher at 16238, thanks to robust Q1 earnings posted by India Inc plus on backdrop of strong Wall
Street cues.

Meanwhile, as was widely expected, the Monetary Policy Committee (MPC) maintained status quo and kept interest rates steady at record lows. Digging deeper on the
RBI policy outcome:
   # The repo rate remained at 4%, the reverse repo rat was held steady at 3.35%.
   # Inflation appeared to be weighing on the minds of the members of the monetary policy committee even though the central bank said growth remained its focus.
   # The Consumer Price Index (CPI) inflation for the financial year (FY) 2022 was revised upward to 5.7% from 5.1%.
   # Real GDP growth was retained at 9.5% for the current fiscal, consisting of 21.4 per cent in the first quarter, 7.3% in the second quarter, 6.3% in the third quarter
     and 6.1% in the fourth quarter of 2021-22.
   # Real GDP growth for the first quarter of 2022-23 is projected at 17.2 per cent by RBI.

In the US, the Dow and the S&P 500 indexes scaled record highs on Friday as shares in economy-linked sectors jumped following a solid rise in jobs in July, helping allay
fears of the Delta variant impacting a nascent economic recovery.

Nonfarm payrolls increased by 943,000 jobs last month, a Labor Department report showed, amid demand for workers in the labor-intensive services industry. The street
was expecting 870,000 job additions.

For the week, Dow was up 0.78% at 35208.51, S&P 500 was up 0.94% at 4436.52 while the Nasdaq ended 1.11% higher at 14835.8.

Back in our stock markets, Nifty Midcap 50 index was up 1.51% while the NSE Smallcap Index was 0.88% lower for the week. Hence Smllacap Index was undeperforming
the benchmarks.

On the sectoral front, BSE Bankex Index, BSE Auto Index & BSE Teck Index were amongst top gainers for the week, up 3.6%, 3.1% & 3.1% respectively. On the contrary,
only BSE Metal Index was down 0.3%

Stock specific, TECHMAHINDRA, SUNPHARMA & HDFC were amongst top weekly gainers, up 12.2%, 11.6% & 9% respectively. On the losing side, AXISBANK,
ASIANPAINTS & MARUTI lost 5%, 4.7% & 4.3% respectively for the week ended.

Let’s now have a look at other catalysts from last week:

   # RIL fell in Friday’s trade (-2.07%) after the Supreme Court ruled that an arbitration order stopping Future Retail's sale of assets to the conglomerate was valid. The
     Supreme Court verdict that Reliance Retail cannot go ahead with its $3.4 billion deal to buy Future Groups retail assets acted as dampener as Reliance Industries
     fell as much as 2.05%.

   # Adani Enterprises posted a net profit at Rs 265.60 crore against a loss of Rs 65.67 crore and revenue was at Rs 12,578.77 crore against Rs 5,265.19 crore, YoY.

   # Bharti Airtel posted a net profit at Rs 283.5 crore versus Rs 759.2 crore and revenue was at Rs 26,853 crore versus Rs 25,747.3 crore, QoQ.

   # Hindustan Petroleum (HPCL) reported a net profit of Rs 2,003.90 crore for the first quarter of FY22. This is 11.04 per cent lower than the Rs 2,252.65 crore net
     profit reported by the company in the comparable quarter of financial year 2020-21.

   # Apollo Tyres reported profit at Rs 127.7 crore in Q1FY22 against loss of Rs 134.5 crore in Q1FY21, revenue jumped to Rs 4,584.4 crore from Rs 2,881.7 crore YoY.

                                                                                 GROWING TOGETHER                                  www.hpmgshares.com
Top Sectors for the Week
# Titan reported profit at Rs 61 crore in Q1FY22 against loss of Rs 270 crore in Q1FY21, revenue surged to Rs 3,249 crore from Rs 1,862 crore YoY.
# Accelya Solutions reported higher consolidated profit at Rs 18.35 crore in Q1FY22 against Rs 3.55 crore in Q1FY21, revenue rose to Rs 85.72 crore from Rs 62.83
crore YoY.
# Cipla reported higher consolidated profit at Rs 714.72 crore in Q1FY22 against Rs 577.91 crore in Q1FY21, revenue rose to Rs 5,504.35 crore from Rs 4,346.16
crore YoY.
# WTI Crude Oil Prices lost 8.19% last week at $67.89 a barrel. Crude oil prices declined on concerns of rising Delta variant cases of coronavirus globally and surprise
build up in US stockpiles. However, the oil prices were supported by increase geopolitical tension in the Middle East.
# While global chip shortage remains a challenge in the automobile industry, opening up of COVID-induced lockdowns and subsequent easing of restrictions have
helped the automakers to streamline their production schedules during July 2021. This was coupled with the preference of personal mobility, pent-up demand and
the excitement of new launches, which together revved up the automobile wholesales for the month on a lower base of last year.
# Gold Prices ended 2.7% lower last week at $1763.50 an ounce.
# Indian rupee ended 0.12% higher against US dollar at 74.24.
The Week Ahead: Nifty shall resisting gravity and set to skyrocket to 16500 mark.
The benchmark Nifty should be able to weather overbought technical conditions, hawkish tunes from the Fed, strong US jobs and BOE caution.
The big question: Can Nifty continue to move higher?
Honestly speaking, the next big move hinges on ebbing of the second COVID wave, key economic data like industrial production data for June and inflation data for July
to trickle in this week and most importantly, the ongoing results of companies. Also, trend in other major drivers for the equity market -- foreign institutional investors,
Brent crude and rupee -- would also be command investors’ attention.
Having said that, optimistic backdrop remains as the RBI has retained its GDP growth forecast for the current fiscal year ending in March 2022 at 9.5%.
The indices are flirting with their uncharted territory and we suspect there is lots of room to be explored on the upside for the benchmark indices.
Economic events lined up this week are:
Thursday, 12th August 2021: CPI (YoY) (Jul), Manufacturing Output (MoM) (Jun), Cumulative Industrial Production (Jun), Industrial Production (YoY) (Jun).
Also, commanding attention would be FY21-22 Q1 earnings to trickle in this week:
# Monday, 09th August 2021: SHREECEM, GSPL, MRF, JET AIRWAYS, PETRONET, RPOWER, BALRAMCHIN.
# Tuesday, 10th August 2021: MFSL, ZOMATO, SIEMENS, JAIN IRRIGATION, MANAPPURAM, JINDALSTEL, POWERGRID, MOTHERSUMI, IRB, RELINFRA, NDTV,
EVEREADY, LUPIN.
# Wednesday, 11th August 2021: BATAINDIA, CUMMINSIND, CADILA, IDFCLTD, GSFC, PIDILITE, CESC, PTC
# Thursday, 12th August 2021: ENGINERSIN, RITES, UJJIVAN, THYROCARE, IRCTC, AUROPHARMA, ASHOKLEY, BPCL, TATASTEEL, NMDC, DISHTV, FDC,
RELIGARE, HCC, EICHERMOT, BHARATFORGE, PAGEIND, PFC.
# Friday, 13th August 2021: SUNTV, BURGERKING, ALLCARGO, MTNL, GMRINFRA, NBCC, APOLLOHOSP, DHFL, FORTIS, IGL
Technically speaking, Nifty has just signaled a major breakout on the upside on the weekly charts which should ideally lead to massive short covering and fears of missing
out (FOMO) play. As long as Nifty’s 15921 support holds, there is bright possibility for the benchmark to scale fresh record highs to 16500 mark. If Nifty slips below the
15921 mark then it’s safe to assume that rising inflation risks and FIIs pessimism are spoiling the party at Dalal Street.
FIIs net bought Rs 2,616.04 crore worth of shares in the week ended August 6, after withdrawing more than Rs 23,193 crore in July. Domestic institutional investors also
remained net buyers for the week pumping in Rs 897 crore.
Nifty’s 200 day EMA at 14503 mark. The price action for Nifty for this week’s trade is suggesting that we are likely to see a 15900- 16500 range in near term with buy on
dips as the preferred strategy.
GROWING TOGETHER www.hpmgshares.comTop Sectors for the Week
The options data for August series suggests Nifty is likely to be in a trading range of 15500-16200 zone. Maximum Call OI is at 16000 followed by 16400 strike price. So,
16400 zone are Nifty’s crucial resistance zone. Maximum Put open interest stands at 15500 levels followed by 16000 levels. Call writing was seen at 16400 and then at
15500 strike price, while there was meaningful Put writing at 16000 strike prices.
The slight optimism for our stock markets is also on backdrop of the fact that the volatility index has dropped lower to 12.61 levels. Well, a lower VIX level is seen bullish
for stocks.
Also keeping downside protected are the positive catalysts like:
1. The reopening of the economy
2. Decline in COVID cases and a pick-up in vaccination drive
3. Low interest rates environment.
4. Expected upbeat results from India Inc.
Preferred trade for the week:
# Nifty (16238): Buy between 16100-16150 zone, targeting 15451 mark and then at 16601-16751 zone. Strict stop at 15873.
# Bullish Sectors: Metals, Pharma, FMCG and IT.
# Bearish Sectors: Media, Auto.
# BULLISH STOCKS: AARTI INDUSTRIES, ASHOK LEYLAND, BALKRISHHNA INDUSTRIES, DABUR, DEEPAK NITRITE, DIVIS LAB, DLF, JSW STEEL, SAIL, TORRENT
PHARMA, VEDANTA, ACCELYA.
# BEARISH STOCKS: AXIS BANK, BANDHAN BANK, BHARAT FORGE, BHEL, BIOCON, COAL INDIA, CUB, IDEA, IDFC FIRST BANK, INDIAN HOTELS, INDIGO, RBL
BANK, RELIANCE,
IPO Note:
Rolex Rings, one of top five forging companies in India and the automotive components manufacturer, will make a debut on the bourses on Monday, August 9. The final
price has been fixed at Rs 900 per share.
Meanwhile, the primary market will be in focus with four IPOs opening for subscription this week. Cement major Nuvoco Corporation, and multi-channel auto platform
CarTrade Tech will open during August 9-11.
Nuvoco Corporation is planning to raise Rs 5,000 crore and CarTrade Tech aims to garner Rs 2,998.51 crore through public offers. The price band for the former has been
fixed at Rs 560-570 per share and the later IPO at Rs 1,585 – 1,618 per equity share.
Retail focused housing finance company Aptus Value Housing Finance India and Chemplast Sanmar will open their IPOs during August 10-12. The former is planning to
raise Rs 2,780 crore and later Rs 3,850 crore.
Aptus has fixed a price band at Rs 346-353 per share and Chemplast at Rs 530-541 per share.
Before we end, our most preferred pair strategies:
# Pair Strategy: Long BALKRISHNA INDUSTRIES and Short APOLLO TYRES.
# Pair Strategy: Long ICICI BANK and Short AXIS BANK.
# Pair Strategy: Long TECH MAHINDRA and Short TCS.
# Long SAIL and Short COAL INDIA.
GROWING TOGETHER www.hpmgshares.comTop Sectors for the Week
NIFTY AUTO Index vs NIFTY
• NIFTY AUTO Index: 10250: NEUTRAL.
• In last week's trade, Nifty Auto index was seen trading with positive bias as
the index ended 2% higher as against Nifty’s spectacular gains 3.01%.
Going forward, immediate downside risk seen at 9871 mark.
Below 9871, expect Auto index quickly to 9345 mark.
Confirmation of strength only above Nifty 10601 mark. Only
above 10601 mark on Auto index, all bullish eyes will be on the
psychological 11000 mark. Aggressive buying advised only above 10601
mark.
• Support: 9871/9345/8575.
• Resistance: 10351/10601/11101.
• Preferred Strategy on Auto Index: Establish sell positions at CMP,
targeting 9871 mark and then aggressive targets at 9345-9501 zone with
strict stop at 10659.
• Preferred Trades:
• Buy ASHOK LEYLAND (CMP 134) between 122-125 zone, targeting 139
mark and then aggressive targets at psychological 150 zone with stop
at 111. Holding Period: 1-2 months.
• Buy HERO MOTO CORP at CMP 2833, targeting 2951 mark and then
aggressive targets at psychological3100 zone with stop at 2717.
Holding Period: 1-2 months.
• Outperforming Stocks: ASHOK LEYLAND, BALKRISHA INDUSTRIES.
• Underperforming Stocks: AMARA RAJA BATTERY, BHARAT FORGE,
BOSCH, MARUTI, TATA MOTORS.
PAIR Strategy: Long BALKRISHNA INDUSTRIES and Short APOLLO TYRES.
PAIR Strategy: Long ASHOK LEYLAND and Short M&M.
GROWING TOGETHER www.hpmgshares.comTop Sectors for the Week
BANK NIFTY Index vs NIFTY
• BANK NIFTY Index: 35,809: NEUTRAL.
• In last week's trade, Bank Nifty was seen trading with positive bias and
most importantly, ended on a positive note. Bank Nifty ended higher
3.54% for the week as against Nifty’s gains of 3.01%. The biggest key
interweek hurdles seen at 36257 mark. Please note, only a move above
36257 mark will trigger larger advances towards 37709 and then at
38500-38900 zone. That said; expect major declines only below 33991
mark.
• Support: 34921/33991/32621.
• Resistance: 36257/37709/38987.
• Preferred Strategy on Bank Nifty Index: For this week, aggressive
traders should look to buy above 36257 mark, targeting 37709 mark and
then aggressive targets seen at 38500-38900 zone with strict below
34711 mark.
• Preferred Trades:
• Sell BANDHAN BANK (CMP 304) between 311-315 zone, targeting
291/278 mark and then at 251-255 zone with stop at 323. Holding
Period: 1 month.
• BUY ICICI BANK (697), between 653-663 zone, targeting 693 mark
and then at 711-725 zone with stop at 631. Holding Period:
1-2 Months.
• Outperforming Stocks: ICICI BANK, SBI.
• Underperforming Stocks: AXIS BANK, RBL BANK, BANDHAN BANK.
PAIR Strategy: Long ICICI BANK and Short AXIS BANK
GROWING TOGETHER www.hpmgshares.comTop Sectors for the Week
NIFTY IT Index vs NIFTY
• NIFTY IT Index: 31,303: OUTPERFORM.
• In last week’s trade, Nifty IT index witnessed momentum buying on
backdrop of strong Q1 performance by leading software firms. The
sequence of higher high/low was seen all time frames. Nifty IT Index
ended up 2.70% as against Nifty’s GAINS OF 3.01%. The near term bias
continues to remain quite positive as momentum buying likely to be the
theme despite backdrop of overbought technical conditions. Key
interweek support seen at 29291 mark.
• Support: 30251/29591/28381.
• Resistance: 31611/32001/32751.
• Preferred Strategy on IT Index: Buy on dips between 30251-30500
zone, targeting 31611 mark and then at 32001-32751 zone with strict
stop at 29401.
• Preferred Trades:
• Buy ACCELYA at CMP 1460, and on dips between 1300-1350 zone,
targeting 1551 zone and then at 1701-1725 zone. Stop below 1249.
Holding period: 1-2 months.
• Buy TECH MAHINDRA (CMP 1265) between 1221-1231 zone, targeting
1301 and then at 1341-1351 zone. Stop below 1147. Holding period: 2-
3 months.
• Outperforming Stocks: ACCELYA, SONATA SOFTWARE, MINDTREE,
TECH MAHINDRA, INFY, COFORGE, WIPRO, OFSS, MPHASIS.
• Underperforming Stocks: 3I INFOTECH, APTECH.
PAIR Strategy: BUY TECH MAHINDRA and Short TCS.
GROWING TOGETHER www.hpmgshares.comTop Sectors for the Week
NIFTY PHARMA Index vs NIFTY
• NIFTY PHARMA Index: 14,517: NEUTRAL.
• In last week’s trade, despite positive backdrop in broader markets Nifty
Pharma index was unable to scale above its all-time-high placed at 14743
mark. Nifty Pharma index ended 0.64% higher as against Nifty’s gains of
3.01%. The positive takeaway is that the Pharma index again aims to move
towards uncharted territory. Technically, major hurdles now are seen at
14743 mark on closing basis. Above 14743, the index is likely to aim 15000
mark and then aggressive targets located at 16000 mark. The make-or-
break support seen at 13721 mark.
• Support: 14011/13721/12251.
• Resistance: 14743/15751/16501.
• Preferred Strategy on Healthcare Index: For this week, aggressive
traders should look to buy only above 14743 mark, targeting 15001 mark
and then aggressive targets located at 15751-16501 zone with strict stop
below 13611 mark.
• Preferred Trades:
• Buy TORRENT PHARMA at CMP 3063 and on dips between 2900-2925
zone, targeting 3101 zone and then at 3200-3251 zone with stop 2797.
Holding Period: 2-3 months.
• BUY SUN PHARMA (CMP 785) on dips between 745-751 zone, targeting
801/821 mark and then at 901 zone with stop 677. Holding Period:
2-3 months.
• Outperforming Stocks: SUN PHARMA, TORRENT PHARMA, DIVISLABS,
ALKEIM LAB.
• Underperforming Stocks: BIOCON, WOCKHARDT.
PAIR Strategy: Long SUN PHARMA and Short BIOCON
GROWING TOGETHER www.hpmgshares.comTop Sectors for the Week
NIFTY METAL Index vs NIFTY
• NIFTY METAL Index: 5,841: OUTPERFORM.
• In last week’s trade, the metal index witnessed buying as the index
continued to scale at uncharted territory. Metal index ended 1.23%
higher as against as against Nifty’s gains of 3.01%. The technical
landscape continues to be positive and buying on any interweek declines
remains the preferred strategy. Downside risk seen only below 4883
mark. The biggest support for this week seen at 5501. Major hurdles now
at 6151 and then all eyes will be on 6557 mark.
• Support: 5501/5149/4853.
• Resistance: 5907/6151/6557.
• Preferred Strategy on Metal Index: For this week, aggressive
traders should look to buy between 5501-5551 zone, targeting 5907
mark and then aggressive targets at 6151-6557 zone. Stop 5119.
• Preferred Trades:
• Buy RATNAMANI METALS at CMP 2138, targeting 2351 mark and then
at 2575-2750 zone. Stop 1937. Holding period: 3-5 months.
• Buy SAIL (CMP 141) between 130-135 zone, targeting 155 and then at
169-175 zone. Stop 119. Holding period: 2-3 months.
• Outperforming Stocks: TATASTEEL, HINDALCO, JINDAL STEEL, JSW
STEEL, NALCO, SAIL, NMDC.
• Underperforming Stocks: COAL INDIA, WELCORP.
PAIR Strategy: Long SAIL and Short NMDC
GROWING TOGETHER www.hpmgshares.comMonday
DAILY PIVOT TABLE (Equities) 09th August, 2021
Stock CMP Support Resistance 21 DMA 200 DMA Intraday Short Term Long Term
NIFTY 16238.2 15913 16563 15872.3 14502.38 UP UP UP
BANKNIFTY 35809.25 35093 36525 35185.54 32632.55 DOWN UP UP
NIFTYIT 31303.3 30677 31929 29863.4 25647.06 UP UP UP
NIFTYMETAL 5841.35 5725 5958 5485.98 4047.18 UP UP UP
NIFTYPHARM 14517.5 14227 14808 14437.6 12985.55 DOWN UP DOWN
0 0
AARTIIND 956.25 937 975 891.25 701.05 UP DOWN UP
ABBOTINDIA 17506.05 17156 17856 17860.36 15670.44 DOWN DOWN UP
ABFRL 212.25 206 219 219.81 182.99 UP DOWN UP
ACC 2341.35 2295 2388 2262.76 1848.52 UP UP UP
ADANIENT 1536.65 1506 1567 1417.45 917.24 UP UP UP
ADANIPORTS 710.7 696 725 690.76 618.51 DOWN UP DOWN
ALKEM 3472.05 3403 3541 3391.3 2939.88 UP DOWN UP
AMARAJABAT 731.3 717 746 724.72 839.1 DOWN UP DOWN
AMBUJACEM 403.9 396 412 396.63 298.02 UP DOWN UP
APOLLOHOSP 4088.05 4006 4170 3929.14 2937.11 UP UP UP
APOLLOTYRE 223.35 217 230 226.54 208.37 DOWN UP DOWN
ASHOKLEY 134.15 130 138 127.92 113.4 UP UP UP
ASIANPAINT 2966.45 2907 3026 3017.28 2609.84 UP DOWN UP
AUROPHARMA 901.3 883 919 938.49 915.36 DOWN DOWN DOWN
AXISBANK 740.85 726 756 746.92 683.71 DOWN UP DOWN
BAJAJ-AUTO 3847.85 3771 3925 3882.98 3711.08 DOWN DOWN DOWN
BAJAJFINSV 14005.65 13726 14286 13429.51 10025.48 UP UP UP
BAJFINANCE 6224.3 6100 6349 6187.09 5238.27 UP UP UP
BALKRISIND 2449.2 2400 2498 2364.99 1818.3 UP UP UP
BANDHANBNK 303.85 295 313 305.65 337.03 DOWN UP DOWN
BANKBARODA 83.4 80 86 81.68 71.13 DOWN UP UP
BATAINDIA 1671.4 1638 1705 1606.89 1505.31 UP UP UP
BEL 175.4 170 181 182.36 136.1 UP DOWN UP
BERGEPAINT 827.8 811 844 844.04 744.25 UP DOWN UP
BHARATFORG 779.6 764 795 796.28 623.41 UP UP UP
BHARTIARTL 607.9 596 620 551.66 529.21 UP UP UP
BHEL 57.55 56 60 62.62 48.76 DOWN DOWN DOWN
BIOCON 383.6 372 395 392.1 411.05 DOWN DOWN UP
BPCL 455.6 446 465 454.04 423.54 DOWN UP DOWN
BRITANNIA 3604 3532 3676 3481.75 3543.08 UP UP DOWN
CADILAHC 585.8 574 598 612.88 516.11 DOWN DOWN DOWN
CANBK 157.35 153 162 150.95 137.63 UP UP UP
CHOLAFIN 528.8 518 539 506.94 469.18 UP UP DOWN
CIPLA 911.3 893 930 942.53 853.71 DOWN UP DOWN
COALINDIA 146.1 142 150 144.97 137.91 DOWN DOWN UP
COFORGE 4789.65 4694 4885 4688.92 3079.74 UP DOWN UP
COLPAL 1643.2 1610 1676 1731.69 1597.15 DOWN DOWN DOWN
CONCOR 690.35 677 704 669.73 538.42 UP UP UP
COROMANDEL 858.3 841 875 880.2 799.45 UP DOWN UP
CUMMINSIND 900.9 883 919 865.63 734.74 UP UP UP
DABUR 585.2 573 597 591.2 538.91 UP DOWN UP
DEEPAKNTR 2120.45 2078 2163 1975.57 1383.62 UP UP UP
DIVISLAB 4916 4818 5014 4792.81 3848.91 UP UP UP
DLF 342.8 333 353 329.94 264.5 UP UP UP
DRREDDY 4786.3 4691 4882 5130.97 4987.9 DOWN DOWN DOWN
EICHERMOT 2747.35 2692 2802 2628.73 2577.71 UP UP UP
ESCORTS 1199.9 1176 1224 1186.16 1263.23 UP UP UP
EXIDEIND 171.95 167 177 178.67 186.35 DOWN DOWN DOWN
FEDERALBNK 87.15 84 90 86.9 76.18 UP UP UP
GAIL 148.75 144 153 143.66 133.16 UP UP DOWN
GLENMARK 596.45 585 608 633.85 540.89 DOWN DOWN DOWN
GMRINFRA 28.85 28 30 29.61 26.47 DOWN UP UP
GODREJCP 972.25 953 992 971.79 772.91 UP UP UP
GODREJPROP 1582.6 1551 1614 1559.61 1343.59 UP UP UP
GRANULES 378.55 367 390 374.57 350.97 UP UP UP
GRASIM 1531 1500 1562 1550.28 1224.91 UP UP UP
GUJGASLTD 737.4 723 752 711.06 486.73 UP DOWN UP
HAVELLS 1232.9 1208 1258 1127.92 997.54 UP UP UP
HCLTECH 1049.95 1029 1071 1005.67 940.47 UP UP UP
HDFC 2628.1 2576 2681 2510.2 2476.39 UP UP UP
HDFCAMC 2923.05 2865 2982 2919.29 2849.69 DOWN DOWN DOWN
HDFCBANK 1492.65 1463 1523 1466.45 1448.84 DOWN UP DOWN
HDFCLIFE 673.4 660 687 675.07 674.1 DOWN DOWN DOWN
HEROMOTOCO 2833.8 2777 2890 2839.96 3059.54 DOWN UP DOWN
HINDALCO 442.15 433 451 413.18 313.57 UP UP UP
HINDPETRO 264.95 257 273 271.25 241.94 DOWN UP DOWN
HINDUNILVR 2371.5 2324 2419 2388.13 2313.76 DOWN DOWN UP
IBULHSGFIN 271.1 263 279 274.59 215.27 UP DOWN UP
ICICIBANK 697.65 684 712 671.9 577.6 UP UP UP
IGL 535.2 524 546 552.51 509.21 UP DOWN UP
INDHOTEL 144.9 141 149 147.6 123.46 UP DOWN UP
INDIGO 1646.5 1614 1679 1728.5 1651.51 DOWN DOWN DOWN
INDUSINDBK 1029.5 1009 1050 1014.39 933.69 DOWN UP UP
INDUSTOWER 213.05 207 219 227.72 237.97 DOWN DOWN DOWN
INFY 1650.2 1617 1683 1594.35 1333.46 UP UP UP
IOC 105.9 103 109 105.72 97.08 DOWN DOWN DOWN
IRCTC 2487.6 2438 2537 2349.09 1734.68 UP UP UP
ITC 214.25 208 221 207.32 204.96 UP UP UP
JINDALSTEL 421.7 413 430 407.42 334.72 UP UP DOWN
JSWSTEEL 757.35 742 772 716.21 513.33 UP UP UP
JUBLFOOD 3715.85 3642 3790 3429.58 2869.15 UP UP UP
KOTAKBANK 1777.2 1742 1813 1717.73 1798.76 UP UP DOWN
L&TFH 89.2 86 92 90.18 88.55 DOWN UP DOWN
LALPATHLAB 3963.1 3884 4042 3581.4 2673.91 UP UP UP
LICHSGFIN 405.35 397 413 440.89 411.05 DOWN DOWN DOWN
LT 1610.35 1578 1643 1588 1366.38 UP UP UP
LUPIN 1150.85 1128 1174 1149.28 1060.77 DOWN UP DOWN
M&M 758.25 743 773 762.94 769.71 DOWN UP DOWN
MANAPPURAM 207.45 201 214 196.56 166.88 UP UP UP
MARICO 524.35 514 535 532.43 435.29 UP DOWN UP
MARUTI 7100.8 6959 7243 7227.44 7212.56 DOWN DOWN UP
MCDOWELL-N 647.85 635 661 653.32 584.07 UP DOWN UP
METROPOLIS 2886.6 2829 2944 2892.95 2284.87 UP DOWN UP
MGL 1168.85 1145 1192 1158.46 1090.73 DOWN UP DOWN
MINDTREE 2841.7 2785 2899 2727.84 1946.96 UP UP UP
MOTHERSUMI 236.15 229 243 237.2 194.66 UP UP UP
MRF 79159.65 77576 80743 80872.52 80680.98 DOWN DOWN DOWN
MUTHOOTFIN 1547.2 1516 1578 1561.27 1288.47 UP UP UP
NAM-INDIA 397.6 386 410 396.09 334.46 UP DOWN UP
NATIONALUM 94.2 91 97 88.23 57.53 UP UP UP
NAUKRI 5390.75 5283 5499 5248.67 4673.24 UP UP UP
NAVINFLUOR 3664.15 3591 3737 3766.04 2912.07 DOWN DOWN UP
NESTLEIND 18020.65 17660 18381 17876.35 17345.28 UP UP UP
NMDC 178.35 173 184 175.11 137.59 UP UP UP
NTPC 117.65 114 121 118.48 104.3 UP DOWN UP
ONGC 116.65 113 120 116.47 102.26 DOWN UP UP
PAGEIND 32584.35 31933 33236 32502.15 28146.68 UP DOWN UP
PEL 2666.35 2613 2720 2356.45 1762.34 UP UP UP
PETRONET 216.1 210 223 219.71 239.25 DOWN DOWN DOWN
PFC 133.55 130 138 127.45 117.04 UP UP UP
PFIZER 5807.25 5691 5923 5777.64 5113.46 UP UP UP
PIDILITIND 2223.3 2179 2268 2274.79 1846.15 UP DOWN UP
PIIND 3144.1 3081 3207 3053.77 2471.32 UP UP UP
PNB 39.55 38 41 40.02 36.99 DOWN DOWN UP
PVR 1336.35 1310 1363 1358.71 1327.5 DOWN DOWN UP
RAMCOCEM 1049.4 1028 1070 1091.82 938.44 UP UP UP
RBLBANK 177.55 172 183 201.84 216.38 DOWN DOWN DOWN
RECLTD 156.45 152 161 150.72 136.74 UP UP UP
RELIANCE 2089.05 2047 2131 2085.36 2031.85 DOWN UP DOWN
SAIL 141 137 145 131.22 86.46 UP UP UP
SBILIFE 1150.7 1128 1174 1076.94 920.82 UP UP UP
SBIN 435.65 427 444 431.68 343.7 UP DOWN UP
SHREECEM 28386.6 27819 28954 28213.69 26449.05 UP DOWN DOWN
SIEMENS 2085.55 2044 2127 1995.87 1772.33 UP UP UP
SRF 8906.1 8728 9084 8075.47 6042.63 UP UP UP
SRTRANSFIN 1315.95 1290 1342 1391.43 1247.15 DOWN DOWN UP
SUNPHARMA 785.2 769 801 713.06 616.31 UP UP UP
SUNTV 542.15 531 553 540.97 495.3 UP DOWN UP
TATACHEM 823.65 807 840 768.71 614.76 UP UP UP
TATACONSUM 781.35 766 797 766.08 631.5 UP UP UP
TATAMOTORS 300.05 291 309 301.21 268.52 DOWN UP DOWN
TATAPOWER 135.15 131 139 125.82 93.88 UP UP UP
TATASTEEL 1428.85 1400 1457 1319.69 843.25 UP UP UP
TCS 3309.8 3244 3376 3218.7 3052.83 UP UP UP
TECHM 1264.6 1239 1290 1135.14 985.75 UP UP UP
TITAN 1787.75 1752 1824 1732.4 1515.03 UP UP UP
TORNTPHARM 3063.95 3003 3125 3029.4 2701.47 UP UP UP
TORNTPOWER 475.05 466 485 470.1 384.72 UP UP UP
TRENT 919.35 901 938 910.84 771.57 UP UP UP
TVSMOTOR 569.95 559 581 586.87 561 DOWN DOWN DOWN
UBL 1429.75 1401 1458 1430.55 1221.47 UP UP UP
ULTRACEMCO 7527.65 7377 7678 7426.76 6101.37 UP DOWN UP
UPL 777.3 762 793 812.74 614.59 DOWN DOWN UP
VEDL 314.15 305 324 281.18 206.03 UP UP UP
VOLTAS 1047.9 1027 1069 1034.83 940.23 DOWN UP UP
WIPRO 598 586 610 575.57 450.84 UP UP UP
ZEEL 196.55 191 202 206.18 207.1 DOWN DOWN DOWN
- - - - - - - - -
- - - - - - - - -
- - - - - - - - -
- - - - - - - - -
- - - - - - - - -
- - - - - - - - -
All level indicated above are based on cash market prices.
Pivot Point
PP : Pivot Point : This is trigger point for weekly buy/sell based on the price range of the previous week.
R1 : Resistance one : 1st Resistance over PP. R2 : Resistance two : 2nd Resistance over R1.
S1 : Support one : 1st support after PP. S2 : Support Two : 2nd support after S1.
As per the tool, the trader should take BUY position just above PP and keep the stop loss of PP and the first target would be R1.
If R1 is crossed then R2 becomes the next target with the stop loss at R1.
Similarly if price goes below PP the trader should SELL and keep the PP as Stop loss and the first target would be S1.
If S1 is crossed then S2 becomes the next target with the stop loss at S1.
This is a trading tool. The key to use of this tool is the use of STOP LOSS.
GROWING TOGETHER www.hpmgshares.comMonday
WEEKLY PIVOT TABLE (Commodities) 09th August, 2021
Stock CMP Support Resistance 21 DMA 200 DMA Intraday Short Term Long Term
ALUMINIUM 1 205.85 200 212 200.47 178.82 UP DOWN UP
CARDAMOM 1 1505 1475 1535 1478.42 2689.59 DOWN UP DOWN
CASTOR 1 5580 5468 5692 5492.38 4775.41 UP UP UP
CHANA 1 4900 4802 4998 4922.62 4976.94 UP DOWN UP
COPPER 1 732.5 718 747 738.96 670.65 DOWN DOWN UP
COTTON 1 27030 26489 27571 26364.76 22100.2 UP DOWN UP
CRUDEOIL 1 5096 4994 5198 5319.33 4370.55 DOWN DOWN DOWN
GOLD 1 46640 45707 47573 47820.09 47987.5 DOWN DOWN DOWN
GUARGUM5 1 7542 7391 7693 6767.24 6229.1 UP UP UP
GUARSEED10 1 4598 4506 4690 4310 4032.26 UP UP UP
JEERAUNJHA 1 13350 13083 13617 13289.05 13659.3 DOWN DOWN UP
LEAD 1 176.3 171 182 177.46 166.15 UP DOWN UP
MENTHAOIL 1 938.2 919 957 961.69 961.63 DOWN DOWN UP
NATURALGAS 1 309.9 301 319 291.54 218.97 UP UP UP
NICKEL 1 1459.2 1430 1488 1448.25 1290.67 UP DOWN UP
RMSEED 1 7784 7628 7940 7450.71 6375.06 UP UP UP
RUBBER 1 17879 17521 18237 17165.24 14228.42 UP UP UP
SILVER 1 65000 63700 66300 67693.71 67383.63 DOWN DOWN DOWN
SYBEANIDR 1 9579 9387 9771 8756.19 5952.4 UP UP UP
ZINC 1 247.05 240 254 245.41 226.26 UP DOWN UP
GROWING TOGETHER www.hpmgshares.comHPMG SHARES & SEC. P. LTD
HPMG SHARES & SEC. P. LTD
B-201/202, Rajkamal,
S.V Road Next to Shreeji Arcade,
Kandivali (West),
Mumbai - 400 067.
+91 022 62317600
info@hpmgshares.com
DISCLAIMER: This is solely for information of clients of HPMG SHARES & SEC. P. LTD and does not construe to be an investment advice. It is also not intended as an offer or solicitation for the purchase and
sale of any financial instruments. Any action taken by you on the basis of the information contained herein is your responsibility alone and HPMG SHARES & SEC. P. LTD, its subsidiaries or its employees or
associates will not be liable in any manner for the consequences of such action taken by you. We have exercised due diligence in checking the correctness and authenticity of the information contained in this
recommendation, but HPMG SHARES & SEC. P. LTD or any of its subsidiaries or associates or employees shall not be in any way responsible for any loss or damage that may arise to any person from any
inadvertent error in the information contained in this recommendation or any action taken on basis of this information.
Technical analysis studies market psychology, price patterns and volume levels. It is used to forecast future price and market movements. Technical analysis is complementary to fundamental analysis and
news sources. The recommendations issued herewith might be contrary to recommendations issued by HPMG SHARES & SEC. P. LTD in the company research undertaken as the recommendations stated in
this report is derived purely from technical analysis. HPMG SHARES & SEC. P. LTD has based this document on information obtained from sources it believes to be reliable but which it has not independently
verified; HPMG SHARES & SEC. P. LTD makes no guarantee, representation or warranty and accepts no responsibility or liability as to its accuracy or completeness. The opinions contained within the report
are based upon publicly available information at the time of publication and are subject to change without notice. The information and any disclosures provided herein are in summary form and have been
prepared for informational purposes. The recommendations and suggested price levels are intended purely for trading purposes. The recommendations are valid for the day of the report however trading
trends and volumes might vary substantially on an intraday basis and the recommendations may be subject to change. The information and any disclosures provided herein may be considered confidential.
Any use, distribution, modification, copying, forwarding or disclosure by any person is strictly prohibited. The information and any disclosures provided herein do not constitute a solicitation or offer to
purchase or sell any security or other financial product or instrument. The current performance may be unaudited. Past performance does not guarantee future returns. There can be no assurance that
investments will achieve any targeted rates of return, and there is no guarantee against the loss of your entire investment.
POTENTIAL CONFLICT OF INTEREST DISCLOSURE (as on date of report)
Disclosure of interest statement – • Analyst interest of the stock /Instrument(s): - No. • Firm interest of the stock / Instrument (s): - No.
GROWING TOGETHER www.hpmgshares.comYou can also read