1H 2021 Results Presentation - 12 August 2021 - CDL | Investor Relations
←
→
Page content transcription
If your browser does not render page correctly, please read the page content below
1H 2021
Results Presentation
12 August 2021
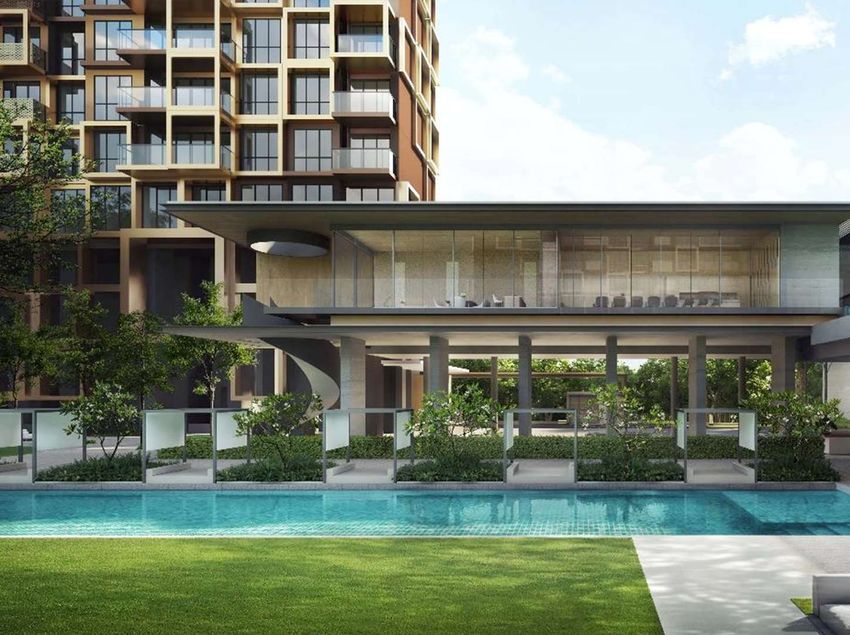
Artist’s Impression
Irwell Hill Residences I Singapore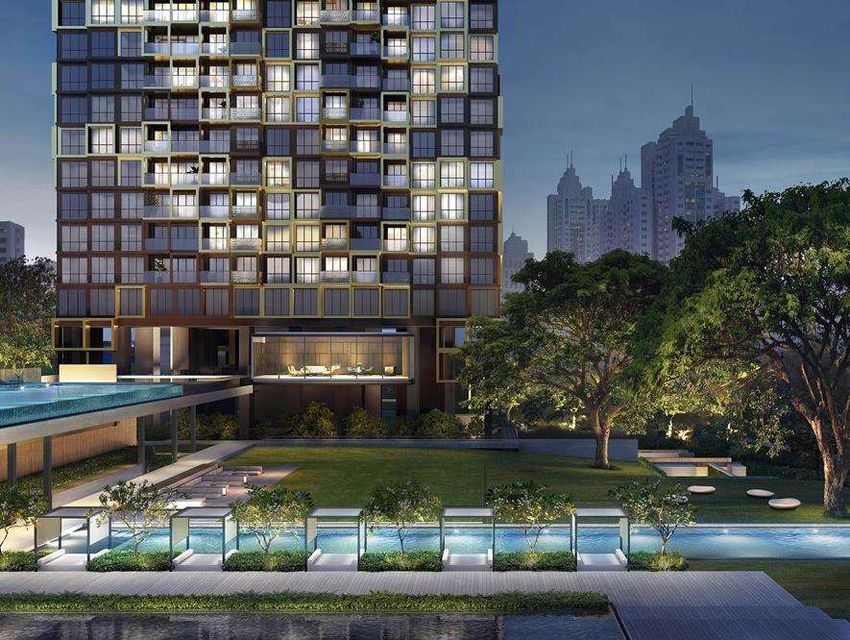
Agenda
➢ Overview &              ➢ Operations Review
  Strategic Initiatives        –   Singapore Operations
                               –   International Operations
➢ Financial Highlights         –   Hospitality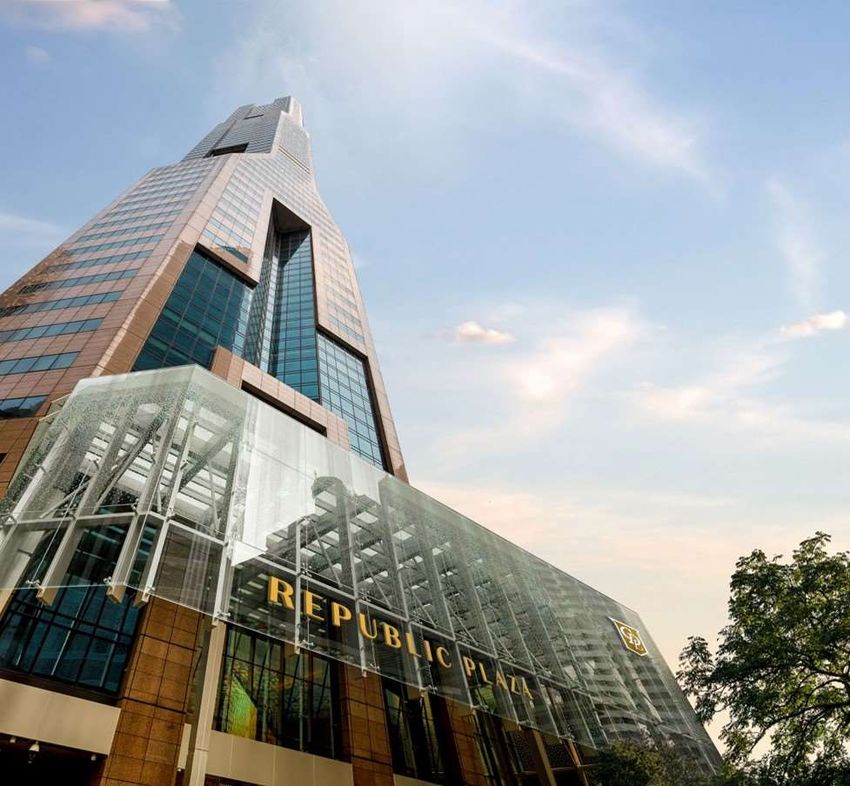
Overview
Key Financial Highlights – 1H 2021
          Revenue                        EBITDA                                  PBT                                    PATMI
1H 2021

          $1.2B                          $272.1MM                                $9.7MM                                 ($32.1MM)

          1H 2020
          $1.1B                          $189.7MM                                $13.8MM                                $3.1MM

     Increase in revenue is due to a steady increase in property development segment boosted by Whistler
     Grand, Amber Park and The Tapestry which accounted for 70% of the revenue from the property
     development segment in 1H 2021.

     Resilient EBITDA of $272.1MM.

     Profit before tax declined to $9.7MM (1H 2020: $13.8MM) mainly due to higher net financing costs and
     lower divestment gains.

     PATMI loss driven by higher tax expenses due to an absence of a substantial deferred tax credit
     recognised in 1H 2020 which was part of the New Zealand government’s COVID-19 Business Continuity
     Package.
            No fair values adopted on investment properties.
            Investment properties are stated at cost less accumulated depreciation and accumulated impairment losses.

                                                                                                                                    4
Key Financial Highlights – 1H 2021
          NAV per share                                          RNAV per share
1H 2021

          $9.22                                                  $14.22
                                                                                                     If FV gains on
                  1.7%                                                       0.3%                    investment properties          $17.00
                                                                                                     had been factored in           If revaluation surpluses of the
                                                                                                     and the Group’s hotels         hotel portfolio had been
          FY 2020:                                               FY 2020:                            continue to be stated          included (based on 2020/2021
                                                                                                     at cost                        internal & external valuations)
          $9.38                                                  $14.26

          Proposed Dividend Share Price Performance
1H 2021

          3.0                                                    $7.29^
          cents per share
                                                                             8.53%
                                                                                                     2021 HIGHEST - $8.28 (1 Apr)

          1H 2020:                                                $7.97
                                                                  (31 Dec)
          -
                                                                                                                                                                  $7.29
                                                                                                                                                                  (30 Jun)

              No fair values adopted on investment properties.
              Investment properties are stated at cost less accumulated depreciation and accumulated impairment losses.                              ^ As of 30 Jun 2021

                                                                                                                                                                             5
Key Operational Highlights – 1H 2021
Performance Summary
              ▪ SINGAPORE: Sold 971 units with total sales value of $1.7B*
              ▪ Strategic expansion of Singapore residential land bank with 2 GLS site acquisitions in 1H 2021:
                   ‒ Northumberland Road site       (Est 407 units)
                   ‒ Tengah Garden Walk EC site (Est 628 units)
Property
              ▪ CHINA: Sold 179 units with total sales value of RMB 502MM^ ($103.1MM)
Development
              ▪ AUSTRALIA: Sold 96 residential units with total sales value of A$79.9MM^ ($81.4MM)
              ▪ SINGAPORE: Resilient committed occupancy for core Singapore office & retail portfolio:
                  − Office: 90.6% (NLA: 1.7MM sq ft)
                  − Retail: 93.8% (NLA: 686,000 sq ft)
Asset
Management    ▪ OVERSEAS: Stable occupancy for office assets in London and China

              ▪ Overall improvements in hotel occupancies, though rates remained subdued due to COVID-19
                resurgence:
                   − Global occupancy: 42.6%        (▲ 3.2% pts YoY)
                   − Global RevPAR:      $54.1      (▼ 10.1% YoY)
Hotel              − Global ARR:         $126.9     (▼ 17.0% YoY)
Operations    ▪ Launch of M Social New York in end May, with healthy occupancy of 87% achieved in June 2021
              ▪ Continue to build pipeline, in active collaboration with capital partners to acquire new AUM
                   ‒ Supported IREIT’s acquisition of 27 retail assets from the France Decathlon portfolio through a 10-
                     year sale-and-leaseback arrangement for €110.5MM
                   ‒ Applications made for proposed IPO and listing on SGX-ST of a REIT with UK commercial assets
Fund
Management
                 * Includes Executive Condominiums (ECs) and share of JV partners, excludes Nouvel 18   ^ Includes share of JV associates

                                                                                                                                            6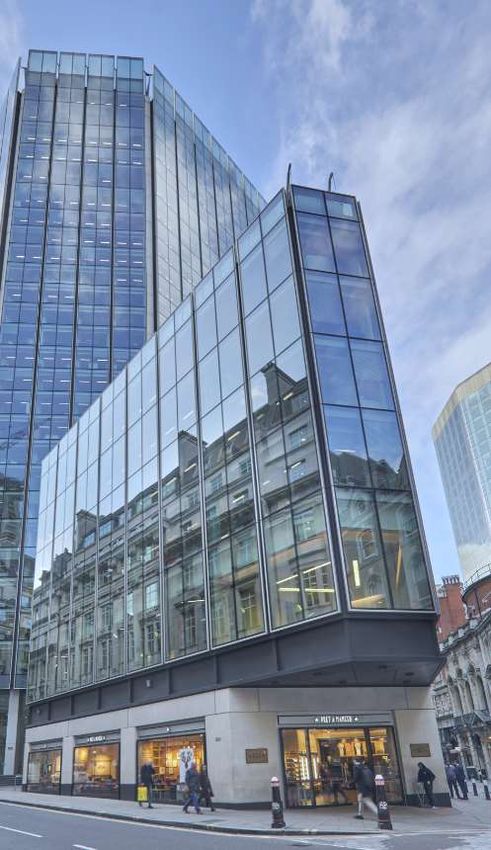
Portfolio Composition by Segment – 1H 2021

    EBITDA *                                           1H 2021           Total Assets ^
   $272.1MM                                                              $24.5B

$182.3MM                                      Property Development             $10.3B

($47.2MM)                                           Hotel Operations           $5.8B

$92.3MM                                        Investment Properties           $7.0B

 $44.7MM                                                        Others         $1.4B

    * Earnings before interest, tax, depreciation and amortisation.
    ^ Excludes tax recoverable and deferred tax asset.

                                                                                          7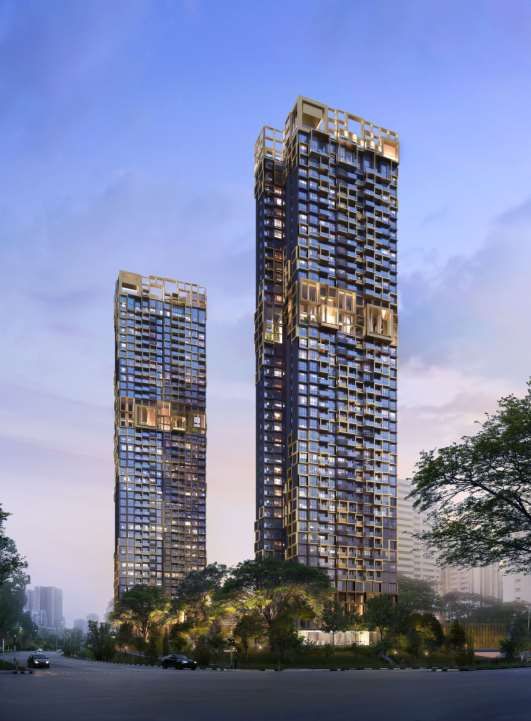
Global Portfolio Overview
The Group's diversified portfolio enables it to weather cyclical typhoons from time to time

                            Others
                             17%

                     US
                     6%                                  Singapore   Total Assets ^:
                                Assets by                   46%
                                Geography                              $24.5B
                    China
                     17%

                                     UK
                                     14%

         ^ Excludes tax recoverable and deferred tax asset.                   As at 30 Jun 2021

                                                                                                  8
Strategic
Initiatives
GET Strategy
Accelerate Transformation of Asset Portfolio and Business Operations for Growth

                                                                                              Growth
   Growth                                                                                  ➢ Build development
                                                                                            pipeline & recurring

   Enhancement                                                                                 income streams

   Transformation                          Artist’s Impression
                                           Irwell Hill Residences I Singapore

 Enhancement                                                                    Transformation
 ➢ Enhance asset portfolio                                                        ➢ Transform business via
 ➢ Drive operational                                                                         new platforms:
   efficiency                                                                          Strategic Investments,
                                                                                          Fund Management,
                                                                                                 Innovation &
                                                                                              Venture Capital

                                           Artist’s Impression
                                           Shenzhen Longgang Tusincere Tech Park I China

                                                                                                                   10
G.E.T Strategy & Focus 2021
G rowth
➢ Build development
• Launched Irwell Hill Residences in April and
launching CanningHill Piers in Q4 2021 (Liang Court
redevelopment project)
pipeline & recurring • Active land replenishment of 2 GLS sites:
income streams Northumberland Road and Tengah Garden Walk
Irwell Hill Residences
Artist’s Impression
• Asset enhancement initiatives for Palais Renaissance,
E nhancement
➢ Enhance asset portfolio
King’s Centre, Tower Club and Jungceylon
• Redevelopment of Fuji Xerox Towers (CBD Incentive
Scheme) and Central Mall (Strategic Development
➢ Drive operational Incentive Scheme)
efficiency
• Repositioning of hotels: M Social Times Square NY
Fuji Xerox Towers redevelopment
and M Social Paris Opera Preliminary Artist’s Impression
T ransformation
➢ Via new platforms:
Fund Management, Investments,
• Strategic review of M&C portfolio
• Fund management: Application of IPO for the
listing of REIT on SGX-ST with UK commercial
Innovation & Venture Capital assets
125 Old Broad Street
11Growth
➢Build development
Strategic
pipeline & recurring
income streams
Initiatives
Artist’s Impression
Irwell Hill Residences I SingaporeGROWTH
Diversified Residential Launch Pipeline
Singapore Pipeline ranges from Mass Market to High-end Projects
Tengah Garden Walk EC^
CanningHill Piers^
(696 units)
(Est 628 units) Launch Pipeline
~ 2,000 units*
Upcoming Launches
CanningHill Piers^
Source: HDB
(Residential component of Liang Court Q4 2021
Land cost: $400.3MM redevelopment)
Artist’s Impression ($603 psf ppr)
Northumberland Road^ 1H 2022
Tengah Garden Walk EC^ 2H 2022
Residential component of
Fuji Xerox Towers 2H 2022
Redevelopment of redevelopment #
Fuji Xerox Towers#
(Est 256 units)
Northumberland Road^
(Est 407 units)
Preliminary Artist’s Impression
Land cost: $445.9MM
($1,129 psf ppr)
* Includes JV partners share. ^ JV project. # Subject to Authorities’ Approval. 13GROWTH
Upcoming Launch in Q4 2021
CanningHill Piers – A New Landmark Residence Nestled between Fort Canning Hill and
Singapore River, by renowned Danish architecture firm Bjarke Ingels Group
Location Tenure Equity Total Units Site Area Est Total Saleable Area
Stake (sq ft) (sq ft)
River Valley Road / Tan Tye Place /
99-year 50% 696 139,128* 614,089
Clarke Quay
Singapore’s only hill and river dual-frontage residential development in District 6, a 50-50 JV
with CapitaLand
• Comprises a 48-storey (180 metres) and a 24-storey (100 metres) residential tower with exclusive units
ranging from 1- to 5-Bedroom Premium apartments, Sky Suites and a Super Penthouse. Both towers are
connected by a sky bridge at Level 24
• Part of an integrated development that includes a 21-storey Moxy
hotel, a 20-storey Somerset serviced residence and a 2-storey
commercial podium (CanningHill Square)
• Excellent connectivity with a direct link to Fort Canning MRT station
and a mere eight-minute walk to Clarke Quay MRT station, and
with convenient access to the CBD and CTE
• Enjoys views of Fort Canning Hill, Singapore River, CBD, Marina
Bay and beyond from a wide range of lifestyle facilities such as Sky
Gym, Infinity Lap Pool, Sky Gourmet, Flexi Lounge, Function
Room, Sky Bridge on Level 24, and panoramas of Marina Bay from Preliminary Artist’s Impression
the luxurious Sky Club on Level 45
* For entire integrated development
14GROWTH
Active Land Replenishment
Strategic Acquisition of District 8 Site at Northumberland Road
Site Area
Location Tenure Equity Stake Total Units
(sq ft)
Northumberland Road 99-year 50% Est 407 94,000
Top bid placed for first Government Land Sales (GLS)
tender in 2021 – Tender closed on 27 April 2021
• Strategic top bid of $445.888MM placed by CDL and JV
partner MCL Land
➢ Coveted city fringe site drew 10 bids
➢ 5.7% margin over the second highest bid
• Proposed scheme: Mixed-use project with 407 residential
apartments of up to 23 storeys and commercial retail space
(including infant care and childcare centre) on ground floor
• Excellent connectivity with direct access to Farrer Park MRT
station, short drive to the CBD and Singapore Sports Hub with
easy access to major expressways (e.g. CTE and PIE) Site Information
• Site is close to amenities such as City Square Mall, Site Area 8,732.9 sqm
Connexion, Farrer Park Hospital, Centrium Square, Jalan Maximum GFA 36,679 sqm
Besar Sports Centre, numerous F&B establishments, as well
as seven primary schools (within 2km), including St. Joseph’s Land Price $445.888MM
Preliminary Artist’s Impression
Institution Junior and Anglo-Chinese School (Junior) / $1,129 psfppr
Artist’s Impression
15GROWTH
Active Land Replenishment
Strategic Acquisition of Prime Tengah Garden Walk EC Site
Site Area
Location Tenure Equity Stake Total Units
(sq ft)
Tengah Garden Walk 99-year 50% Est 628 237,032
Top bid placed for prized EC site in Tengah New Town – Tender closed on 25 May 2021
• Strategic top bid of $400.318MM placed by CDL and JV partner MCL Land
➢ Hotly contested site drew 7 bids; won by the narrowest of margins at 0.03% over the second highest bid
• Proposed scheme: an EC project with 12 blocks of up to 14 storeys with around 628 residential units
• Exceptional convenience:
➢ Within walking distance of three MRT stations on the
upcoming Jurong Region Line – 500 metres to Tengah
MRT station and 600 metres to Hong Kah MRT station
and Tengah Plantation MRT station
➢ Less than a 30-minute drive to the CBD and Orchard
Road via major arterial roads and the PIE
• Site is close to Jurong Innovation District, Jurong Lake Image: HDB
District, Tengah’s future Town Centre, Tengah New Town, as
well as Primary Schools (within 2km), including Shuqun Site Information
Primary School and Princess Elizabeth Primary School, and
Site Area 22,020.8 sqm
Secondary Schools, including River Valley High School,
Preliminary Artist’s Impression
Dulwich College (Singapore) and Canadian International Maximum GFA 61,659 sqm
School (Lakeside Campus) Land Price $400.318MM
/ $603 psfppr
Artist’s Impression
16Enhancement
Strategic
➢Enhance asset portfolio
Initiatives
➢Drive operational efficiency
Republic Plaza I SingaporeENHANCEMENT
Focus on Asset & Operational Efficiency
Improve Asset Positioning and Relevance, Enhance Asset
Portfolio and Drive Operational Efficiency and Returns
Asset Rejuvenation
and Redevelopment
Reposition assets and replenish
land bank through schemes such
as the CBD Incentive Scheme
and Strategic Development
Incentive Scheme
Asset Enhancement Initiatives Operational Efficiency
(AEI)
Deriving synergy through
consolidating functions &
Rejuvenating existing assets to
inculcating the CDL culture
unlock value and strengthen
for success through innovation,
recurring income streams
teamwork, execution &
customer focus
Artist’s Impression
18ENHANCEMENT
Embedding Strategic ESG Initiatives
Driving Business Transformation through Strong Sustainability Focus
Environmental Performance
▪ First Singapore real estate conglomerate in Southeast Asia to sign WorldGBC’s Net Zero
Carbon Buildings Commitment – pledging net zero operational carbon for all wholly-owned
assets and developments under direct operational and management control by 2030
▪ 5-year $1.22B Green Loan secured by South Beach Consortium – one of Singapore’s largest green loans
▪ Accelerated renewable energy deployment and innovative circularity solutions; active R&D pilots, e.g. acoustic friendly
ventilation window, bifacial BIPV panels, 3D printed vertical farming system
▪ Raised the bar for prompt and transparent ESG reporting in scope and depth via digital format; advanced CDL’s pioneering
sustainability reporting framework to harmonise leading standards and frameworks including GRI, SASB, IIRC, CDP, SDG,
TCFD, and CDSB
1H 2021 Highlight: “Change the Present, Save the Future” Exhibition at CDL Green Gallery
➢ Jointly organised with NParks, the exhibition focuses on
building climate resilience through global collaboration
➢ Reinforces collaborative efforts between private and public
sectors in support of the Ministry of Sustainability and the
Environment’s (MSE) Climate Action Week 2021 and the
Singapore Green Plan 2030
➢ Net zero-certified exhibition
leverages energy-efficient
fittings, on-site solar
generation and off-site
renewable energy
The exhibition launch was graced by Ms Grace Fu, Minister for
Sustainability and the Environment (2nd from left)
19ENHANCEMENT
Strategic Focus on Green Financing Streams
Enhancing Linkage between Capital Markets and Sustainability Performance
Green Bonds & Loans
Apr 2017: $100MM Apr 2019: $500MM Dec 2020: $470MM Apr 2021: $1.22B
>$2.5B 1st Green Bond issued
by a Singapore
company
1st Green Loan for New
Property Developments
Green Revolving
Credit Facility
South Beach Consortium
5-year Green Loan for
South Beach*
Sustainable
financing Sustainability Innovation & New Developments
secured
since 2017 Sep 2019: $250MM – SDG Innovation Loan Innovation project: digiHUB
Secured interest rate discount with digiHUB
innovation, a SMART enterprise platform that
centralises portfolio building management developed
by CBM (CDL’s facilities management subsidiary)
➢ digiHUB provides macro and micro views of
building performance to management
➢ The platform targets to use AI technologies to
predict maintenance issues
* JV project
20ENHANCEMENT
ESG Achievements
Ranked on 13 Leading Global Sustainability Ratings and Rankings
LATEST ESG MILESTONES
Ranked #4
out of 519 companies
Singapore
Governance and
Only Singapore Only company in Southeast Top 7% of CDP Ranked world’s top real estate Transparency
real estate company Asia & Hong Kong to achieve participants, company, top Singapore Index 2021
listed for 4th double ‘A’ honour for both assessed for company, and 1st & only
consecutive year climate change & water security supplier Singapore company listed on
for 2nd consecutive year engagement on Global 100 for
climate change 12 consecutive years
Since 2011 ‘AAA’ since 2010 Since 2002 Since 2017 Rated Prime Since 2018
Ranked #3 out of 577
Since 2014 Since 2018 Since 2020 Since 2016 companies in 2020
21ENHANCEMENT
Asset Enhancement Initiatives (AEI)
Palais Renaissance
Scope
• Widen main entrance and create alfresco F&B area
• Revamp of common areas
• Addition of an escalator to the basement
Target Completion:
Mall Entrance 1H 2022
Design Inspiration From Traditional French ‘Savoir Faire’
Atrium & Concierge Commercial Office Podium Lift Lobby @ L1, L2, L3 Insta-worthy Feature Wall at Basement
22ENHANCEMENT
Asset Enhancement Initiatives (AEI)
King’s Centre
Scope
• Revamp main lobby and common areas like lift lobbies, lift
interiors and restrooms
• Reconfigure existing floor layout for efficiency
• Air-conditioning system upgrade for energy efficiency
Target Completion:
Main Entrance 1H 2022
Design Inspiration From Imperial Gardens and Classical Orders
Main Lobby Basement Lift Lobby Typical Floor Lift Lobby
23ENHANCEMENT
Asset Enhancement Initiatives (AEI)
Tower Club Ba Xian Restaurant
Scope
▪ Increase functional space by slabbing over void space in the middle of
the restaurant and creating flexible spaces for hosting of
events/banquets
▪ Revamp of main dining hall, private dining rooms and restrooms
Target Completion:
Main Entrance
Main Dining Hall Q4 2021
Design Inspiration from the silk road and the elegance of the ancient commodity
Main Entrance Private Dining Room Restroom
24ENHANCEMENT
Asset Enhancement Initiatives (AEI)
Jungceylon, Phuket
Functional Upgrade
• Refurbishment of the Port Zone: Replacement of
canopy, flooring, and cables, and water fountain
repair works
• Functional repair works for restrooms
• Revamp of 4 sets of passenger lifts
• Facade painting and repair works
Target Completion:
Q2 2022
25ENHANCEMENT
Asset Repositioning – M Social New York
Opening of M Social New York in May 2021 – First M Social Property in US
480-room hotel located in the heart of Times Square
Debut in Times Square, New York on 27 May
New lifestyle offering will merge the energy of Times
Square with contemporary design, vibrant art and
inviting rooms to create an engaging retreat for
guests to gather, work and discover the city
Walking distance to New York’s best attractions,
including Broadway, the Theatre District, Central
Park and Fifth Avenue
Accessible, comfortable Private oasis with Artistically
and practical rooms unobstructed city views infused
26ENHANCEMENT
Asset Repositioning – M Social Paris
Opening of M Social Paris Opera in Sep 2021 – First M Social Property in Europe
163-room hotel located on Boulevard Haussmann in the Opera district
Works are ongoing to re-brand Millennium Opera
Paris as M Social Paris Opera – the Group’s first M
Social in Europe
New lifestyle rebranding will merge the elegance
of the historical Parisian DNA with contemporary
design, vibrant art and inviting rooms
Walking distance to some of the city’s most famous
landmarks including the Louvre, the Sacré-
Cœur and the Moulin Rouge
Refurbished rooms
Signature Room La Sweetie La Grande Sweetie
27ENHANCEMENT
Asset Rejuvenation to Unlock Value
Redevelopment of Existing Assets – Realise GFA uplift from Incentive Schemes
Proposed redevelopment under
Fuji Xerox Towers CBD Incentive Scheme*:
46-storey freehold mixed-use integrated development comprising office,
retail, residential and serviced apartments
Residential Use Serviced Commercial
Apartments Use Use
35%
(256 units^) 25% 40%
➢ Provisional Permission obtained in May 2021:
GFA uplift by 25% to approx. 655,000 sq ft
➢ Building decommissioning in progress; all tenanted units vacated as at 1 July 2021
Preliminary Artist’s Impression
Proposed redevelopment under
Central Mall
Strategic Development Incentive Scheme*:
Mixed-use integrated development comprising office, retail,
serviced apartments and hotel
Commercial Hotel & Serviced
Use Apartments Use
70% 30%
Preliminary Artist’s Impression Potential uplift in GFA
* Subject to authorities’ approval ^ Planned number of units (subject to authorities’ approval)
28Transformation
Strategic
➢Via new platforms
Initiatives
125 Old Broad Street I London, UKTRANSFORMATION
Fund Management
Target AUM:
US$5B
Organic AUM by Merger &
Growth 2023 Acquisitions
TWO-PRONGED STRATEGY
Leverage CDL’s core capabilities Accelerate growth of Fund
to drive scale and Management business through
maximise business returns acquisitions
Singapore-listed REIT platform with
UK commercial assets
➢ Relevant applications made to various regulatory
authorities
➢ Proposed IPO and listing is subject to market conditions,
requisite regulatory and other approvals obtained, and
execution of definitive agreements
Expansion into Private Rented Sector
30TRANSFORMATION
IREIT Global
71% Growth in AUM
IREIT AUM (€MM)
Since investment in Apr 2019, AUM grew from
€504.9MM ($808.7MM) to €861.2MM ($1.38B)* € 1,000.0
€ 900.0 € 861.2
CDL acquired a total of 21% stake in
IREIT Global’s units: € 800.0
• 12.5% in 2019 € 719.6
• 8.4% in April 2020 € 700.0
€ 600.0
Successfully Equity Fund Raising Exercise
€ 504.9
1. Oct 2020: recorded a successful fund-raising € 500.0
exercise of $143MM which was 1.66x
€ 400.0
oversubscribed
36
2. July 2021: another successful fund-raising € 300.0 Properties
exercise of $127MM which was 1.51x 9
oversubscribed € 200.0 Properties
5
€ 100.0 Properties
€ 0.0
Apr Sep Jun
* As at June 2021 2019 2020 2021
31Financial Highlights
Financial
Highlights
Property Hotel Investment Others
Development Operations Properties
1H 1H 1H 1H 1H 1H 1H 1H
2021 2020 2021 2020 2021 2020 2021 2020
Revenue $628MM $464MM Revenue $317MM $355MM Revenue $171MM $186MM Revenue $76MM $68MM
PBT $119MM $115MM PBT ($143MM) ($208MM) PBT $10MM $26MM PBT $24MM $81MM
▪ Increase in revenue mainly due to timing ▪ This segment continued to be impacted ▪ Decrease in revenue and PBT was mainly ▪ PBT decrease was due to:
of revenue recognition by the prolonged COVID-19 pandemic due to
✓ 1H 2021 contribution largely from The which affected the global hospitality sector ✓ Lower contribution from Jungceylon Included in 1H 2020 was
Tapestry, Whistler Grand, Amber with travel restrictions and steep reduction Retail Mall, Phuket by $12.1MM as the ✓ Contribution from Sincere of $34MM
Park, Hongqiao Royal Lake Shanghai, in F&B spend mall was closed since March 2021 with comprising mainly interest income in
Shenzhen Longgang Tusincere Tech the lockdown of Phuket and extensive relation to Sincere loan and bond
Park and New Zealand property sales ✓ Global RevPAR declined 10% driven rebates was given to tenants in 1H ✓ Divestment gains of $26MM largely
✓ 1H 2020 contributions largely from The by decline in average room rate. 2021 due to the disposal of Sceptre
Tapestry, Whistler Grand, Amber Park, Green shoots of recovery seen ✓ Lower rental from CDLHT hotels Hospitality Resources
Gramercy Park, Hongqiao Royal Lake towards end of June 2021 accounted for as investment properties
Shanghai and New Zealand property due to disposal of Novotel Clarke Quay Excluding the above, this segment would
sales ✓ Lower losses for 1H 2021 mainly and Novotel Brisbane in 2020 have registered a $4MM increase in PBT,
▪ PBT increase is: due to absence of impairment losses ✓ Lower contribution from Fuji Xerox in line with the increase in revenue
✓ Boosted by negative goodwill of $36MM (1H 2020:$34MM). This was partially as most of the tenants vacated the
was recognised for Shenzhen offset by lower divestment gains in 1H building in 2021. The building will be
Longgang Tusincere Tech Park 2021 (1H 2021: $15MM for demolished in 2H 2021
✓ Excluding the negative goodwill of Christchurch Land; 1H 2020: $26MM
Shenzhen, this segment would have for Cincinnati Hotel)
registered a $36MM decrease in PBT
due to
- higher financing cost expensed off
for new projects
- lower profit margins for the
development projects with profit
recognition in 1H 2021
- slower recognition of profits
progressively for projects due to
slower construction progress due to
COVID-19Financial Highlights
Revenue by Segment for Half Year (2019 – 2021)
$1,597MM $1,073MM $1,192MM
1,000
785
800
628
$ (MM)
600 536
464
400 355
317
208 186
200 171
68 68 76
0
1H 2019 1H 2020 1H 2021
Property Development Hotel Operations Investment Properties Others
34Financial Highlights
EBITDA by Segment for Half Year (2019 – 2021)
$661MM $190MM $272MM
440
400
360 334
320
280
240 197
$ (MM)
200 182
160
147
116 108
120 92
80 61 45
40 14
0
(40)
(80) (47)
(120)
(160) (126)
1H 2019 1H 2020 1H 2021
Property Development Hotel Operations Investment Properties Others
35Financial Highlights
Profit Before Tax by Segment for Half Year (2019 – 2021)
$490MM $14MM $10MM
280 258
240
200 180
160 119
115
120 81
80
$ (MM)
29 23 26 24
40 10
0
(40)
(80)
(120)
(160) (143)
(200)
(240) (208)
1H 2019 1H 2020 1H 2021
Property Development Hotel Operations Investment Properties Others
36Financial Highlights
Strong Balance Sheet & Liquidity Position
Sufficient Financing Balanced
Gearing
Liquidity Flexibility Debt Profile
Net Gearing Total Cash Interest Cover % of
Ratio 1 Fixed Rate Debt
97% $2.8B 2.5x 33%
FY 2020: 93% FY 2020: $3.2B FY 2020: 3.4x FY 2020: 34%
Net Gearing 2 Cash and Available Average Average
(include fair value) Committed Credit Borrowing Cost Debt Maturity
Facilities
65% $4.4B 1.7% 2.0 years
FY 2020: 62% FY 2020: $5.2B FY 2020: 1.8% FY 2020: 2.3 years
1 Excludes non-cash impairment losses on investment properties and property, plant and equipment, net loss from Sincere and negative goodwill
2 After taking in fair value on investment properties
37Financial Highlights
Prudent Capital Management
➢ Balanced debt expiry profile
➢ Balanced debt currency mix – adopting a natural hedging strategy
➢ Average borrowing cost kept low
Well-Spread Debt Maturity Profile
4,800 39% Others (2.0%)
Bond Bank Loan RMB (5.5%)
4,400 160 222
Debt $ (MM)
4,000 JPY (4.5%) 633
3,600 521
3,200 USD (9.2%)
2,800 1,063
2,400 17% 17% Debt
2,000 4,280 14%
134
1,600 890
Currency 5,733
1,200 7% 689 6%
800 1,803 Mix SGD
400 1,017 944 (49.8%)
400 451
685
0 59
GBP (29.0%) 3,340
2021 2022 2023 2024 2025 2026
onwards
$11,512MM
38Operations Review
Singapore
Operations
Property Development
Singapore Property Market
Property Price Index – Residential (2014 – Q2 2021)

                                                                   Price Increase
                             All Residential                        (7.1% YoY)
                                                               Residential prices continue to
                                                               increase for five consecutive
 180                                                                     quarters

                                                                                                    Q2 21: 163.5
 160

 140

 120
       Q1 Q2 Q3 Q4 Q1 Q2 Q3 Q4 Q1 Q2 Q3 Q4 Q1 Q2 Q3 Q4 Q1 Q2 Q3 Q4 Q1 Q2 Q3 Q4 Q1 Q2 Q3 Q4 Q1 Q2
       14 14 14 14 15 15 15 15 16 16 16 16 17 17 17 17 18 18 18 18 19 19 19 19 20 20 20 20 21 21

                                                                                                Source: URA, Q2 2021

                                                                                                                       41
Singapore Property Market
• Private residential market continues to show signs of recovery with URA Private Residential Property
Price Index registering a 4.1% increase in 1H 2021 as compared to end 2020.
• Robust primary home sales in 1H 2021 with 6,459 units sold registering a 67.2% increase as
compared to 1H 2020.
Price Growth
Sales
Volume
Sales Volume vs Price Growth (%)
25,000 20.0%
17.6% 22,197
Price growth of 16.8% over 15.0%
20,000 the 5-year period from
16,292 15,904
1H 2016 – 1H 2021
10.0%
15,000 14,688 14,948
5.9% 7.9%
10,566 4.1% 5.0%
2.8% 2.7% 9,982
10,000 1.7% 1.1% 8,795 9,912
1.1% 2.2%
7,316 7,440 7,972 6,459 0.0%
-4.7%
5,000 -3.1%
-4.0% -3.7% -5.0%
4,264
- -10.0%
2008 2009 2010 2011 2012 2013 2014 2015 2016 2017 2018 2019 2020 1H
2021
CCR RCR OCR Price growth (year on year)
Source: URA Statistics
42Singapore Property Development
Residential Units Sold by CDL
1H 2020 1H 2021 Majority of units sold were
Irwell Hill Residences, Amber
Sales Value
Park and Sengkang Grand
$1,715,560
Residences projects
233.3% YoY
971 832,386
Units Sold
172.8% YoY
1H 2021
Mainly luxury projects sold
332,631 Period Project Market Units
356
$514,662 Segment Sold
Irwell Hill Residences Luxury 332
1H Amber Park Luxury 172
2021
Sengkang Grand
Mass 124
Residences
The Tapestry Mass 105
1H
Whistler Grand Mass 78
No. of Units* Sales Value* Total Floor Area* 2020
($'000) (sq ft) Piermont Grand Mass 92
* Includes Executive Condominiums (ECs) and share of JV partners, excludes Nouvel 18
43Singapore Property Development
Resilient / Strong Sales Performance for 1H 2021 Amid Pandemic
➢ Sold 971 units with total sales value of $1.7B for 1H 2021^
Steady Sales for Launches from 2018 – 2021
Launch Project Location Tenure Total Total Units % Sold* Achieved Average
Year Units Sold* Selling Price (ASP)*
2021 Irwell Hill Residences Irwell Bank Road 99-year 540 347 64% >$2,640 psf
2020 Penrose Sims Drive 99 years 566 488 86% $1,589 psf
Boulevard 88 Orchard Boulevard Freehold 154 118 77% >$3,770 psf
Amber Park Amber Road Freehold 592 446 75% >$2,460 psf
Haus on Handy Handy Road 99 years 188 39 21% $2,840 psf
2019 Piermont Grand Sumang Walk 99 years 820 802 98% >$1,100 psf
Sengkang Grand Residences Sengkang Central 99 years 680 551 81% $1,720 psf
Nouvel 18~ Anderson Road Freehold 156 105 67% >$3,310 psf
New Futura Leonie Hill Road Freehold 124 124 Fully sold $3,530 psf
The Tapestry Tampines Ave 10 99 years 861 861 Fully sold >$1,330 psf
2018 South Beach Residences Beach Road 99 years 190 182 96% $3,340 psf
The Jovell Flora Drive 99 years 428 310 72% $1,270 psf
Whistler Grand West Coast Vale 99 years 716 714 99% $1,410 psf
* As at 8 Aug 2021
Irwell Hill Residences Artist’s Impression
Piermont Grand Whistler Grand Boulevard 88 The Tapestry
^ Includes Executive Condominiums (ECs) and share of JV partners, excludes Nouvel 18 ~ Divested project marketed by CDL 44Singapore Operations Asset Management
Singapore Commercial Market
Property Price Index – Commercial (2014 – Q2 2021)                          Price Decline
                                                                             (-4.6% YoY)
                                                                          Slight increase in office
                                                                           price as compared to
 150                                                                          previous quarter

                                Office     Retail
 140

 130
                                                                                                      Q2 21: 121.1
 120

 110
                                                                                                      Q2 21: 102.4

                                                                  Price Decline
 100                                                               (-5.9% YoY)
                                                                Retail prices continue to
                                                                   decline for three
                                                                 consecutive quarters
 90

 80
       Q1 Q2 Q3 Q4 Q1 Q2 Q3 Q4 Q1 Q2 Q3 Q4 Q1 Q2 Q3 Q4 Q1 Q2 Q3 Q4 Q1 Q2 Q3 Q4 Q1 Q2 Q3 Q4 Q1 Q2
       14 14 14 14 15 15 15 15 16 16 16 16 17 17 17 17 18 18 18 18 19 19 19 19 20 20 20 20 21 21

                                                                                            Source: URA, Q2 2021
                                                                                                                   46
Singapore Commercial Market
Property Rental Index – Commercial (2014 – Q2 2021)
250 Rental Decline
(-3.6% YoY)
Office Retail Prime office rents increased
from the previous quarter
200
Q2 21: 162.7
150
100 Q2 21: 82.0
Rental Decline
50 (-13.9% YoY)
Slight decline in retail rents
from previous quarter
0
Q1 Q2 Q3 Q4 Q1 Q2 Q3 Q4 Q1 Q2 Q3 Q4 Q1 Q2 Q3 Q4 Q1 Q2 Q3 Q4 Q1 Q2 Q3 Q4 Q1 Q2 Q3 Q4 Q1 Q2
14 14 14 14 15 15 15 15 16 16 16 16 17 17 17 17 18 18 18 18 19 19 19 19 20 20 20 20 21 21
Source: URA, Q2 2021
47Singapore Commercial Portfolio
Strong Committed Occupancy and Positive Rental Reversion for Office Portfolio
(As at 30 June 2021) *
Office Retail
11 properties 8 properties
90.6% 93.8%
Committed Occupancy Committed Occupancy
1.7MM sq ft 686,000 sq ft
Net LettableArea REPUBLIC PLAZA
Net Lettable Area
CITY SQUARE MALL
Lease Expiry Profile by % of NLA
26.1% 28.3%
22.8% 24.1% 23.0%
19.9%^ 16.0% 6.2%^
14.9%
7.4% 19.1%
12.8% 3.7% 1.8%
2021 2022 2023 2024 2025 2026 & 2021 2022 2023 2024 2025 2026 &
beyond beyond
Office - Completed Office Retail - Completed Retail
Active tenant engagement of office tenants resulted in renewals Proactive engagement with retail tenants as country rolls out an
ahead of expiries. endemic roadmap with step-by-step re-opening.
* Includes all Singapore assets under management (including South Beach which is a joint venture project) in accordance with CDL’s proportionate ownership. Excludes Fuji
Xerox Towers, Central Mall Office Tower and Central Mall Conservation Unit which are under planning for redevelopment. 48
^ Refers to expiring leases that have been renegotiatedSingapore Commercial Portfolio
Trade Mix of Office & Retail Space by % of Total Gross Rental Income
(As at 30 June 2021) *
Office Retail
Supermarkets Electrical, Electronics, IT
& Value Store, & Telecommunications,
Sporting Goods, 6.6% 1.7%
Telecommunications, Banking, 3.7%
Media & Technology, Insurance & Fashion & Accessories,
12.8% Financial Others, 3.1% 8.3%
Services, 22.6%
Retail Products Medical & General
& Services, Services, 5.8%
12.2%
Leisure &
Entertainment, 4.9%
Energy, Commodities,
Maritime & Logistics, Education,
8.4% 5.8%
Jewellery, Optical & Food & Beverage,
Real Estate, Government, 0.4%
Watches, 2.2% 38.5%
17.6%
Manufacturing & Home Living, Lifestyle
Distribution, 5.8% & Gifts, 5.7%
Professional Health & Beauty,
Others, 1.0% 13.7%
Services, 19.2%
• Diverse and well-spread tenant mix across both office and retail segments:
➢ Office: Demand largely coming from wealth management, family office and technology companies. Trade
mix remains largely stable.
➢ Retail: Largely stable. Targeted support for tenants in trade-mix affected by COVID-19 restrictions.
* Includes all Singapore assets under management (including South Beach which is a joint venture project) in accordance with CDL’s proportionate ownership.
Excludes Fuji Xerox Towers, Central Mall Office Tower and Central Mall Conservation Unit which are under planning for redevelopment.
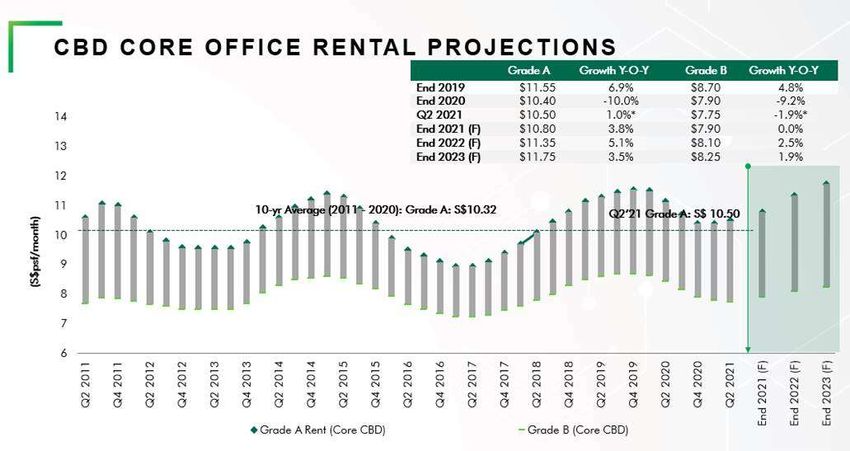
49Singapore Office Market Outlook
Grade A office rental rose 1.0% q-o-q to $10.50 psf per month in Q2 2021, the first rental
growth since Q4 2019 despite the emergence of COVID-19 clusters which led to the
tightening of measures in May 2021. Grade A market outlook expected to remain positive in
the medium-term, but possibly a longer recovery for Grade B market.
Source: CBRE Research
50Singapore Retail Market Outlook
Average prime island-wide retail rents declined by 0.4% q-o-q in Q2 2021. The retail sector
remained challenged with another round of stricter measures during Phase 2 (Heightened
Alert), coupled with default work from home arrangements and closure of tourism borders.
Nonetheless, the retail market is expected to recover from improvement in economic
activity and consumer sentiment on the back of the Singapore government’s road map to
transition Singapore towards a COVID-19 resilient nation.
Source: CBRE Q2 2021 Prime Retail Rents
51COVID-19 Support for Retail Tenants
Supporting tenants impacted by Phase 2 (Heightened Alert)
➢ Committed over $40MM in property tax and rental rebates to tenants in Singapore
and overseas since the beginning of COVID-19 in 2020
Singapore
First Phase 2 (Heightened Alert): 16 May to 13 June 2021
➢ Proactively provided targeted rental support, including rental waiver for tenants under mandated
closure and who cannot operate online within the period.
➢ Close to 90% of CDL’s retail tenants have received rental assistance.
Return of Phase 2 (Heightened Alert): 22 July to 18 August 2021
➢ Will comply with necessary regulations on rental support once announced by the authorities.
➢ Rent restructuring to selected tenants whose businesses continue to be badly affected by COVID-19.
➢ Rental payment flexibility for those facing severe cash flow issues.
During both periods of Phase 2 (Heightened Alert):
➢ Extension of carpark grace period to 30 minutes for all vehicles
at City Square Mall to support F&B tenants for both delivery
and takeaway orders.
➢ Absorption of all onboarding costs, commissions and all
delivery charges for retailers on CDL eMall* up till end August
2021.
* CDL’s online retail and F&B sales and delivery platform for its malls featuring more than 2,000 offerings from over
40 retailers and F&B outlets. 52International Operations
International Operations – Australia
Focus on Developments across Eastern Seaboard of Australia New South Wales
Queensland
Artist’s Impression
Waterbrook Bayview
Artist’s Impression
Brickworks Park (Residential)
➢ Launched 222-unit development consisting of apartments and
Artist’s Impression
townhouses located in the prestigious Alderley suburb in
North Brisbane and sold 58% units of 151 released.
Construction has commenced in 2021.
Victoria Artist’s Impression
Waterbrook Bowral
➢ Waterbrook Bowral, a 135-unit
retirement housing project, has pre-
sold 99% of the available villas (first
phase) and construction is in
progress.
Artist’s Impression Artist’s Impression Artist’s Impression
Project on Fitzroy (Mixed-Use) The Marker (Mixed-Use) Arco (Mixed-Use)
➢ The Marker has pre-sold 81% of the total 198 units, construction is underway with the project on track to
complete in 2022.
* As at 8 Aug 2021 54International Operations – China
Focus on Tier 1 and Tier 2 Cities Suzhou (苏州)
Continued Sales Momentum:
Chongqing(重庆) Total sales of RMB 4.04B generated
Relaunched in May 2018: for 92% of 1,813 units to date*^
➢ Phase 1 – 99% sold
Sold 111 units to date* ➢ Phase 2 – 67% sold
➢ Sales value of RMB 708MM
➢ HLCC Plaza, a 32,101 sqm Grade A
office tower is 86% occupied
➢ HLCC mall is 93% occupied
➢ Hotel expected to open in Q2 2022
Hong Leong City Center (丰隆城市中心)
Eling Palace (鹅岭峯)
Shanghai (上海) Asset rebranding
Handover since end
completed:
2020: ➢ Renamed as Hong Leong
Fully sold (869 units) Hongqiao Center – formerly
➢ Sales value of RMB known as Shanghai Hongqiao
2.52B to date* Sincere Centre (Phase 2)
➢ Remaining retail units ➢ As at 30 Jun 2021, committed
will launch in Sep 2021 occupancy for office reached
Artist’s Impression 100% and serviced apartments
Hong Leong Hongqiao Center (丰隆虹桥中心) remain stable at around 66%
Emerald (翡翠都会)
Shenzhen(深圳) Asset
enhancement:
➢ Operational since
Good Uptake post-COVID:
Jan 2019
67 villas sold todate*
➢ Sales value of RMB 1.54B
Artist’s Impression Yaojiang International (耀江国际)
Shenzhen Longgang Tusincere Tech Park Stable income stream:
(深圳龙岗区启迪协信科技园) ➢ Comprises 5 office towers with 2 levels of
Artist’s Impression basement carpark with GFA of 32,182 sqm
Completed acquisition in Feb 2021: For Illustration Only ➢ 75% of total NLA leased out for serviced
➢ Acquisition of 55% effective stake in the Hong Leong Plaza Hongqiao
apartments, a confinement centre and corporate
project located in China’s “Silicon Valley” for Hongqiao Royal Lake (御湖) (虹桥丰隆广场) office use; majority of leases for 15-year term
RMB 850MM
➢ Since Mar 2021, 196 units contracted with * As at 8 Aug 2021 55
sales value of RMB 409.4MM to date*
^ Excludes 143 units transferred to CDL’s wholly-owned
subsidiary for investment purpose.International Operations – Japan
Presence in 3 Cities – Tokyo, Osaka and Yokohama
PRS
Land Bank
Artist’s Impression
Freehold site in Shirokane Horie Lux, Osaka City Lux Yokohama
Development Site: Freehold residential asset Freehold residential asset
➢ Prime 180,995 sq ft freehold site acquired in Oct comprising 29 residential units & 5 consisting of 78 units
2014 retail units across 14-storeys
The Group’s portfolio of
PRS projects continue to B-Proud Tenmabashi Pregio Joto Chuo Pregio Miyakojima Hondori
enjoy stable rent and Freehold residential assets consisting of 130 units across 3
occupancy of above 90% properties in Osaka
56International Operations – UK Residential
Strengthening our Presence
31 & 33 Chesham Street 100 Sydney Street
Freehold developments consisting of 15 units# across 2 properties
in Prime Central London Artist’s Impression
Monk Bridge, Leeds
Construction in progress for a 665-unit Build-to-Rent (BTR)
development in Leeds
Artist’s Impression Artist’s Impression
Teddington Riverside
Ransomes Wharf Stag Brewery
Freehold development consisting of
239 apartments and houses^ in Teddington, Planning approvals Reassessment in progress for
South West London obtained for a 122-unit the former Stag Brewery site in Mortlake,
development in Battersea South West London
# 14 apartments and 1 retail unit 57
^ Includes 15 affordable housing apartmentsUK – Recurring Income Projects
Strengthening our Presence in London
NLA 328,806 NLA 209,840
Tenants 25 Tenants 4
Occupancy 94.6% Occupancy 86.8%
WALE^ 4.83 years WALE^ 5.78 years
Yield 4.9% Yield 4.7%
CDL’s CDL’s
£385MM £183MM
Acquisition Acquisition
Aldgate House
125 Old Broad Street
Artist’s Impression
Development House Artist’s Impression
Planning approval obtained for a 10-storey
office building in Shoreditch
^ WALE to expiry based on NLA 58Hospitality
Hotel Operations
  Trading Performance
                             1H 2021       1H 2020       Change
                              $MM           $MM            %
Revenue                       317.0         355.3         (10.8)
Profit Before Tax (PBT)      (142.9)       (208.2)        NM^
Adjusted EBITDA               (47.2)       (126.0)        NM^

Group RevPAR : ↓ 10.3% in 1H 2021 (reported currency)                Grand Copthorne Waterfront Hotel Singapore
               ↓ 10.1% in 1H 2021 (constant currency)
Revenue declined, but PBT and EBITDA decreases mitigated:
• The prolonged impact of COVID-19 continues to be felt as restrictions on international travel are still
  largely in place, and resurgence of COVID-19 cases resulted in intermittent lockdowns in respective
  regions. However, vaccination efforts are promising and have helped certain markets to open up faster.

• Hotels continue to drive cost saving measures, as well as seek quarantine-related businesses and
  alternative customer base to shore up revenues. The Group will also continue to push ahead with
  digitalisation and asset enhancement initiatives.

• Q2 2021 performance against Q2 2020 shows green shoots of recovery and all regions were able to
  record positive GOP for June 2021.

       ^NM: Not meaningful                                                                                        60
Hotel Operations (Q2 2021 vs Q2 2020)
Hotel Occupancy, Average Room Rate, and RevPAR by Region for CDL Group
Room Occupancy Average Room Rate RevPAR
Q2 Q2 Incr / Q2 Q2 Incr / Q2 Q2 Incr /
2021 2020 (Decr) 2021 2020 * (Decr) 2021 2020 * (Decr)
% % % pts $ $ % $ $ %
Singapore 71.6 74.3 (2.7) 108.8 87.5 24.3 77.9 65.1 19.7
Rest of Asia 40.9 15.5 25.4 109.5 86.2 27.0 44.8 13.4 234.3
Total Asia 52.9 40.2 12.7 109.1 87.2 25.1 57.8 35.1 64.7
Australasia 53.7 14.6 39.1 137.6 154.7 (11.1) 73.9 22.5 228.4
London 30.3 1.9 28.4 162.9 145.7 11.8 49.4 2.7 NM
Rest of Europe 35.0 5.3 29.7 130.3 108.5 20.1 45.6 5.7 NM
Total Europe 32.8 3.7 29.1 144.5 117.5 23.0 47.4 4.3 NM
New York 60.8 48.0 12.8 174.0 162.4 7.1 105.8 78.0 35.6
Regional US 49.4 21.2 28.2 130.5 105.7 23.5 64.4 22.4 187.5
Total US 53.3 31.4 21.9 147.7 138.6 6.6 78.8 43.5 81.1
Total Group 48.2 26.7 21.5 131.2 108.7 20.7 63.2 29.0 117.9
* For comparability, Q2 2020 Average Room Rate and RevPAR have been translated at constant exchange rates (30 Jun 2021).
61Hotel Operations (1H 2021 vs 1H 2020)
Hotel Occupancy, Average Room Rate, and RevPAR by Region for CDL Group
Room Occupancy Average Room Rate RevPAR
1H 1H Incr / 1H 1H Incr / 1H 1H Incr /
2021 2020 (Decr) 2021 2020 * (Decr) 2021 2020 * (Decr)
% % % pts $ $ % $ $ %
Singapore 71.1 65.5 5.6 105.8 125.6 (15.8) 75.3 82.2 (8.4)
Rest of Asia 37.7 29.4 8.3 118.1 127.6 (7.4) 44.5 37.6 18.4
Total Asia 50.8 43.7 7.1 111.4 126.4 (11.9) 56.6 55.2 2.5
Australasia 52.1 45.9 6.2 149.0 176.2 (15.4) 77.7 80.8 (3.8)
London 19.9 24.6 (4.7) 152.7 232.4 (34.3) 30.3 57.1 (46.9)
Rest of Europe 24.1 27.9 (3.8) 121.1 140.2 (13.6) 29.1 39.1 (25.6)
Total Europe 22.1 26.3 (4.2) 134.5 180.1 (25.3) 29.7 47.4 (37.3)
New York 53.1 53.3 (0.2) 155.2 195.3 (20.5) 82.4 104.1 (20.8)
Regional US 43.2 34.9 8.3 120.7 140.9 (14.3) 52.2 49.1 6.3
Total US 46.5 41.9 4.6 134.0 166.0 (19.3) 62.3 69.5 (10.4)
Total Group 42.6 39.4 3.2 126.9 152.8 (17.0) 54.1 60.2 (10.1)
* For comparability, 1H 2020 Average Room Rate and RevPAR have been translated at constant exchange rates (30 Jun 2021).
62CDL Hospitality Trusts
Trading Performance
1H 2021 1H 2020 Change
$MM $MM %
Gross Revenue 66.2 52.1 27.2
Net Property Income
37.0 29.7 24.4
(NPI)
Although the impact of the pandemic continues to weigh on
W Hotel, Singapore
demand in the hospitality sector, widespread vaccination efforts
have helped to improve the business climate versus one year ago.
There were substantive contributions from SG, NZ and Maldives
(which together total more than 70% of gross revenue).
However, lack of NPI contribution from divested hotels (Novotel
Clarke Quay and Novotel Brisbane) exceeded inorganic NPI
contribution from W Hotel.
CDLHT continues to work with operators and lessees to ride on
the recovery, while maintaining tight costs and measures to
protect the bottom line.
Raffles Maldives Meradhoo, Maldives
63CDL Hospitality Trusts
Trading Performance
% Change
Country Remarks
in RevPAR
Occupancy supported by continued demand for dedicated isolation facilities.
Singapore1 (9.5) Postponement/cancellation of MICE events, continued border closure and the ongoing
moratorium on social functions continues to weigh on performance.
Both hotels benefited significantly from lifting of the blanket suspension on visas-on-
Maldives N.M. 2 arrival implemented in March 2020 in response to the pandemic.
New Managed isolation business from the government continued to support occupancy
31.8 through 1H 2021.
Zealand
Adverse impact from prohibition of non-essential travel till May 2021. Rental
Germany (61.2) agreement with lessee of Germany hotel was restructured.
Reopening of Hotel Cerretani Firenze on 26 May 2021 following easing of restrictions
Italy (84.4) including lifting the ban on inter-regional travel.
Tokyo remained largely under a state of emergency, with reduced operating hours for
Japan (27.9) some businesses and capacity limits. Visitor arrivals plunged by 97.6% for YTD June
2021.
National lockdown and intermittent closures in 1H 2021 impacted hotel contributions.
United
(21.8) Implementation of flexible furlough helped hotels ramp up manning during peak
Kingdom periods while tightly managing operating expenses.
16 SG Hotels (including W Hotel)
2N.M.: Not Meaningful
64Disclaimer: This document may contain forward-looking statements that involve assumptions, risks and uncertainties. Actual future performance, outcomes and results may differ materially from those expressed in forward-looking statements as a result of a number of risks, uncertainties and assumptions. Representative examples of these factors include (without limitation) general industry and economic conditions, interest rate trends, cost of capital and capital availability, availability of real estate properties, competition from other developments or companies, shifts in customer demands, customers and partners, expected levels of occupancy rate, property rental income, charge out collections, changes in operating expenses (including employee wages, benefits and training costs), governmental and public policy changes and the continued availability of financing in the amounts and the terms necessary to support future business. You are cautioned not to place undue reliance on these forward-looking statements, which are based on the current view of management on future events. Numbers in tables and charts may not add up due to rounding.
Artist’s Impression
IRWELL HILL RESIDENCES I SINGAPORE   www.cdl.com.sg
Appendix
Diversified Land Bank
Land Area (as at 30 June 2021) – CDL’s Attributable Share
  Type of Development                                                      Land Area (sq ft)
                                           Singapore                International         Total          %

 Residential                                      470,987                 2,188,671       2,659,657          87
 Commercial / Hotel                                 87,990                 296,552             384,542       13
 Total                                            558,977                 2,485,223       3,044,199          100

Total Land Area1 – 3.0MM sq ft

                                                                                 Commercial /
                        Others*           Singapore                                 Hotel
                         17%                 18%                                    13%
             Australia
               1%
                           Composition                                                Composition
                            By Region                                                 By Segment
                 US
                24%                                UK
                                                   40%
                                                                                        Residential
                                                                                           87%

         * Includes Japan, Korea and Malaysia                                                                      68
         1 Including M&C and its subsidiaries, excludes CDL New Zealand
You can also read