1H21 Results Enabling and empowering the world's supply chains - WiseTech Global
←
→
Page content transcription
If your browser does not render page correctly, please read the page content below

Enabling and empowering the world’s supply chains

 1H21
 Results

© 2021 WiseTech Global

Agenda

    1             1H21 Highlights

    2             1H21 Financial Review

    3             Strategy & Outlook

    4             Q&A

    5             Appendices

2   © 2021 WiseTech Global
1H21
Highlights
RICHARD WHITE, CEO & FOUNDER

1H21 overview
Strong 1H21 financial and strategic performance

       Total Revenue                                                                         EBITDA                                                                                  Underlying NPAT
       $238.7m ↑16%                                                                          $89.2m ↑43%                                                                             $43.6m ↑61%
       on 1H20                                                                               on 1H20                                                                                 on 1H20

       $150.0m CargoWise revenue (↑19%)                                                      EBITDA margin 37% (↑7pp)                                                                Statutory NPAT $44.4m1
       $88.7m Acquisition revenue (↑12%)                                                     CargoWise EBITDA margin 54% (↑5pp)                                                      Underlying EPS 13.4 cps (↑58%)

       Free cash flow                                                                        Strategic progress                                                                      Interim dividend
       $48.7m ↑74%                                                                           (3Ps)                                                                                   2.70 cps (↑59%)

       on 1H20                                                                               Product: 456 product enhancements & long-lead
                                                                                             product development progressing well
       $251.4m in cash                                                                       Penetration: 8 new global rollouts signed since                                         Fully franked
       as at 31 December 2020                                                                1 January 20202                                                                         Payout ratio 20% of Underlying NPAT
       $190.0m undrawn debt facility                                                         Profitability: revenue growth and cost reduction
       $200.0m accordion facility                                                            (7pp margin expansion)

4   © 2021 WiseTech Global   1. Statutory net profit after tax (NPAT) includes fair value adjustments from changes to acquisition contingent consideration (1H21: $0.8m, 1H20: $32.7m).
                             2. Previously disclosed are Aramex, Hellmann, deugro, CEVA Logistics, a. hartrodt, cargo-partner and Seafrigro Group. Hankyu Hanshin Express was signed since the last
                               disclosure at the WiseTech Digital Investor Day 2020.
COVID-19 market context
Evolving outcome of global pandemic on international trade

                             Our industry                                                                                  Our customers                                                         Our business

•   Volatility and marked slowdown in movement                                            •     Customer activity levels started to improve mid 2020                       •   Increased demand for CargoWise services
    of goods across all modes of transport in early                                                                                                                            among larger global customers
    stages of COVID-19
                                                                                          •     By the end of July 2020, CargoWise transaction
                                                                                                numbers were close to pre-COVID-19 levels                                  •   Revenue from the CargoWise platform grew 19%
•   Signs of recovery from mid 2020 with momentum                                                                                                                              in 1H21 vs. 1H20 from new and existing customers
    improving and continuing
                                                                                          •     Since August 2020, CargoWise transaction numbers
                                                                                                have trended upwards, with 1H21 CargoWise shipment                         •   Continued investment in product innovation to
•   COVID-19 mobility restrictions resulting in a ‘goods                                        transactions1 up 19% on 1H20                                                   leverage structural shift to consolidation,
    led’ recovery boosting demand for manufacturing                                                                                                                            integration and digitisation of global logistics and
    and global trade                                                                                                                                                           supply chains
                                                                                          •     Increasing demand for air and ocean freight, making
                                                                                                productivity critical for the industry
•   COVID-19 has accelerated longer-term structural                                                                                                                        •   Focused on executing global rollouts, targeting
    changes providing strong tailwind for digitisation                                                                                                                         top 25 global freight forwarders and top 200
    and integrated global technology logistics solutions                                  •     Global logistics companies increasingly looking to                             logistics providers
                                                                                                replace inefficient legacy systems with integrated
                                                                                                global technology such as CargoWise
•   Logistics providers seizing opportunities for industry
    consolidation

5   © 2021 WiseTech Global    1. A shipment is one of the most common transactions in CargoWise and is broadly reflective of activity levels in the global supply chain.
1H21 Financial
Review
ANDREW CARTLEDGE, CFO

1H21 results                                                                                                                                                            Total revenue
                                                                                                                                                                            Total revenue of $238.7m, up 16% on 1H20
Strong financial performance                                                                                                                                            •

                                                                                                                                                                        •   $3.6m FX headwind in 1H21 (1H20: $4.6m FX benefit vs. 1H19)
                                                                                                                                                                        •   Excluding FX headwind, total revenue grew 18% and CargoWise
    A$m                                                                          1H20                     1H21                 % change                                     revenue grew 20% on 1H20

    CargoWise revenue                                                            126.5                    150.0                     19%                                 Gross profit margin
    Acquisition revenue1                                                          79.3                     88.7                     12%                                 •   Increased to 85% (1H20: 82%)
    Total revenue                                                                205.9                    238.7                     16%                                 •   CargoWise gross profit margin of 94% (1H20: 92%)
    Cost of revenues                                                             (36.4)                   (35.3)                   (3)%
                                                                                                                                                                        EBITDA
    Gross profit                                                                 169.4                    203.4                    20%
                                                                                                                                                                        •   $89.2m up 43% on 1H20 reflecting continued revenue growth
    Gross profit margin                                                           82%                      85%                      3pp                                     and benefits from cost reduction initiatives
    Operating expenses                                                          (106.9)                   (114.1)                    7%                                 •   EBITDA margin at 37%, up 7pp on 1H20
    EBITDA                                                                        62.5                     89.2                    43%                                  •   CargoWise EBITDA margin of 54%, up 5pp on 1H20 reflecting
    EBITDA margin                                                                 30%                      37%                      7pp                                     revenue growth and lower sales & marketing expenditure

    Depreciation & amortisation2                                                 (20.5)                   (27.8)                    36%                                 •   1H21 EBITDA includes $5.1m of restructuring costs

    EBIT                                                                          42.0                     61.4                    46%
                                                                                                                                                                        Depreciation & amortisation
    Net finance costs                                                             (3.0)                    (1.3)                   (56)%
                                                                                                                                                                        •   36% increase reflects increased investment in R&D2
    Fair value gain on contingent consideration                                   32.7                      0.8                    (98)%
    Profit before income tax                                                      71.8                    60.8                     (15)%                                NPAT & earnings per share (eps)
    Tax expense                                                                   (11.9)                  (16.5)                    38%                                 •   Statutory NPAT of $44.4m, down 26% on 1H20 reflecting the
    Statutory NPAT                                                                59.9                     44.4                   (26)%                                     higher fair value gain in 1H20 compared to 1H21 in relation
                                                                                                                                                                            to acquisition contingent consideration
    EPS (CPS)                                                                     18.8                     13.7                    (27)%
                                                                                                                                                                        •   Underlying NPAT3 of $43.6m, up 61% on 1H20, demonstrating the
    Underlying NPAT3                                                              27.1                     43.6                     61%                                     resilience of the core CargoWise platform to deliver revenue
                                                                                                                                                                            growth and the benefit of cost reductions
    Underlying EPS (CPS)                                                           8.5                     13.4                     58%
                                                                                                                                                                        •   Underlying EPS 13.4 cps, up 58% on 1H20

7       © 2021 WiseTech Global   1. Acquisition revenue relates to revenue generated by businesses acquired since 2012 that are not included in CargoWise revenue.
                                 2. Further explanation of depreciation & amortisation and reconciliation of operating expenses on page 35 in appendices.
                                 3. Underlying NPAT excludes fair value adjustments from changes to acquisition contingent consideration (1H21: $0.8m, 1H20: $32.7m).
1H21 revenue growth
A$m
                                                                                            CargoWise revenue growth

                                                                                            •   $23.5m or 19% revenue growth in 1H21 on 1H20
                                                                                                •   $17.5m of revenue growth from existing customers (1H20:
                                                                                                    $17.0m)
                                                                                                •   $6.0m growth from new customers (1H20: $7.3m)
                                                                                                    and strong pipeline especially with larger global
                                                                                                    freight forwarders
                                         (1.2)
                                                                                            •   Growth from existing & new customers reflects:
                                                                                   88.7
                                                                                                •   Increased CargoWise usage (increased transaction
     79.3                                                                                           volumes, seats and new sites, utilisation of new modules,
                                                                                                    and growth from industry consolidation)
                                                                                                •   A $5.7m price change for both existing and new
                                                                                                    customers to offset increased product investment in
                                                                                                    R&D, data centre hardware and cyber security

                                                                                            •   Includes $1.4m FX headwind
                                                                                  150.0
    126.5
                                                                                            Acquisition revenue growth

                                                                                            •   $10.4m increase in revenue from 5 acquisitions in FY20

                                                                                            •   $(1.2m) net change in revenue from acquisitions in FY19
     1H20                             FY19 & Prior      FY20           FY21         1H21        and prior years due to small delays in non-recurring services
                        CargoWise                                                               revenue due to COVID-19
    Revenue                           Acquisitions   Acquisitions   Acquisition   Revenue

                               CargoWise revenue        Acquisition revenue                 •   Includes $2.3m FX headwind

8     © 2021 WiseTech Global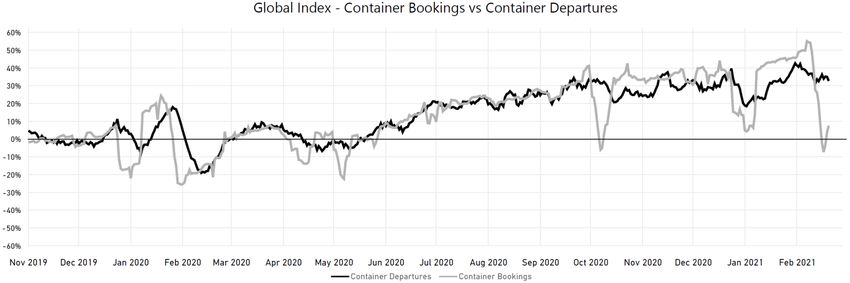
% of revenue

1H21 operating                                             expenses1                                                                                                                                                                        Expenses (A$m)

Cost reductions driving margin expansion

      Product Design & Development (A$m)                                                        Sales & Marketing (A$m)                                                                      General & Administration (A$m)

              20%                                                                                                    14%            14%                                                               20%
                                                                                                                                                  13%                                                                              20%
                                       19%           19%           19%                                                                                                                                           19%     19%                19%
                          18%                                                                            11%
                                                                                                                                                                10%

                                                    46.5          44.7                                                                                                                                                            44.4      45.1
                                      38.3                                                                                         28.8           28.1                                                           37.1    39.8
                         34.9                                                                                        25.9                                      24.3                                 31.2
             31.2
                                                                                                        18.1

             1H19        2H19         1H20         2H20            1H21                                1H19          2H19          1H20         2H20            1H21                                1H19         2H19    1H20     2H20      1H21

Product design &                                                   Sales & marketing                                                        General & administration                                               Overall operating
development expense                                                expense                                                                  (G&A) expense                                                          expenses

Flat as a % of revenue on 1H20, reflecting                         Down 4pp as a % of revenue on 1H20. The                                  Flat as a % of revenue primarily driven by                             Down 4pp as a % of revenue, reflecting
the significant investment in FY20 prior                           decrease reflects a reduction in travel and                              $5.1m in restructuring costs. G&A excluding                            revenue growth and the benefit of cost
to COVID-19 (in line with previously                               tradeshow costs in 1H21 due to COVID-19 and                              restructuring costs was 17% of total revenue.                          reductions across the business.
communicated strategy on innovation                                a reduction in sales & marketing headcount.
and development investment) which is
now in WiseTech’s cost structure.

9    © 2021 WiseTech Global   1. Operating expenses exclude depreciation & amortisation. Further explanation of depreciation & amortisation and reconciliation of operating expenses on page 35 in appendices.
1H21 research and development
Innovation and product development continues to be a priority

             Investment in innovation and
             product development (A$m)
                                                                             Product investment
                                            38%
                                     36%             35%                     •   13% increase in innovation and product development in 1H21 vs. 1H20 focused
R&D %           33%                                                              on product enhancements and further developing the CargoWise platform
of revenue                    32%
                                                                             •   35% of revenue reinvested in R&D in 1H21
                                            85.8
                                                   83.0
                                                                             •   Capitalised development increased 9% to $38.3 million in 1H21 vs. 1H20
                                     73.3                                        reflecting an increase in native customs and compliance development

                                            39.2                                 Maintenance, bug fixes and research costs are expensed
                              61.8                 38.3    46% Capitalised
                                                                             •

                                     35.0                                    •   46% of R&D investment capitalised in 1H21, down 2pp versus 1H20
                51.2
                              26.8                                           •   Proportion of R&D investment capitalised broadly in the range of 40%-50%
                20.1
                                                                             •   $500m in product investment in the last 5 years (2H16 to 1H21)

                                            46.5   44.7    54% Expensed
                              34.9   38.3
                31.2

                1H19          2H19   1H20   2H20   1H21

10   © 2021 WiseTech Global
1H21 balance sheet
Strong balance sheet and liquidity
A$m 30 Jun 20 31 Dec 20
Strong liquidity
Cash 223.7 251.4 • $251.4m in cash
Receivables 59.6 63.2
• $190.0m undrawn debt facility with additional $200.0m accordion facility
Derivative financial instruments 4.6 12.1
Other current assets 22.3 17.9 Derivatives
Intangible assets 885.0 887.0 • $7.5m increase reflecting additional foreign exchange derivatives on EUR
Other non-current assets 81.7 85.9 and USD revenue through to 1H23
Total assets 1,276.9 1,317.6 Intangible assets
Current liabilities 157.2 169.6
• $2.0m increase reflecting investment in one new acquisition in 1H21,
Borrowings - - new capitalised development, amortisation and foreign exchange
Non-current liabilities 116.4 100.3
Share capital
Total liabilities 273.5 269.9
Net assets 1,003.4 1,047.6 • $10.5m new share capital issued mainly for acquisition consideration
Share capital 779.8 790.3
Retained earnings & reserves 223.6 257.3
Total equity 1,003.4 1,047.6
11 © 2021 WiseTech Global1H21 operating cash performance
Strong operating cash flow, investing in long-term growth
A$m 1H20 1H21 % change Strong operating cash flow
• Operating cash flows were $92.1m (1H20: $69.7m), up 32% on 1H20,
EBITDA 62.5 89.2 43%
demonstrating strength of underlying operating model, highly cash generative
Non-cash items in EBITDA 6.8 8.4 24% • Increase in operating cash flow reinvested into long-term growth,
$48.9m invested in product development, acquisitions and global expansion
Working capital changes 0.4 (5.5) (1,475)%
• 103% conversion rate, down 8pp on 1H20
Operating cash flow 69.7 92.1 32% • Non-cash items in EBITDA increased due to greater use of employee equity
which improves long-term retention and shareholder alignment
Capitalised development costs (33.0) (36.5) 11%
• Changes in working capital mainly reflect timing on deferred revenue and
increases in receivables from revenue growth, partially offset by increases
Other Capital Expenditure (8.7) (6.9) (21)% in trade payables
Free cash flow 28.0 48.7 74% • 1H21 includes $5.1m of payments relating to restructuring costs
Free cash flow
Operating cash flow conversion 111% 103% (8)pp
• 1H21 free cash flow up 74% driven by lower growth in capitalised development
Free cash flow conversion 45% 55% 10pp
costs and reduction in other capital expenditure as spend on office
facilities slowed
• 55% free cash flow conversion rate, up 10pp on 1H20
12 © 2021 WiseTech GlobalStrategy & Outlook RICHARD WHITE, CEO & FOUNDER
Long-term strategy: CargoWise global expansion
We are doing what we said we would; COVID-19 further accelerates the opportunity we have built

Our vision is to create the operating system for global logistics

Foundation established                            Resources + global foothold   Penetration + efficiency
FY15–17                                           FY18–20                       FY21–23

Our people facilitate the acceleration of our long-term strategy

                                Product                  Penetration            Profitability
                              Extend technology           Expand market         Drive operational
                                     lead                  penetration              efficiency

14   © 2021 WiseTech Global
Product
Building the operating system for global logistics
CargoWise product development strategy
456 product features and enhancements in 1H21 … 4,000+ since FY16
Global customs Global rates Ecommerce Logistics Enterprise
Global native customs and Build out global rates International Landside logistics Extending enterprise-wide
cross-border compliance engines and ecosystem Ecommerce and land transport functionality + other modules
Product development priorities accelerated by strategic investments
• Foothold acquisitions: customs • Cargoguide • Pierbridge • CMS • CCN
& domestic compliance • CargoSphere • SmartFreight • Containerchain • Microlistics
• BorderWise compliance libraries • X-ware • Foothold acquisitions: customs • Depot Systems • Softship
• Cypress machine learning & domestic compliance • SaaS Transportation • X-ware
• TransLogix • Foothold acquisitions: domestic
• Trinium compliance
15 © 2021 WiseTech GlobalProduct: CargoWise global native customs & cross border compliance
Product development priority 1
Acquisitions accelerate multi-year development process to build the global customs platform
Development pipeline1
Industry pain points Our solution
Live CargoWise Planned FY21 Planned for FY22 Planned for FY23+
• Customs agents and • One globally unified system: to create,
forwarders take on manage and clear import and export customs Australia France Germany2 Argentina
compliance risks which declarations for countries covering ~90% New Zealand Spain Ireland2 Chile
are hard to control given of manufactured trade flows which will: USA Italy Turkey Costa Rica
complexity and
Mitigate regulatory risk Canada Poland Dominican
pressure on cross •
UK Brazil Republic
border trade • Simplify declaration process
South Africa Korea Panama
• Failures expose • Streamline or automate data entry Singapore Belgium Paraguay
providers to hefty fines,
Correctly classify goods and meet China Denmark Puerto Rico
penalties, sanctions and •
reputation risk regulatory requirements Taiwan Netherlands Switzerland
+ 8 smaller Norway Japan
Industry uses many • Other key areas of our cross-border
• countries Sweden
small, local, country compliance solution (ASYCUDA)3
specific solutions which • Invoicing and local accounting compliance
are not effective at
controlling risk • Localisation of the documentation for ~90%
international and local logistics trade 35-40% ~45% ~70%
compliance
• Port integration with government and major
port authorities Targeting to reach ~90% of manufactured trade flows
• Air cargo security and other freight
security items
• Language localisation
16 © 2021 WiseTech Global 1. Planned timings reflect expected completion of WiseTech development work. Go-live is subject to customer testing and in some cases accreditation which, as with changes to government regulations,
remains outside of WiseTech control.
2. Germany build delayed to FY22 due to changes in the government’s own timetable. Ireland reprioritised to focus on urgent UK/Northern Ireland/Brexit related compliance work.
3. ASYCUDA is provided by UNCTAD and used by ~100 smaller countries for which we can enable country connections upon customer request.Product: CargoWise global rates engines and ecosystem
Product development priority 2
Our global rates solution is designed to streamline the booking-to-payment process and improve
customer profitability with an advanced multi-modal rates engine and live rate connectivity
Industry pain points Our current solution Development pipeline
• Searching for rates, tariffs and • Real-time, automated rates • Acquired CargoSphere and
charges is manual and with direct electronic feed Cargoguide product teams
therefore time consuming, error from 9 carriers of which 4 redeployed to native
prone and costly recently contracted CargoWise development
• Costs must be collected and • Autocosting and autorating • Spot rates and instant
compared from hundreds of instantly search and apply bookings with ocean and
service providers and carriers, buy/sell rates to shipments air carriers
each with thousands of without user data entry • Block Space Agreements and
contracted rates, surcharges, • Customisable pricing strategy allocation management with
incentives and discounts which rules to calculate profit ocean and air carriers
frequently change and are margins and build accurate
provided in non-standardised • Guided carrier selection
quotes
formats process and profitability
• Full integration with all logistics forecast
• Significant amount of data and
modules of CargoWise ensures
complex calculations required
accurate and timely cost
to pay suppliers and invoice
settlement and customer
customers quickly and
invoicing
accurately
• CargoSphere and Cargoguide
• Incorrect choice or calculation
integrated and in pilot with
of rates can reduce or eliminate
CargoWise global customers
customer’s profit
17 © 2021 WiseTech GlobalProduct: CargoWise International Ecommerce
Product development priority 3
Our solution is a single platform for the entire international ecommerce Retail ecommerce sales worldwide,
2019-20241 US$ trillions
fulfilment supply chain
$6.4
$5.9
$5.4
Industry pain points Our current solution Development pipeline $4.3
$4.9
$3.4
• The rise of ecommerce has • Launched in 1H20 • Further development in the
Retail ecommerce expected sales growth ~50% (2020-2024)
significantly increased the areas of shipping, customs,
• Expanded ecommerce
demand for logistics services final mile delivery, full track-
capability in US for ocean
and-trace, international 2019 2020 2021 2022 2023 2024
• Unprecedented volumes of and road consignments in 1H21
freight forwarding and parcel
ecommerce shipments • Compliant with customs
amplify customer challenges declaration rules • US ecommerce security
faced including: in AU, NZ and US filings for air consignments Ecommerce shipments are managing
• Customs compliance unprecedented volumes
• Automate orders,
specifically for high Traditional shipment
consignments and shipper
volume, low value goods
manifests
movement where normal 1 order
customs declaration • Bulk screening and customs
methods make it difficult submission with GUI that
to manage manages by exception – In 1 consignment
efficiently handling large
• Tracking deliveries
volumes Ecommerce shipment
• Pierbridge and SmartFreight
products integrated, currently 1,000 – 50,000
online orders
identifying suitable customer
pilots
18 © 2021 WiseTech Global 1. Source: Inside Intelligence eMarketer: Global Ecommerce Update 2021, Published Jan 2021.Product: CargoWise Neo
Beta version of CargoWise Neo launched
• Beta version deployed to a select group of Beneficial Cargo Owners (BCOs) via existing WiseTech logistic provider customers
• Working with one of our largest customers to trial Neo and develop extensions with a large retailer who is also an existing CargoWise customer
• These early adopters will test the platform and their feedback will help enhance and develop the product
• Focused on penetration ahead of monetisation. Seeding of the market will take 12+ months, with a long lead time before Neo is significantly revenue generating
Neo is the global integrated platform enabling Neo opens up a new customer segment
BCOs to book, track, trace and manage their and could expand WiseTech’s total
freight. Neo acts as the control tower between addressable market.
BCOs and their logistics providers and carriers.
Neo potentially expands WiseTech’s total
Neo provides a unique level of data connectivity and addressable market from the supply chain
information visibility that helps BCOs to manage their execution segment (US$4.7bn) to the broader
operations more efficiently and reliably. supply chain management IT segment valued
at US$15.2bn1.
• Dashboard visibility of jobs ‘at-a-glance’
• Integrated tracking
• Streamlined bookings and quotes
19 © 2021 WiseTech Global 1. Source: Gartner Supply Chain Software Management, Worldwide, 2019.Penetration
Global rollouts continue to increase across global freight forwarders and 3PLs enhancing value over time
CargoWise has 341 large global freight forwarders2 with global rollouts in process or completed,
11 of these are in the Top 253
Of these 34 large global freight forwarders: Global rollouts – CargoWise large global freight forwarders
Contracted - in process of global rollout
• 26 are in production4 on CargoWise in 10
or more countries and with 400 or more In production - globally rolled out through signing or organically
registered users on CargoWise comprising:
• 15 customers signed on a global HANKYU
HANSHIN
rollout contract
• 11 customers organically rolled
DEUGRO
out over time WTC
IPO
• 8 are contracted and in the process of a GEBRUDER DHL SEAFRIGO
WEISS
global rollout and are expected to achieve
10 or more countries and 400 or more CROWLEY CARGO-
YUSEN SENATOR DE WELL
registered users during roll-out LOGISTICS PARTNER
XPO GREEN LOGISTICS
Since 1 January 2020, we have signed eight OIA SEKO MAINFREIGHT
LOGISTICS CARRIER PLUS
EFL BOLLORÉ HELLMANN CEVA
new global rollout contracts (previously
disclosed Aramex, Hellmann, deugro, CEVA WACO/ Launch of NOATUM CLASQUIN GEFCO
ASIA
ARAMEX5 A.
TRANSTAR DSV TOLL ROHLIG GEODIS JAS LOGWIN SHIPPING
Logistics, a. hartrodt, cargo-partner and TIGERS CargoWise HARTRODT
Seafrigro Group and one signed since the FY06 FY07 FY08 FY09 FY10 FY11 FY12 FY13 FY14 FY15 FY16 FY17 FY18 FY19 FY20 FY216
WiseTech Digital Investor Day 2020, Hankyu
Hanshin Express). Customers have been categorised in the financial year that reflects the later of their CargoWise revenue cohort or global contract signing date (if applicable).
1. At the WiseTech Global Digital Investor Day (3 December 2020), we reported 23 large global freight forwarders. Subsequently, a total of 10 customers that met the criteria of a large global freight forwarder
have been added to this metric. In addition, 1 new global rollout contract has been recently signed with Hankyu Hanshin Express.
2. A large global freight forwarder is defined here as a CargoWise customer contracted to grow or who has grown organically to 10 or more countries and 400 or more registered users on CargoWise.
3. Top 25 Global Freight Forwarder based on Armstrong & Associates, Inc. Top 25 Global Freight Forwarders List ranked on 2019 Logistics Gross Revenue/Turnover and Freight Forwarding Volumes
(revenues are company reported or Armstrong & Associates estimates).
20 © 2021 WiseTech Global 4. In production means that a customer is operationally live on CargoWise and using the platform on a production database.
5. Aramex went operationally live with a “big bang” rollout in FY21 and is currently in production on CargoWise.
6. Includes customer signings up to and including 23 February 2021.Profitability
On track to deliver $10 million in net cost reductions in FY21 and achieve $20-$30 million run-rate for FY22
→ Organisation-wide efficiency program and acquisition synergy extraction
• Efficiency initiatives implemented to date include gross reduction of 2691 employees and contractors relating
predominantly to sales, marketing, technical and product support staff in acquired teams
• Additional cost reduction initiatives in business support functions globally, including legacy acquired product
support and sales & marketing
• Data centre consolidation and data migration of acquired businesses in progress
• Centralising physical operations and product development hubs, lease terminations identified and actioned
• Aligning product portfolio with CargoWise product suite
• Facility & office support efficiency programs actioned
$6.1m cost reductions realised in 1H21 On track to deliver $10m in net cost reductions
(net benefit of $1.0m after $5.1m (after restructuring costs) in FY21 and cost reduction
restructuring costs) run-rate of $20-$30m for FY22
21 © 2021 WiseTech Global 1. 269 reflects the gross reduction of both employees and contractors across the Company. Net employee headcount in 1H21 decreased by 104 to 1,935 employees (1H20: 2,039 employees).People
Investing in our product & development talent
WiseTech’s unique team of technology and industry experts has been built over many years through recruitment
and strategic acquisitions
WiseTech employees
Other functions (G&A, S&M, COR)
Acquired Cost reductions
Product & development 234 (233)
Hired 111 (160)
302 123 (73) 1,935
102
1,632 200
• Increased product & development talent by 32% over the last
47%
911 2 years (31 Dec 2018 to 31 Dec 2020), reflecting significant
investment pre-COVID-19
53%
858
• Following a short slowdown in recruitment in 2H20, WiseTech
recommenced its recruitment investment in product &
development talent
53%
1,024
• We have continued to realign acquired product & development
47% teams into our CargoWise team
774
31 Dec 18 31 Dec 20
22 © 2021 WiseTech GlobalStrategic achievements to date
Our strategic investment is driving long-term strategic growth and delivering shareholder value
People – focused on building technology and industry expertise
• 1,024 technology and industry experts at 1H21 (up from 225 at FY16)
• 53% of WiseTech workforce focused on R&D
Product Penetration Profitability
• 4,000+ product enhancements since FY16 • Increase in CargoWise large global freight • 207% growth in CargoWise Revenue
• Acquisitions added technical capabilities and forwarders1 from 20 at FY16 to 33 at 1H21 (FY16: $85.8m; FY20: $263.0m)
accelerated product development • 54% growth in CargoWise Registered Users • Expanding CargoWise EBITDA margins
• Significant product developments in from 1H17 to 1H212 from 30% in FY16 to 54% in 1H21
CargoWise, expanding our global solution into: • Increase in number of countries where • Cost efficiency initiatives, including
• Global customs & compliance CargoWise is available from 136 (FY16) to $6.1m cost reductions realised in 1H21
167 (1H21) (net benefit of $1.0m after
• Global rates engines
• Low customer attrition,Management’s FY21 priorities
Product Penetration Profitability
Extend technology Expand market Drive operational
lead penetration efficiency
• Investment and focus on expanding • Sales team targeting Top 25 Global • Continued implementation of
CargoWise product suite: Freight Forwarders and Top 200 organisation-wide efficiency program
Global Logistics Providers
• Native customs geographic expansion • Automate high volume, manual
• Expand and enhance Delta sales customer-facing and internal
• Global rates engine team with further talent and functions via a self-service portal
additional support
• International Ecommerce • Establish regional centre in Hamburg
• Marketing and digital activities (post Brexit EU headquarters)
• Beta testing and development of Neo focused on CargoWise
• Building a global network operations
• Accelerate data agreements and full • Expand existing global rollouts and development centre in Bangalore
integration with major carriers for and customer usage
sea, air, rail and road • Align all geographic product teams
with key development resources and
• Integrate datasets and drive scale in global headquarters (Sydney)
automation within CargoWise stack
People – focused on building technology and industry expertise
24 © 2021 WiseTech GlobalFY21 revised guidance
EBITDA guidance increased by $10m from $155m-$180m to $165m-$190m; Revenue guidance reaffirmed
FY21 revenue FY21 guidance update
1. CargoWise: recurring revenue market share growth of 15%-30%
$470m - $510m • In line with expectations
2. CargoWise: recurring revenue industrial production growth
9% - 19%
FY21 growth vs FY20 • 1H21 preliminary industrial production growth ~6% HoH1
• 2H21 forecast ~3% HoH1, previously expecting ~1% HoH
• Industrial production growth tracking slightly ahead of expectations, Guidance provided in line with
FY21 EBITDA
these assumptions and those in
3. FX headwind $20m revenue; $9m EBITDA
the Appendix, slide 29.
• Additional FX headwind, partially offset by hedging
$165m - $190m • See Appendix for sensitivity analysis
• $25m revenue; $12m EBITDA headwind included in revised guidance
30% - 50% Uncertainty around future economic
FY21 growth vs FY20 4. Acquisitions and industrial production growth
• Included EXA, Japan (November 2020), immaterial revenue and EBITDA benefit based on pandemic, stimulus
measures and China may lead
FY21 EBITDA % • No further new acquisitions not already closed
• Remaining acquisitions broadly in line with expectations to alternative outcomes. Prevailing
uncertainties relating to sovereign
35% - 37% 5. Cost reduction and geopolitical risk may also
• On track to deliver $10m net cost out in FY21 & $20-$30m run rate for FY22 reduce assumed growth rate.
5pp – 7pp • EBITDA guidance revised to include additional 1H21 cost favourability from
FY21 vs FY20 hiring, pay reviews and lower run rate costs e.g. travel
• $10m increase in EBITDA guidance from $155m-$180m to $165m-$190m
25 © 2021 WiseTech Global 1. Credit Suisse Global Cycle NotesConclusion
Solid CargoWise Strong EBITDA Acquisition
revenue growth and Underlying synergies
NPAT growth a key focus
Testament to increasing Reflects revenue growth and Good progress on CargoWise
market share disciplined cost management product development and
delivering efficiencies
Strategy delivering Strong balance Robust cash flow
growth sheet generation
Increasing market penetration Significant liquidity providing Testament to high
financial flexibility and headroom quality earnings
26 © 2021 WiseTech GlobalQ&A
Appendices
Slides
29.      FY21 guidance assumptions and FX
30.      CargoWise container bookings and container departures
31.      Overview of revenue licensing models
32.      Drivers of CargoWise revenue growth
33.      Income statement
34.      Key operating metrics
35.      Reconciliation of statutory expenses to non-statutory expenses
36.      Explanatory notes                                                Image TBC
37.      Important notice and disclaimer
FY21 guidance assumptions and FX
What is included in the FY21 guidance:                         FX rates            FY20          1H21       2H21 forward            Foreign Exchange
                                                               v AUD              actual        actual       guidance
•    Retention of existing customers with CargoWise
     usage growth consistent with historical levels
                                                                                                                           1H21
                                                               USD                 0.67          0.70           0.79
•    New customer growth consistent with historical levels                                                                 •   75% of 1H21 revenue in non-AUD
•    New product and feature launches monetised                EUR                 0.61          0.60           0.65           currencies, no change from 1H20
•    Contractual increases in revenue from existing
     customers, including those reflecting the end
                                                               GBP                 0.53          0.55           0.57       •   Natural hedges in some regions with
     of temporary pricing arrangements                                                                                         both revenue and expenses
                                                               ZAR                 10.37         11.84          11.65          denominated in local currencies –
•    Price increases                                                                                                           including recent acquisitions
                                                               TRY                 4.05          5.25           5.76
•    Full year effect of prior year acquisitions and minimal
     growth for acquisitions as a group overall                                                                            •   44% of 1H21 revenue in non-local
                                                               RMB                 4.71          4.88           5.01
                                                                                                                               currency due to impact from overseas
•    Prudent allowance for COVID-19 impact
                                                               NZD                 1.05          1.07           1.08           acquisitions and mix of transactions
                                                                                                                               and users in CargoWise
What is not included in the guidance:
                                                                                                                           2H21
•    Revenue from new products in development                                    Increase/       2H21           2H21
                                                               Sensitivities
     but not planned to be commercialised                                        decrease    revenue A$m    EBITDA A$m     •   ~60% of forecast 2H21 revenue is in
•    Benefits from migration of customers from acquired                                                                        AUD or covered by (USD/EUR) hedges
                                                               FX rates vs AUD
     platforms, where CargoWise development is yet to
                                                                                                                           •   ~25% of 2H21 revenue is in local
     be completed                                              USD                +/- 5%      -0.9 / +1.0    -0.3 / +0.3       functional currency with offsetting
•    Changes in services revenue outside of e-services                                                                         costs creating natural hedges
                                                               EUR                +/- 5%      -0.8 / +1.0     - / +0.1
•    Changes in the mix of invoicing currencies
                                                                                                                           •   ~15% of 2H21 revenue is in other
•    Future potential acquisitions, revenues and               GBP                +/- 5%      -0.2 / +0.2    -0.1 / +0.1
                                                                                                                               currencies with partial cost offsets
     associated costs
                                                               ZAR                +/- 10%     -0.4 / +0.5    -0.3 / +0.3
•    Major disruption from pandemic, trade or                                                                              •   Additional hedge coverage up to 1H23
     stimulus-related slowdowns                                TRY                +/- 10%      - / +0.1         -/-            for USD and EUR revenue exposure

29    © 2021 WiseTech Global
CargoWise container bookings and container departures
Container bookings executed through CargoWise can act as a leading indicator to departure volumes
representing our customers’ intent to move goods
Container
% Difference in 7-day Moving Average from the Index Baseline
•
bookings and
container departures
– CargoWise
internal data
• Chart data not
directly correlated to
revenue movements
Chinese Chinese
New Year 2020 New Year 2021
Source: CargoWise industry data - Global: Container Bookings and Container Departures 7-day moving average (Nov 2019- Feb 2021)
Index baseline is calculated using the average container departure volume for the 60 day period up to 1-Dec-19 (from 2-Oct-19 to 30-Nov-19 inclusive)
This chart is provided to give insight into the logistics industry and the container departures and bookings data does not represent, indicate or correlate with any revenues. Container bookings depicted in
this chart reflect bookings made through CargoWise between the period 1 Nov 2019 - 20 Feb 2021 and do not guarantee or confirm any future container bookings. Container departures depicted in this
chart reflect the physical movement of containers via ocean. WiseTech makes no express or implied warranties, representations, projections or guarantees in relation to the data in this chart.
30 © 2021 WiseTech GlobalOverview of revenue licensing models
Other revenue
Group revenue by licence type (A$m) Recurring revenue (91% of revenue)1
(9% of revenue)1
OTL
238.7 On-Demand Licensing OTL & support services
Revenue maintenance
223.5 75%1 9%1
20.3 16%1
205.9 27.5
191.6 19.9 39.0 Seat + Transaction OTL Support
Licence Module User OTL
23.0 Licensing (STL) maintenance services
38.7 License
156.7 34.1
OTL & support 32.8 Price drivers Transition Price drivers Price drivers: Price drivers: Ad hoc revenue
services
17.7 • Seat licence pricing & • Price per user • Annual • One-time (professional
25.0 fee commitment • Price per maintenance price per services,
OTL maintenance • Transaction agreements module used price per perpetual training &
fee licence licence paid feature
Volume drivers requests)
179.4 • Number of Volume drivers: Volume drivers:
151.8 157.4 Volume
users • Number of • Number of
135.8 drivers
• Monthly licences licences
On-Demand 114.1 • Monthly
Revenue number of modules used
drivers seats &
users (only 1% of
• Monthly CargoWise
transactions revenue is MUL)
1H19 2H19 1H20 2H20 1H21
Recurring revenue 139.1 168.6 185.9 196.1 218.4
(A$m)
% of total revenue 89% 88% 90% 88% 91%
CargoWise ✓ ✓ ✓ ✘ ✘ ✓
31 © 2021 WiseTech Global 1. Represents percentage of 1H21 total revenue.Drivers of CargoWise revenue growth
Acquired revenue transition
Drivers of CargoWise revenue to CargoWise revenue
1. Existing customers For geographic expansion assets:
1 Transitionary pricing agreements • Add transactions, including by responding to global • the revenue will only become CargoWise when the
trade patterns customs technology is embedded in CargoWise and
• Add more users, including by opening up in new sites usage of the module/platform is native to CargoWise
2 Commitment agreements and increasing headcount • the revenue related to the customers acquired, that
• Expand to more geographies remain on the acquired platform, is recorded as acquired
• Start to use more modules and features revenue until that customer transitions to CargoWise
3 Seat licence fee •
•
Extend to global rollouts
Add automations to increase transaction throughput For adjacent technology assets:
• Consolidate their acquisitions onto the platform Adjacent technology assets will move to the CargoWise
2. New customer wins revenue category when:
4 Transaction fee
• Global rollouts • their technology interface to CargoWise is complete
• General customers deals (single-site or multi-region) and seamless (SSO)
• Conversion of legacy acquired customers • they have completed the commercial foundation
3. Revenue growth from customers that have transitioned (e.g. content and eLearning architecture, contract
from (static) temporary pricing arrangements and licensing transition, sales and support model)
4. Customer take up of behavioural discounts Acquisitions with minimal or no revenues or customers can
5. Measured price changes related to new product be absorbed quickly into the CargoWise core, predominantly
additions or CPI adjustment impacting operating expense
6. Usage of new product/features on the platform
by existing customers (commercialised then monetised
through transaction charges or in seat licence)
7. (Revenue from) Acquired businesses becoming fully
embedded into CargoWise
32 © 2021 WiseTech GlobalIncome statement
A$m 1H20 1H21
Revenue
Recurring On-Demand licence 151.8 179.4
Recurring OTL maintenance 34.1 39.0
OTL and support services 19.9 20.3
Total revenue 205.9 238.7
Cost of revenues (36.4) (35.3)
Gross profit 169.4 203.4
Operating expenses
Product design and development (38.3) (44.7)
Sales and marketing (28.8) (24.3)
General and administration (39.8) (45.1)
Total operating expenses (106.9) (114.1)
EBITDA 62.5 89.2
Depreciation (7.8) (10.1)
Amortisation (7.5) (12.7)
EBITA 47.2 66.4
Acquired amortisation (5.2) (5.0)
EBIT 42.0 61.4
Net finance costs (3.0) (1.3)
Fair value gain on contingent consideration 32.7 0.8
Profit before income tax 71.8 60.8
Tax expense (11.9) (16.5)
NPAT 59.9 44.4
Underlying NPAT1 27.1 43.6
NPATA2 33.5 47.8
33 © 2021 WiseTech Global 1. Underlying NPAT excludes fair value adjustments from changes to acquisition contingent consideration (1H21: $0.8m, 1H20: $32.7m).
2. NPATA – net profit after tax attributable to equity holders of the parent before: acquired amortisation net of tax, contingent consideration interest unwind net of tax, and fair value changes
on contingent consideration. NPATA is a non-statutory measure used for the purpose of assessing the Group’s performance.Key operating metrics
WiseTech Global including and excluding acquisitions
1H21
1H20 1H21
CargoWise1
Total revenue growth vs. prior year 31% 16% 19%
Recurring revenue – % of total revenue 90% 91% 99%
On-Demand licence revenue – % of total revenue 74% 75% 99%
Gross profit margin 82% 85% 94%
Product design and development - % of total revenue 19% 19% 12%
Total R&D - % of total revenue 36% 35% 31%
Sales and marketing - % of total revenue 14% 10% 9%
General and administration - % of total revenue 19% 19% 18%
EBITDA margin 30% 37% 54%
EBIT margin 20% 26%
Underlying NPAT2 - % of total revenue 13% 18%
NPATA - % of total revenue 16% 20%
Capitalised development investment A$m 35.0 38.3
Total R&D A$m 73.3 83.0
Effective tax rate 17% 27%
Underlying effective tax rate 31% 27%
34 © 2021 WiseTech Global 1. CargoWise ratios excluded acquisitions since 2012 not embedded into CargoWise and include M&A costs.
2. Underlying NPAT excludes fair value adjustments from changes to acquisition contingent consideration (1H21: $0.8m, 1H20: $32.7m).Reconciliation of statutory expenses to non-statutory expenses
A$m 1H20 2H20 FY20 1H21
Cost of Revenues
Cost of revenue – statutory 39.3 44.2 83.5 38.9
Less: Depreciation & amortisation 2.9 3.9 6.8 3.6
Cost of revenues – non-statutory 36.4 40.3 76.7 35.3
Statutory to non-statutory reconciliation
Product design & development
Product design & development – statutory 51.3 64.0 115.4 64.1
Less: Depreciation & amortization 14.2 18.9 33.1 20.6
Less: Right-of-use asset depreciation capitalised (1.2) (1.4) (2.6) (1.2)
Product design & development – non-statutory 38.3 46.5 84.9 44.7
Sales & marketing
Sales & marketing – statutory 31.7 30.7 62.3 27.0
Less: Depreciation & amortisation 2.8 2.5 5.4 2.7
Sales & marketing – non-statutory 28.8 28.1 57.0 24.3
General & administration
General & administration – statutory 41.5 46.2 87.7 47.2
Less: Depreciation & amortisation 1.7 1.8 3.5 2.1
General & administration – non-statutory 39.8 44.4 84.1 45.1
35 © 2021 WiseTech GlobalExplanatory notes
NPAT A$m 1H20 1H21
NPAT 59.9 44.4
Fair value gain on contingent consideration (32.7) (0.8)
1
Underlying NPAT 27.1 43.6
NPAT 59.9 44.4
Fair value gain on contingent consideration (32.7) (0.8)
Acquired amortisation (net of tax) 3.8 3.7
Contingent consideration interest unwind (net of tax) 2.6 0.4
NPATA2 33.5 47.8
Effective A$m 1H20 1H21
tax rate Profit before income tax 71.8 60.8
Fair value gain on contingent consideration (32.7) (0.8)
Underlying1 profit before income tax 39.1 60.1
Tax expense (11.9) (16.5)
Underlying effective tax rate 30.5% 27.4%
36 © 2021 WiseTech Global 1. Underlying PBT and NPAT excludes fair value adjustments from changes to acquisition contingent consideration (1H21: $0.8m, 1H20: $32.7m).
2. NPATA – net profit after tax attributable to equity holders of the parent before: acquired amortisation net of tax, contingent consideration interest unwind net of tax, and fair value changes on
contingent consideration. NPATA is a non-statutory measure used for the purpose of assessing the Group’s performance.Important notice and disclaimer
Content of presentation for information purposes only
Visit wisetechglobal.com/investors Preparation of information
All financial information has been prepared and reviewed in accordance with Australian Accounting Standards.
Certain financial data included in this presentation is ‘non-IFRS financial information’. The Company believes
Forward-looking statements that this non-IFRS financial information provides useful insight in measuring the financial performance and
This presentation may contain statements that are, or may be deemed to be, forward-looking statements. condition of WiseTech Global. Readers are cautioned not to place undue reliance on any non-IFRS financial
Such statements can generally be identified by the use of words such as 'may', 'will', 'expect', 'intend', 'plan', information including ratios included in this presentation.
'estimate', 'anticipate', 'believe', 'continue', 'objectives', 'outlook', 'guidance‘, ‘forecast’ and similar expressions.
Indications of plans, strategies, management objectives, sales and financial performance are also forward- Presentation of information
looking statements. • The financial data in this presentation is provided on a statutory basis but in a non-statutory
Such statements are not guarantees of future performance, and involve known and unknown risks, presentation format (unless otherwise stated)
uncertainties, assumptions, contingencies and other factors, many of which are outside the control of • Pro forma (PF) Where indicated, financial measures for periods prior to FY17 are provided on a pro forma
WiseTech Global. No representation is made or will be made that any forward-looking statements will be basis. Information on the specific pro forma adjustments is disclosed on page 116 of WiseTech Global’s
achieved or will prove to be correct. Readers are cautioned not to place undue reliance on forward-looking 2019 Annual Report
statements and WiseTech Global assumes no obligation to update such statements. • Currency All amounts in this presentation are in Australian dollars unless otherwise stated
• FY refers to the full year to 30 June, 1H refers to the six months to 31 December, and 2H refers to the six
No representation or warranty, expressed or implied, is made as to the accuracy, reliability, adequacy or months to 30 June
completeness of the information contained in this presentation. • Rounding Amounts in this presentation have been rounded to the nearest $0.1m. Any differences
between this presentation and the accompanying financial statements are due to rounding. Amounts
Past performance shown as "-" represent zero amounts and amounts less than $50,000 which have been rounded down
Past performance information in this presentation is given for illustrative purposes only and should not be
relied upon as (and is not) an indication of future performance. Third party information and market data
The views expressed in this presentation contain information that has been derived from publicly available
Information is not advice sources that have not been independently verified. No representation or warranty is made as to the accuracy,
This presentation is not, and is not intended to constitute, financial advice, or an offer or an invitation, reliability, adequacy or completeness of the information. This presentation should not be relied upon as a
solicitation or recommendation to acquire or sell WiseTech Global shares or any other financial products in recommendation or forecast by WiseTech Global. Market share information is based on management
any jurisdiction and is not a prospectus, product disclosure statement, disclosure document or other offering estimates except where explicitly identified.
document under Australian law or any other law. This presentation also does not form the basis of any
contract or commitment to sell or apply for securities in WiseTech Global or any of its subsidiaries. It is for No liability or responsibility
information purposes only. The information in this presentation is provided in summary form and is therefore not necessarily complete.
WiseTech Global does not warrant or represent that the information in this presentation is free from errors, To the maximum extent permitted by law, WiseTech Global and each of its subsidiaries, affiliates, directors,
omissions or misrepresentations or is suitable for your intended use. The information contained in this employees, officers, partners, agents and advisers and any other person involved in the preparation of this
presentation has been prepared without taking account of any person’s investment objectives, financial presentation disclaim all liability and responsibility (including without limitation, any liability arising from fault
situation or particular needs and nothing contained in this presentation constitutes investment, legal, tax or or negligence) for any direct or indirect loss or damage which may arise or be suffered through use or reliance
other advice. The information provided in this presentation may not be suitable for your specific needs and on anything contained in, or omitted from, this presentation. WiseTech Global accepts no responsibility or
should not be relied upon by you in substitution of you obtaining independent advice. Subject to any terms obligation to inform you of any matter arising or coming to its notice, after the date of this presentation, which
implied by law and which cannot be excluded, WiseTech Global accepts no responsibility for any loss, may affect any matter referred to in this presentation. This presentation should be read in conjunction with
damage, cost or expense (whether direct or indirect) incurred by you as a result of any error in, omission WiseTech Global’s other periodic and continuous disclosure announcements lodged with the ASX.
from or misrepresentation in this presentation.
37 © 2021 WiseTech Globalwww.wisetechglobal.com/investors
You can also read