1ST QUARTER 2021 EARNINGS RELEASE PRESENTATION - April 22, 2021

 
CONTINUE READING
1ST QUARTER 2021 EARNINGS RELEASE PRESENTATION - April 22, 2021
1ST QUARTER 2021 EARNINGS
RELEASE PRESENTATION
April 22, 2021
1ST QUARTER 2021 EARNINGS RELEASE PRESENTATION - April 22, 2021
“Safe Harbor” Statement Under the Private Securities Litigation Reform
 Act of 1995
This presentation contains forward-looking statements within the meaning of Section 21E of the Securities Exchange Act of 1934. Although AEP and each of its
Registrant Subsidiaries believe that their expectations are based on reasonable assumptions, any such statements may be influenced by factors that could cause
actual outcomes and results to be materially different from those projected. Among the factors that could cause actual results to differ materially from those in the
forward-looking statements are: changes in economic conditions, electric market demand and demographic patterns in AEP service territories, The impact of
pandemics, including COVID-19, and any associated disruption of AEP’s business operations due to impacts on economic or market conditions, electricity usage,
employees, customers, service providers, vendors and suppliers, inflationary or deflationary interest rate trends, volatility in the financial markets, particularly
developments affecting the availability or cost of capital to finance new capital projects and refinance existing debt, the availability and cost of funds to finance
working capital and capital needs, particularly during periods when the time lag between incurring costs and recovery is long and the costs are material,
decreased demand for electricity, weather conditions, including storms and drought conditions, and the ability to recover significant storm restoration costs, the
cost of fuel and its transportation, the creditworthiness and performance of fuel suppliers and transporters and the cost of storing and disposing of used fuel,
including coal ash and spent nuclear fuel, the availability of fuel and necessary generation capacity and performance of generation plants, the ability to recover
fuel and other energy costs through regulated or competitive electric rates, the ability to build or acquire renewable generation, transmission lines and facilities
(including the ability to obtain any necessary regulatory approvals and permits) when needed at acceptable prices and terms, including favorable tax treatment,
and to recover those costs, new legislation, litigation and government regulation, including changes to tax laws and regulations, oversight of nuclear generation,
energy commodity trading and new or heightened requirements for reduced emissions of sulfur, nitrogen, mercury, carbon, soot or particulate matter and other
substances that could impact the continued operation, cost recovery and/or profitability of generation plants and related assets, evolving public perception of the
risks associated with fuels used before, during and after the generation of electricity, including coal ash and nuclear fuel, timing and resolution of pending and
future rate cases, negotiations and other regulatory decisions, including rate or other recovery of new investments in generation, distribution and transmission
service and environmental compliance, resolution of litigation, the ability to constrain operation and maintenance costs, prices and demand for power generated
and sold at wholesale, changes in technology, particularly with respect to energy storage and new, developing, alternative or distributed sources of generation,
the ability to recover through rates any remaining unrecovered investment in generation units that may be retired before the end of their previously projected
useful lives, volatility and changes in markets for coal and other energy-related commodities, particularly changes in the price of natural gas, changes in utility
regulation and the allocation of costs within regional transmission organizations, including ERCOT, PJM and SPP, changes in the creditworthiness of the
counterparties with contractual arrangements, including participants in the energy trading market, actions of rating agencies, including changes in the ratings of
debt, the impact of volatility in the capital markets on the value of the investments held by the pension, other postretirement benefit plans, captive insurance entity
and nuclear decommissioning trust and the impact of such volatility on future funding requirements, accounting standards periodically issued by accounting
standard-setting bodies, and other risks and unforeseen events, including wars, the effects of terrorism (including increased security costs), embargoes, naturally
occurring and human-caused fires, cyber security threats and other catastrophic events, the ability to attract and retain requisite work force and key personnel.

 Darcy Reese, Vice President                                                Tom Scott, Director
    Investor Relations                                                         Investor Relations
    614-716-2614                                                               614-716-2686
    dlreese@aep.com                                                            twscott@aep.com

                                                                                                                                                                    2
1ST QUARTER 2021 EARNINGS RELEASE PRESENTATION - April 22, 2021
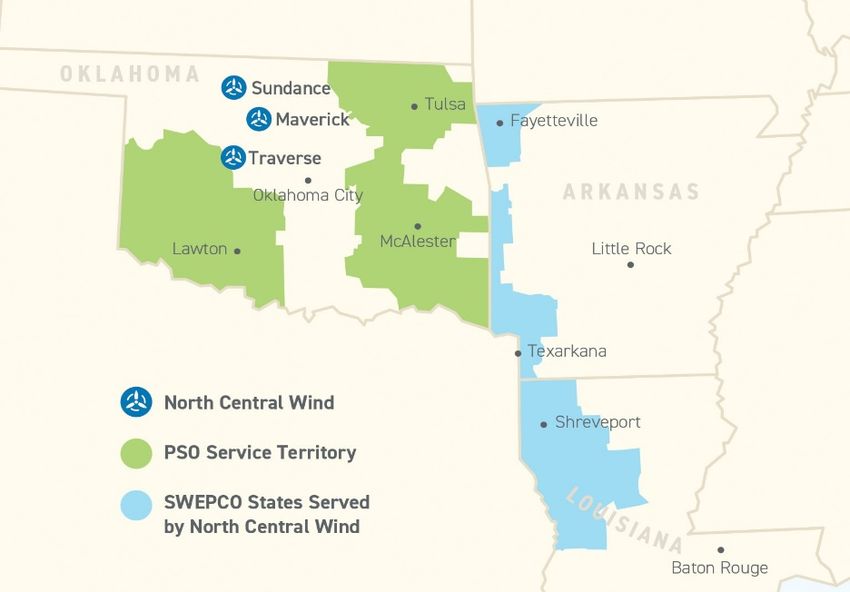
Non-GAAP Financial Measures
AEP reports its financial results in accordance with accounting principles generally accepted in the United States (GAAP). AEP
supplements the reporting of financial information determined in accordance with GAAP with certain non-GAAP financial
measures, including operating earnings (non-GAAP) and FFO to Total Debt. Operating earnings (non-GAAP) excludes certain
gains and losses and other specified items, including mark-to-market adjustments from commodity hedging activities and other
items as set forth in the reconciliation in the Appendix. FFO to Total Debt is adjusted for the effects of securitization, spent nuclear
fuel trust, capital and operating leases, pension, capitalized interest and changes in working capital. Operating earnings could
differ from GAAP earnings for matters such as impairments, divestitures, or changes in accounting principles. AEP management
is not able to forecast if any of these items will occur or any amounts that may be reported for future periods. Therefore, AEP is
not able to provide a corresponding GAAP equivalent for earnings guidance. Reflecting special items recorded through the first
quarter of 2021, the estimated earnings per share on a GAAP basis would be $4.56 to $4.76 per share.

This information is intended to enhance an investor’s overall understanding of period over period financial results and provide an
indication of AEP’s baseline operating performance by excluding items that are considered by management to be not directly
related to the ongoing operations of the business. In addition, this information is among the primary indicators management uses
as a basis for evaluating performance, allocating resources, setting incentive compensation targets and planning and forecasting
of future periods.

These non-GAAP financial measures are not a presentation defined under GAAP and may not be comparable to other companies’
presentations. AEP has provided these non-GAAP financial measures as supplemental information and in addition to the financial
measures that are calculated and presented in accordance with GAAP. These non-GAAP measures should not be deemed more
useful than, a substitute for, or an alternative to the most comparable GAAP measures provided in the materials presented.
Reconciliations of these non-GAAP measures to the most comparable GAAP measures are provided in the appendices and
supplemental schedules to this presentation.

                                                                                                                                       3
1ST QUARTER 2021 EARNINGS RELEASE PRESENTATION - April 22, 2021
1st Quarter 2021 Business Update
  1st Quarter 2021 operating earnings of $1.15 per share or $571M

  Reaffirming 2021 operating earnings guidance range of $4.55-$4.75 and 5%-7% long-term growth
    rate

  Promoting and accelerating a clean energy future
     o Commission of North Central Wind’s Sundance facility on April 14
     o Proposing up to 16,595 MW of new renewable energy to serve customers across the AEP
           system from 2021-2030, bringing renewable capacity to 51% of total generating capacity by
           2030
               An incremental 8,566 MW of renewables from what was disclosed at November 2020
                  EEI
               Inclusive of SWEPCO renewables announced on the Q4 2020 earnings call
     o Climate Scenario Analysis issued in March 2021 supporting carbon emission reduction goals of
           80% by 2030 and net zero by 2050
     o Acquire Rockport Plant Unit 2 as a short-term capacity bridge; acquisition ensures a planned
           retirement of both Units 1 and 2 no later than 2028, benefiting our stakeholders and the
           environment

  Current regulatory activity: AEP Ohio, APCo-Virginia, SWEPCO-Louisiana, SWEPCO-Texas, FERC

                                                                                                  4
1ST QUARTER 2021 EARNINGS RELEASE PRESENTATION - April 22, 2021
Future Forward - Advancing Towards a Clean Energy Future
Projected Regulated Resource Additions
                                            SOLAR ADDITIONS (MW)

                                                                              Prior Total
                                                                                            Incremental                 TOTAL PROJECTED
       Company           2021 – 2025        2026 – 2030             Total
                                                                              (2020 EEI)
                                                                                               Solar
                                                                                            Opportunity              RESOURCE ADDITIONS (MW)
    APCo                      210                450                 660         710           (50)
    I&M                       450                450                 900        1,300          (400)
                                                                                                                  Resource                      2021-2030
    KPCo                      150                300                 450         273           177
                                                                                                                  Solar                           5,910
    PSO                      1,350              2,250               3,600       1,211          2,389

    SWEPCO                    300                 -                  300         300             -                Wind                            10,685
    Total                    2,460              3,450               5,910       3,794          2,116
                                                                                                                  Natural Gas                     2,266
                                             WIND ADDITIONS (MW)
                                                                                            Incremental
                                                                                                                  Total                           18,861
       Company            2021 – 2025       2026 – 2030              Total    Prior Total      Wind
                                                                              (2020 EEI)    Opportunity

                                                                                                                Total regulated renewable
    APCo                     1,8001               -                 1,8001       600          1,2001

    I&M                       800                 -                  800         750            50

    KPCo                      500                500                1,000        200            800           opportunity of 16.6 GW by 2030
    PSO                      1,9752             1,300               3,2752      1,2752         2,000

    SWEPCO                   2,3102             1,500               3,8102      1,4102         2,400

    Total                    7,3852             3,300               10,6852     4,2352         6,450                  An 8.6 GW increase
                                        NATURAL GAS ADDITIONS (MW)                                                   since 2020 EEI update
                                                                                            Incremental
       Company           2021 – 2025        2026 – 2030             Total     Prior Total     Nat. Gas
                                                                              (2020 EEI)    Opportunity       Projected regulated resource additions current as of
    I&M                        -                 952                 952         824           128            3/31/21. AEP operating companies will continue to
    PSO                        -                 251                 251         783           (532)          develop Integrated Resource Plans (IRPs) over the
    SWEPCO                     -                1,063               1,063          -           1,063             near-term and long-term in collaboration with
    Total                      -                2,266               2,266       1,607          659                               stakeholders.
1   Includes 600 MW at WPCo
2   Includes 1,485 MW North Central Wind project (675 MW at PSO and 810 MW at SWEPCO) of which Sundance for
    199 MW was placed into service on 4/14/21
    Note: See Slide 26 in the Appendix for additional information
                                                                                                                                                           5
Regulated Returns
Twelve Months Ended 3/31/2021 Earned ROE’s
(non-GAAP operating earnings, not weather normalized)
14%

12%

10%              10.3%                                10.4%                             10.1%
                                                              9.1%    9.1%
                             8.6%
    8%
                                                                               7.7%

    6%
                                          4.8%
    4%

    2%

    0%
                  AEP        APCo1    KENTUCKY         I&M    PSO    SWEPCO1    AEP      AEP
                 OHIO1                 POWER1                                  TEXAS TRANSMISSION

Regulated Operations ROE of 9.1%
(as of March 31, 2021)

1
    Base rate cases pending/order recently received

Sphere size based on each company’s relative equity balance

                                                                                                    6
1st Quarter 2021 Financial Update

                                    $1.16                                           $1.15

                                                                 $1.02
            $1.00

            2020                    2021                         2020                   2021
                     GAAP EPS                                           OPERATING EPS

 Delivered GAAP earnings of $1.16 per share of $575M for the first quarter of 2021

 Delivered operating earnings of $1.15 per share or $571M for the first quarter of 2021
           2019                   2020                        2019                2020

Refer to Appendix for reconciliation between GAAP and Operating EPS

                                                                                               7
1st Quarter Operating Earnings Segment Detail

                                                                                                                                                                         $1.15
                                                                                                                                                     0.04                PER SHARE
                                                                                           0.07                    (0.01)

   $1.02                          0.04                        (0.01)
  PER SHARE

                        Rate Changes        $0.02     Rate Changes      $0.03     Invest Growth     $0.06   Wholesale           $(0.03)   Investment Gain      $0.03

                        Weather             $0.10     Weather           $0.03     Other             $0.01   Renewables          $(0.01)   Interest             $0.02

                        Normal Load         $(0.04)   Normal Load       $(0.04)                             Generation          $0.03     Income Taxes         $(0.01)
                        Prior Period Fuel             Trans Revenue     $0.04
                                            $(0.02)
                        Adj
                                                      O&M               $(0.01)
                        Off-System Sales    $0.03
                                                      Depreciation      $(0.02)
                        Trans Revenue       $0.03
                                                      Other Taxes       $(0.02)
                        O&M                 $(0.02)
                                                      Income Taxes      $(0.01)
                        Depreciation        $(0.05)
                                                      Other             $(0.01)
                        Other Taxes         $(0.01)

                              VERTICALLY                TRANSMISSION AND                  AEP                    GENERATION                     CORPORATE
    2020 Actual               INTEGRATED                  DISTRIBUTION                TRANSMISSION               & MARKETING                    AND OTHER                2021 Actual
                                UTILITIES                    UTLITIES                   HOLDCO
  2021 Actual EPS                  $0.54                        $0.23                       $0.35                       $0.06                        $(0.03)                $1.15

Refer to Appendix for additional explanation of variances by segment

                                                                                                                                                                               8
Weather Normalized Billed Retail Load Trends

AEP Normalized Residential GWh Sales                                          AEP Normalized Commercial GWh Sales
% Change vs. Prior Year                                                       % Change vs. Prior Year
10%                                                                           10%
                  6.2%
                                       5.2%
 5%                          3.8%                                              5%
                                                  1.5%
                                                                                       0.0%
 0%                                                                            0%
        -1.2%                                               -1.1%                                                                     -0.5%
                                                                                                                   -2.1%   -1.6%
-5%                                                                            -5%
                                                                                                           -4.6%

-10%                                                                          -10%
                                                                                                -10.1%
-15%                                                                          -15%
       Q1-20      Q2-20     Q3-20      Q4-20     Q1-21      2021E                     Q1-20      Q2-20     Q3-20   Q4-20   Q1-21     2021E

AEP Normalized Industrial GWh Sales                                           AEP Total Normalized GWh Sales
% Change vs. Prior Year                                                       % Change vs. Prior Year
10%                                                                           10%

 5%                                                                            5%
                                                            1.9%
                                                                                                                   0.2%               0.2%
 0%                                                                            0%
        -0.7%                                                                         -0.7%
                                       -2.0%                                                               -2.6%           -1.9%
-5%                                                                            -5%
                                                 -6.1%                                           -5.9%
                            -7.8%
-10%                                                                          -10%

                  -12.4%
-15%                                                                          -15%
       Q1-20      Q2-20     Q3-20      Q4-20     Q1-21      2021E                     Q1-20      Q2-20     Q3-20   Q4-20   Q1-21     2021E

 Load figures are provided on a billed basis. Charts reflect connected load and exclude firm wholesale load.

 Note: Q1-20 GWh sales were primarily at pre-pandemic levels in comparison to Q1-21 GWh sales. Also, Q1-21 industrial GWh sales were down
       -6.1% vs. Q1-20 largely due to the one-time storm event which impacted AEP’s western service territory by -12.8%. Comparatively, AEP’s
       eastern service territory was down -2.6%.
                                                                                                                                                9
Industrial Sales Growth

                                                                          AEP Industrial GWh Growth

                       10%                                  9.5%                          9.7%
                                                                                                                                                                     $75

                              5.7%
                                             4.4%                          4.9%

                                                                                                                                      1.3%
                        0%
Growth vs Prior Year

                                                                                                                                                                     $50
                                                                                                         -0.9%
                                     -2.5%
                                                                                                                                             -3.3%           -3.3%
                                                                   -5.0%                         -4.7%
                                                    -5.2%                                                             -5.5%
                                                                                  -6.6%

                       -10%
                                                                                                                              -8.7%
                                                                                                                                                                     $25
                                                                                                                                                     -9.6%
                                              Oil & Gas Related Sectors

                                              Non-Oil & Gas Related Sectors

                                              Oil Price                                                      -16.8%
                       -20%                                                                                                                                          $-
                               Q1-19          Q2-19          Q3-19          Q4-19          Q1-20           Q2-20        Q3-20          Q4-20           Q1-21

                                                                                                                                                                           10
Economic Data – AEP Service Territory

                                        GDP Growth by Quarter                                                                     Employment Growth by Quarter

                                                                                                                         5%
                                                                                       6.4%
                                                                                           5.2%
                       5%                                                                                                                                                                2.6%
                                                                                                                                                                                                1.7%
                                                                                                                               1.1%
                                                                                1.6%

                                                                                                  Growth vs Prior Year
                                                                                                                         0%
Growth vs Prior Year

                             0.3%                                        0.2%
                       0%
                                                                                                                                                                                 -1.6%
                                                                     -1.8%
                                                    -2.8%       -2.4%
                                -3.7%                                                                                    -5%      -4.6%                                -4.5%
                       -5%                              -4.3%
                                            -4.9%                                                                                                                           -5.6%
                                                                                                                                                                   -6.0%
                                                                                                                                              -6.3%        -6.3%
                                                                                                                                                      -6.8%
                                                                    US   AEP                                                                                                        US   AEP

                                        -9.0%                                                                                             -11.2%
              -10%                                                                                                  -10%
                              Q1-20      Q2-20       Q3-20       Q4-20       Q1-21      2021 E                                  Q1-20       Q2-20       Q3-20       Q4-20      Q1-21      2021 E

      Source: Moody’s Analytics

                                                                                                                                                                                                11
Capitalization & Liquidity
                Total Debt/Total Capitalization
                                                 61.8%      62.5%      61.8%
                                                                               1
                                                                                                                              Credit Statistics
                                     59.8%
 55.9%         55.5%       57.0%
                                                                                                                                                 Moody’s                GAAP
                                                                                                          FFO to Total Debt                        9.1%                 8.9%

                                                                                                       Adj FFO to Total Debt1                     12.9%                 12.7%

                                                                                                          Long-Term Target                           Low to Mid Teens
                                                                                                                    Represents the trailing 12 months as of 3/31/2021
                                                                                                                        See Appendix for reconciliation to GAAP

     2016       2017      2018    2019           2020      Q1-21 Q1-21 Adj                                                   Liquidity Summary
                  Short/Long Term Debt        Securitization Debt
                                                                                                  ($ in millions)                                    3/31/2021 ACTUAL

                   Qualified Pension Funding                                                                                                     Amount             Maturity
                   101%                                  102%         104%                       Revolving Credit Facility                        $ 4,000         March 2026
       96%                       99%         97%
                                                                                                 Revolving Credit Facility                         1,000          March 2023
                                                                                                 364-Day Term Loan                                  500           March 2022
                                                                                                 Plus
                                                                                                 Cash & Cash Equivalents                            273
                                                                                                 Less
                                                                                                 Commercial Paper Outstanding                     (1,874)
                                                                                                 364-Day Term Loan                                 (500)
                                                                                                 Letters of Credit Issued                             -
       2016         2017         2018        2019         2020        Q1-21                      Net Available Liquidity                          $ 3,399

 1   Adjusted data excludes impact of Storm Uri in February that resulted in significant fuel and purchased power costs at PSO and SWEPCO and related incurrence
     of debt as of 3/31/2021. AEP’s credit metrics will see temporary pressure in 2021 as we work through the regulatory recovery process at PSO and SWEPCO.
     Management is in frequent contact with rating agencies to keep them apprised of all aspects of the business. AEP’s long-term FFO to Total Debt target remains
     at low to mid teens.

                                                                                                                                                                          12
Summary

    Reaffirm 2021 operating earnings guidance range of $4.55-$4.75
     and 5%-7% long-term growth rate

    Promote and accelerate a clean energy future

    North Central Wind financing for Sundance

                   North Central Wind - Sundance

                                                                      13
APPENDIX

           14
1st Quarter Reconciliation of GAAP to Operating Earnings

                                                              $ in millions                Earnings Per Share
                                                   Q1-20          Q1-21       Change   Q1-20     Q1-21    Change

    Reported GAAP Earnings                         $ 495              $ 575    $ 80    $ 1.00    $ 1.16    $ 0.16

    Non Operating Items:

    Mark-to-Market Impact of
                                                      6                (4)     (10)    0.01      (0.01)     (0.02)
    Commodity Hedging Activities1
    Impact of COVID-192,3                             3                 -       (3)    0.01        -        (0.01)

    AEP Operating Earnings                         $ 504              $ 571    $ 67    $ 1.02    $ 1.15    $ 0.13

1 Items recorded in Generation & Marketing segment
2 Items recorded in Vertically Integrated Utilities Segment
3 Items recorded in Transmission and Distribution Utilities Segment

Weighted average no. of shares outstanding: 494.6M Q1-20 and 497.1M Q1-21
                                                                                                                15
Vertically Integrated Utilities
1st Quarter Summary                                                                  Key Drivers: Q1-21 vs. Q1-20
$ in millions (except EPS)                               Q1-20             Q1-21      Rate Changes: $15M favorable vs. prior year
Operating Revenues                                       $ 2,227           $ 2,537     primarily from rate increases at KPCo, I&M
                                                                                       and SWEPCO
Operating Expenses:
                                                                                      Weather: $61M favorable vs. prior year; $5M
                                   Energy Costs           (671)             (859)      unfavorable vs. normal
                  Operations and Maintenance              (689)             (740)
                                                                                      Normal Load: $23M unfavorable vs. prior
                 Depreciation and Amortization            (382)             (432)      year primarily due to lower commercial and
                                                                                       industrial sales, partially offset by higher
              Taxes Other Than Income Taxes               (117)             (124)      residential sales
Operating Income                                           368               382
                                                                                      Off-System Sales: $21M favorable vs. prior
                             Net Interest/AFUDC           (135)             (129)      year primarily due to impacts of Storm Uri in
                                                                                       February
       Non-Service Benefit Cost Components                  17                17
                                                                                      Transmission Revenue: $17M favorable vs.
                                   Income Taxes            (3)                 -       prior year primarily due to increased
Operating Earnings                                         247               270       transmission investment at APCo, I&M and
                                                                                       SWEPCO
Proforma Adjustments, Net of Tax                           (2)                 -
                                                                                      Depreciation:      $30M unfavorable (net of
GAAP Earnings                                             $ 245             $ 270      offsets) vs. prior year primarily due to higher
       EPS from Operating Earnings                       $ 0.50            $ 0.54
                                                                                       depreciable property balance

                                                                                      Income Taxes: actual rate of (0.1)% Q1-21
See slide 15 for items excluded from Net Income to reconcile to Operating Earnings
                                                                                       vs. 1.0% Q1-20

                                                                                                                                 16
Transmission and Distribution Utilities
1st Quarter Summary                                                                  Key Drivers: Q1-21 vs. Q1-20
$ in millions (except EPS)                               Q1-20             Q1-21      Rate Changes: $22M favorable vs. prior
Operating Revenues                                       $ 1,107           $ 1,088     year primarily from the Texas DCRF and
                                                                                       Ohio DIR
Operating Expenses:

                                   Energy Costs           (191)             (205)
                                                                                      Weather: $19M favorable vs. prior year;
                                                                                       $14M favorable vs. normal
                  Operations and Maintenance              (366)             (365)
                                                                                      Normal Load: $23M unfavorable vs. prior
                 Depreciation and Amortization            (215)             (173)
                                                                                       year primarily due to lower commercial,
              Taxes Other Than Income Taxes               (146)             (158)      industrial and residential sales

Operating Income                                           189               187      Transmission Revenue: $27M favorable
                             Net Interest/AFUDC            (63)              (67)      vs. prior year primarily due to increased
                                                                                       transmission investment
       Non-Service Benefit Cost Components                  7                 7
                                                                                      Income Taxes: actual rate of 10.3% Q1-
                                   Income Taxes            (16)              (13)
                                                                                       21 vs. 11.8% Q1-20
Operating Earnings                                         117               114

Proforma Adjustments, Net of Tax                           (1)                 -

GAAP Earnings                                             $ 116             $ 114

       EPS from Operating Earnings                       $ 0.24            $ 0.23

See slide 15 for items excluded from Net Income to reconcile to Operating Earnings

                                                                                                                            17
AEP Transmission Holdco
1st Quarter Summary                                                 Key Drivers: Q1-21 vs. Q1-20
$ in millions (except EPS)                        Q1-20    Q1-21     $31M favorable Operating Earnings vs.
Operating Revenues                                $ 310    $ 377      prior year primarily due to increased
                                                                      transmission investment
Operating Expenses:

                  Operations and Maintenance       (30)     (27)

                 Depreciation and Amortization     (58)     (73)

              Taxes Other Than Income Taxes        (52)     (59)

Operating Income                                   170      218

                             Net Interest/AFUDC    (14)     (18)

       Non-Service Benefit Cost Components          1        -

                                  Income Taxes     (38)     (46)

                                Equity Earnings    23       19

                                         Other     (1)      (1)

Operating and GAAP Earnings                       $ 141    $ 172

       EPS from Operating Earnings                $ 0.28   $ 0.35

                                                                                                       18
Generation & Marketing
1st Quarter Summary                                                                  Key Drivers: Q1-21 vs. Q1-20
$ in millions (except EPS)                               Q1-20             Q1-21      Generation increased 387 GWh or 52%
Operating Revenues                                        $ 447             $ 629      Q1-21 vs Q1-20 primarily due to higher
                                                                                       market prices in PJM which drove
Operating Expenses:                                                                    increased generation at Cardinal plant
                                   Energy Costs           (361)             (566)
                                                                                      AEP Dayton ATC liquidations up 51%:
                  Operations and Maintenance               (41)              (28)      $30.33/MWh in Q1-21 vs. $20.14/MWh in
                                                                                       Q1-20
                 Depreciation and Amortization             (18)              (19)

              Taxes Other Than Income Taxes                (3)               (3)      Wholesale decreased primarily due to
                                                                                       unfavorable ERCOT market prices and
Operating Income                                            24                13       extreme usage levels caused by Storm Uri
                             Net Interest/AFUDC            (8)               (3)
                                                                                      Income Taxes: actual rate of (94.4)% Q1-
       Non-Service Benefit Cost Components                  4                 4        21 vs. (41.1)% Q1-20
                                   Income Taxes             11                16

                                            Other           4                 2

Operating Earnings                                          35                32

Proforma Adjustments, Net of Tax                           (6)                4

GAAP Earnings                                              $ 29             $ 36

       EPS from Operating Earnings                       $ 0.07            $ 0.06

See slide 15 for items excluded from Net Income to reconcile to Operating Earnings

                                                                                                                           19
1st Quarter Rate Performance

Vertically Integrated Utilities               Transmission and Distribution Utilities
                    Rate Changes, net of                        Rate Changes, net of
                    offsets ($ in millions)                     offsets ($ in millions)
                      Q1-21 vs. Q1-20                              Q1-21 vs. Q1-20
APCo/WPCo                     $1               AEP Ohio                   $2
I&M                           $2               AEP Texas                 $20
KPCo                          $8               TOTAL                     $22
PSO                           $1
SWEPCO                        $3               Impact on EPS            $0.03
Kingsport                      -
TOTAL                        $15

Impact on EPS               $0.02

                                                                                     20
1st Quarter Weather Impact

Vertically Integrated Utilities           Transmission and Distribution Utilities
                     Weather Impact                           Weather Impact
                      ($ in millions)                          ($ in millions)
                   Q1-21 vs. Q1-21 vs.                      Q1-21 vs. Q1-21 vs.
                    Q1-20        Normal                      Q1-20        Normal
APCo/WPCo            $33           $(6)   AEP Ohio              -            -
I&M                    $8         $(4)     AEP Texas           $19        $14
KPCo                   $7           -      TOTAL               $19        $14
PSO                    $3          $1
SWEPCO                $10          $4      Impact on EPS      $0.03      $0.02
Kingsport              -            -
TOTAL                 $61         $(5)

Impact on EPS        $0.10        $0.01

                                                                                 21
1st Quarter Retail Load Performance

Vertically Integrated Utilities                                                          Transmission and Distribution Utilities
                                         Retail Load1                                                          Retail Load1
                                     (weather normalized)                                                  (weather normalized)
                                          Q1-21 vs. Q1-20                                                     Q1-21 vs. Q1-20
APCo/WPCo                                        (1.2)%                                  AEP Ohio                  0.9%
I&M                                              (0.9)%                                  AEP Texas                (5.6)%
KPCo                                             (4.2)%                                  TOTAL                    (1.6)%
PSO                                              (1.6)%
SWEPCO                                           (3.6)%                                  Impact on EPS2           $0.04
Kingsport                                       (15.3)%
TOTAL                                            (2.1)%

Impact on EPS2                                   $0.04

1   Includes load on a bill basis only, excludes firm wholesale load and accrued sales
2   Includes EPS impact of accrued revenues

                                                                                                                                22
Current Rate Case Activity
                                   AEP Ohio                                                                                APCo - Virginia
Docket #                                                          20-0585-EL-AIR          Docket #                                                             PUR-2020-00015
Filing Date                                                               6/1/2020        Filing Date                                                                 3/31/2020
Requested Revenue Increase                                                   $402M        Requested Rate Base                                                              $2.5B
Requested Rate Base                                                        $3.105B        Requested ROE                                                                     9.9%
Requested ROE                                                               10.15%        Cap Structure                                                           50%D / 50%E
Cap Structure                                                   45.6%D / 54.4%E           Gross Revenue Increase                                        $65M (Less $27M D&A)
Net Revenue Increase                                                         $41M1        Net Revenue Increase                                                             $38M
Test Year                                                               11/30/2020        Test Year                                                                  12/31/2019

Settlement Summary                                Pending Commission Approval             Commission Order Summary2,3
Settlement Filed                                                         3/12/2021            Order Received                                                         11/24/2020
Settlement Hearing                                                       5/12/2021            Effective Date                                                          1/23/2021
Revenue Increase                                                             $295M            ROE                                                                           9.2%
Rate Base                                                                  $3.088B            Cap Structure                                                       50%D / 50%E
ROE                                                                           9.7%            Gross Revenue Increase                                   $0M (Less $25.5M D&A)
Cap Structure                                                   45.6%D / 54.4%E               Net Revenue Decrease                                                       $25.5M
Net Revenue Decrease                                                         $64M1
                                                                                          2   On 11/25/2020, APCo filed an appeal of the commission order with the Virginia Supreme
1   Approximately $60M of the filed vs. settled difference reflects the discontinuation       Court. On 4/20/2021, APCo also filed with the Virginia Supreme Court for $40.5M in
     of EE/DSM programs and movement of certain items from base rates to riders;              interim rates and an expedited appeal schedule.
     no earnings impact.                                                                  3   On 12/14/2020, APCo filed a petition for reconsideration with the Virginia SCC which
                                                                                              was subsequently granted on 12/15/2020. On 3/26/2021, the Virginia SCC issued an
                                                                                              order on reconsideration affirming the original final order.

                                                                                                                                                                           23
Current Rate Case Activity
                      KPCo                                        SWEPCO - Louisiana                                          SWEPCO - Texas
Docket #                              2020-00174                                                               Docket #                                      51415
                                                     Docket #                                      U-35441
Filing Date                             6/29/2020                                                              Filing Date                              10/13/2020
                                                     Filing Date                                12/18/2020
                                                                                                               Requested Rate Base                           $2.0B
Requested Rate Base                         $1.4B
                                                     Requested Rate Base                              $2.1B    Requested ROE                                10.35%
Requested ROE                                10%
                                                     Requested ROE                                  10.35%     Cap Structure                      50.6%D / 49.4%E
                               53.7%D / 3.0%AR /                                                               Gross Revenue                                $90M3
Cap Structure                                        Cap Structure                       49.2%D / 50.8%E
                                         43.3%E                                                                Increase                           (Less $17M D&A)
Net Revenue Increase                        $65M                                                  $134M        Net Revenue Increase                           $73M
                                                     Gross Revenue Increase
                                                                                         (Less $41M D&A)
Test Year                               3/31/2020                                                              Test Year                                 3/31/2020
                                                     Net Revenue Increase                             $93M

                                                     Test Year                                 12/31/20192     Procedural Schedule
Commission Order
Summary 1                                                                                                          Rebuttal Testimony                    4/23/2021
                                                     2   Includes proposed pro-forma adjustment to plant in-
    Order Received                      1/13/2021        service through 12/31/2020                                Hearing                               5/19/2021

    Effective Date                      1/14/2021                                                                  Expected
                                                                                                                                                             Q4-21
                                                                                                                   Commission Order
    ROE                                     9.3%
                                                                                                               3   Does not include $15M of current riders moving to
                               53.7%D / 3.0%AR /                                                                   base rates
    Cap Structure
                                         43.3%E

    Net Revenue Increase                    $52M

1   On 3/12/2021, KPCo filed an appeal with the
    Franklin County Circuit Court, Commonwealth of
    Kentucky, related to basic rate design items.

                                                                                                                                                              24
North Central Wind Overview

                                                                                  SWEPCO AND PSO
                                                                             REGULATED WIND INVESTMENT
                                                     Total Rate Base Investment                        ~$2 billion (1,485 MW)
                                                                                          Name           MW       Investment    Target Date
                                                                                                                                Apr. 14, 2021
                                                                                        Sundance         199        $307M
                                                                                                                                (100% PTC)

                                                        North Central Wind                                                        Dec. 2021
                                                                                         Maverick        287        $402M
                                                                                                                                 (80% PTC)
                                                                                                                                Dec. 2021 to
                                                                                         Traverse        999       $1,287M        Apr. 2022
                                                                                                                                 (80% PTC)
                                                        Net Capacity Factor                                      44%
                                                         Customer Savings                           ~$3 billion (30-year nominal $)
                                                             Developer                                         Invenergy
                                                          Turbine Supplier                                       GE

             APPROVED MW ALLOCATION                     Note: Facilities to be acquired on a fixed cost, turn-key basis at completion

 Jurisdiction (Docket #)     MW       % of Project

PSO (PUD 2019-00048)         675         45.5%

SWEPCO – AR (19-035-U)       268         18.1%
                                                          Regulatory approvals achieved in
SWEPCO – LA (U-35324)        464         31.2%
                                                     Oklahoma, Louisiana, Arkansas and at FERC
SWEPCO - FERC                 78         5.2%
                    Total:   1,485       100%

                                                                                                                                        25
Future Forward - Advancing Towards a Clean Energy Future

         ~8 GW of planned                                                        Capacity need plus                                           Total regulated renewable
     retirements and expiring                                                     economic energy                                             opportunity of 16.6 GW by
    PPAs over the next 10 years                                                      opportunity                                                         2030

    Regulated Generation Retirement and PPA                                                                              AEP Regulated Operating Companies
          Expirations (MW) 2021-2030                                                                                Projected Retirement and PPA Expirations (MW)
                                                                                                    6,000

                                                                                                    5,000
                   1,129
                                                                                                    4,000
             569                                            ~8 GW of planned
                                                        retirements and expiring                    3,000
                                                        PPAs over next 10 years
                                              1          driving capacity needs                     2,000
           1,493                      4,979
                                                                                                    1,000

                                                                                                         0
                                                                                                                          2021-2025                            2026-2030
Coal     Natural Gas       Natural Gas PPAs        Wind PPAs                                                              Coal     Natural Gas      Gas PPA   Wind PPA

       Of the 16.6 GW of renewables opportunities identified, ~2 GW2 are in AEP’s 2021-2025 capital plan.

       To date, requests for proposals (RFPs) have been issued for 355 MW3 of renewable resources. An
              RFP for the 3.3 GW renewable opportunity at SWEPCO remains on track for Q2-21.

1 Does not include retirement of the 595 MW Cardinal plant in 2030 which is part of AEP’s unregulated generation fleet
2 Primarily inclusive of the 1,485 MW North Central Wind project and 2020/2021 RFPs issued at APCo for 355 MW related to the Virginia Clean Economy Act
3 Represents 2020/2021 RFPs issued at APCo

                                                                                                                                                                           26
2021 - 2025 Capital Forecast of $37B and Net Plant

                                        2021-2025 Capital Forecast
                                              Nuclear Generation       IT/Workplace Services
          Regulated Fossil/Hydro Generation       $0.4B • 1%                $2.6B • 7%
                     $0.9B • 2%

Regulated Environmental Generation
            $0.9B • 2%
                                                                                                       100%
                                                                                                 of capital allocated to
Regulated New Generation
                                                                                               regulated businesses and
       $0.9B • 2%
                                                                                                 contracted renewables
                                                                     Distribution
                                                                     $10.7B • 29%
                                                                                                  FOCUS ON
 Regulated Renewables
                                                                                                   WIRES &
      $2.8B • 8%
                                                                                                 RENEWABLES

  Contracted Renewables                                                                                 72%
        $2.1B • 6%                                                                                 allocated to wires

                                 AEP Transmission
                                      Holdco
                                                                   Transmission
                                                                    $8.1B • 22%
                                                                                                        14%
                                   $7.9B • 21%                                                 allocated to renewables

                                                                                                                           27
Cash Flows and Financial Metrics

$ in millions                                                                               2021E                         2022E                          2023E
Cash from Operations                                                                        $ 3,800                       $ 6,000                        $ 6,400
Capital & JV Equity Contributions1                                                          (7,500)                       (8,000)                        (6,900)
Other Investing Activities                                                                   (300)                         (300)                          (300)
Common Dividends2                                                                           (1,400)                       (1,500)                        (1,500)
Required Capital                                                                            $ (5,400)                    $ (3,800)                      $ (2,300)
Financing
Required Capital                                                                            $ (5,400)                    $ (3,800)                      $ (2,300)
Debt Maturities (Senior Notes, PCRBs)                                                       (2,000)                       (3,000)                        (1,400)
Securitization Amortizations                                                                 (100)                         (100)                          (100)
Equity Units Conversion                                                                         -                           805                            850
Equity Issuances – Includes DRP3                                                              600                          1,400                           100
Debt Capital Market Needs (New)                                                             $ (6,900)                    $ (4,695)                      $ (2,850)
Financial Metrics
Debt to Capitalization (GAAP)                                                                                    Approximately 60%
                                                                                                            2021 pressured by Storm Uri;
FFO/Total Debt (Moody’s)
                                                                                                     long-term target remains at low to mid teens

1  Capital expenditures in 2021 include $709M for North Central Wind’s Sundance and Maverick projects.            3   Equity needs in 2021 include approximately $500M for North
  Expenditures in 2022 include $1.287B for North Central Wind’s Traverse project.                                     Central Wind’s Sundance and Maverick projects. Equity
2 Common dividends increased to $0.74 per share Q4-20; $2.96/share 2021-2023. Dividends evaluated by                  needs in 2022 include approximately $800M for North
  Board of Directors each quarter; stated target payout ratio range is 60%-70% of operating earnings. Targeted        Central Wind’s Traverse project. Total equity needs for the
  dividend growth in line with earnings.                                                                              project are $1.3B.

    Actual cash flows will vary by company and jurisdiction based on regulatory outcomes.

                                                                                                                                                                         28
GAAP to Non-GAAP Reconciliations and Ratios
Adjusted FFO Calculation                                                                    Adjusted Total Debt Calculation
                                                          12 Months                                                                                          As of
                                                         Ended 3/31/21                                                                                      3/31/21
                                                             (in millions)                                                                              (in millions)

Cash Flow From Operations                                      $ 4,285                        GAAP Total Debt
                                                                                                                                                            $ 34,268
                                                                                              (incl. current maturities)
       Adjustments:
                                                                                                  Less:
                   Changes in Working Capital                    240
                                                                                                                      Securitization Bonds                   (699)
                              Capitalized Interest               (63)
                                                                                                                 Spent Nuclear Fuel Trust                    (281)
                     Securitization Amortization                (152)
                                                                                                       Equity Units Capital Adjust (25%)                     (414)
Adjusted Funds from Operations (FFO)                           $ 4,310
                                                                                                  Add:

                                                                                                               Finance Lease Obligations                      283

                                                                                                                         Operating Leases                     866

                                                                                              Adjusted Total Debt (Non-GAAP)                                $ 34,023

                                                        Adjusted Funds from Operations
           Adjusted FFO                                             (FFO)                                      $ 4,310
        to Total Debt Ratio                                   Adjusted Total Debt
                                                                                                          =                        =       12.7%1
                                                                                                               $ 34,023
                                                                 (Non-GAAP)

1   Adjusted FFO to Total Debt is 12.9% on a Moody’s basis. Both GAAP and Moody’s views of FFO to Total Debt exclude the impact of Storm Uri in February.
    Refer to slide 12 for additional information.

                                                                                                                                                                     29
You can also read