2017 GLOBAL HUNGER INDEX - THE INEQUALITIES OF HUNGER
←
→
Page content transcription
If your browser does not render page correctly, please read the page content below
2017
GLOBAL HUNGER INDEX
THE INEQUALITIES OF HUNGER
2017
GLOBAL HUNGER INDEX
THE INEQUALITIES OF HUNGER

International Food Policy Research Institute
Klaus von Grebmer, Jill Bernstein, Tracy Brown, Nilam Prasai, Yisehac Yohannes

Concern Worldwide
Olive Towey, Connell Foley

Welthungerhilfe
Fraser Patterson, Andrea Sonntag, Sophia-Marie Zimmermann

Guest Author
Naomi Hossain, Institute of Development Studies

Washington, DC / Dublin / Bonn
October 2017

A Peer-Reviewed Publication
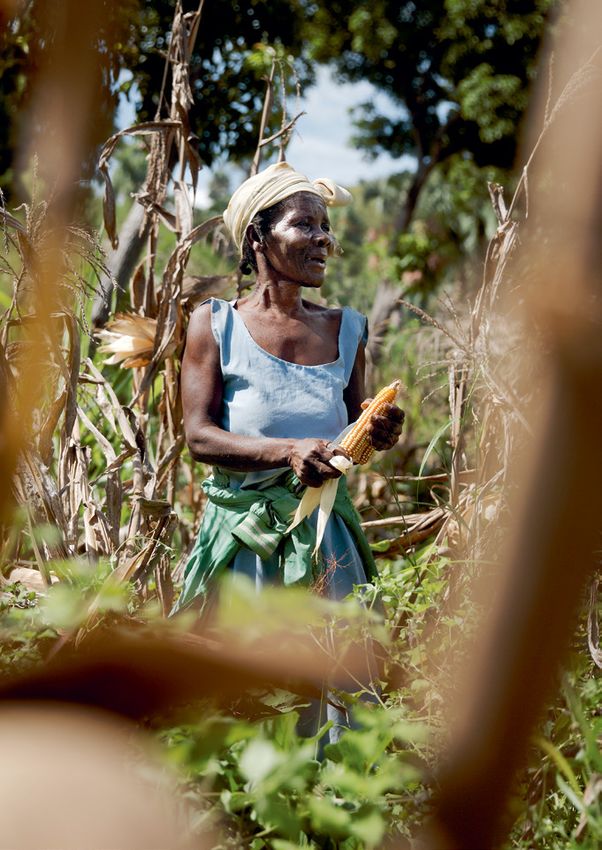
Annette Bauteluz of Vieille Place in Nord-Ouest, Haiti, during the corn
harvest. Most Haitian households are involved in agriculture. Women
in Haiti, as in many countries, play a significant role in farming. Due to
gender-discriminatory norms in access to food, women are more likely to
suffer from hunger and malnutrition.
FOREWORD

On February 20, 2017, the world awoke to a headline that should          the relationship between hunger, inequality, and power. Underlying
have never come about: Famine had been declared in parts of South        nutritional inequalities, Dr. Hossain argues, are inequalities of
Sudan, the first to be announced anywhere in the world in six years.     power—social, economic, or political.
This was on top of imminent famine warnings in northern Nigeria,              The 2017 Global Hunger Index, jointly published by the
Somalia, and Yemen, putting a total of 20 million people at risk of      International Food Policy Research Institute (IFPRI), Concern
starvation. The formal famine declaration in South Sudan meant           Worldwide, and Welthungerhilfe, tracks the state of hunger world-
that people were already dying of hunger. Meanwhile, Venezuela’s         wide, spotlighting those places where action to address hunger is
political turmoil created massive food shortages in both the city and    most urgently needed. This year’s index shows mixed results: Despite
countryside, leaving millions without enough to eat in a region that,    a decline in hunger over the long term, the global level remains high,
overall, has low levels of hunger. As the crisis there escalated and     with great differences not only among countries but also within coun-
food prices soared, the poor were the first to suffer.                   tries. For example, at a national level, Central African Republic (CAR)
   Despite years of progress, food security is still under threat.       has extremely alarming levels of hunger and is ranked highest of all
Conflict and climate change are hitting the poorest people the hard-     countries with GHI scores in the report. While CAR made no prog-
est and effectively pitching parts of the world into perpetual crisis.   ress in reducing hunger over the past 17 years—its GHI score from
Although it has been said that “hunger does not discriminate,” it        2000 is the same as in 2017—14 other countries reduced their GHI
does. It emerges the strongest and most persistently among popu-         scores by more than 50 percent over the same period.
lations that are already vulnerable and disadvantaged.                        At the subnational level, inequalities of hunger are often obscured
   Hunger and inequality are inextricably linked. By committing to       by national averages. In northeast Nigeria, 4.5 million people are
the UN Sustainable Development Goals, the international commu-           experiencing or are at risk of famine while the rest of the country is
nity promised to eradicate hunger and reduce inequality by 2030.         relatively food secure. This year’s report also highlights trends related
Yet the world is still not on track to reach this target. Inequality     to child stunting in selected countries including Afghanistan, where
takes many forms, and understanding how it leads to or exacer-           rates vary dramatically—from 24.3 percent of children in some parts
bates hunger is not always straightforward. For example, women           of the country to 70.8 percent in others.
and girls comprise 60 percent of the world’s hungry, often the                While the world has committed to reaching Zero Hunger by 2030,
result of deeply rooted social structures that deny women access         the fact that over 20 million people are currently at risk of famine
to education, healthcare, and resources. Likewise, ethnic minori-        shows how far we are from realizing this vision. As we fight the scourge
ties are often victims of discrimination and experience greater lev-     of hunger across the globe, we must understand how inequality con-
els of poverty and hunger. Most closely tied to hunger, perhaps, is      tributes to it. To ensure that those who are affected by inequality can
poverty, the clearest manifestation of societal inequality. Three-       demand change from national governments and international organi-
quarters of the world’s poor live in rural areas, where hunger is        zations and hold them to account, we must understand and redress
typically higher. This year’s essay, authored by Naomi Hossain,          power imbalances. This is crucial if we are to reach the Sustainable
research fellow at the Institute of Development Studies, focuses on      Development Goals by 2030 and end hunger forever.

Dr. Till Wahnbaeck                                Dr. Shenggen Fan                                    Dominic MacSorley
Chief Executive Officer                           Director General                                    Chief Executive Officer
Welthungerhilfe                                   International Food Policy                           Concern Worldwide
                                                  Research Institute

2017 Global Hunger Index | Foreword3
CONTENTS

     Chapter 01                       Chapter 02                       Chapter 03                        Chapter 04

SUMMARY                                                                                                                   5

CHAPTERS
01      The Concept of the Global Hunger Index                                                                            6
02      Global, Regional, and National Trends                                                                            10
03      Inequality, Hunger, and Malnutrition: Power Matters                                                              24
04      Policy Recommendations                                                                                           30

APPENDIXES
A       Formula for Calculation of Global Hunger Index Scores                                                            32
B       Data Sources for the Global Hunger Index Components, 1992, 2000, 2008, and 2017                                  33
C       Data Underlying the Calculation of the 1992, 2000, 2008, and 2017 Global Hunger Index Scores                     34
D       2017 Global Hunger Index Scores                                                                                  36
E       Country Trends for the 1992, 2000, 2008, and 2017 Global Hunger Index Scores                                     37

BIBLIOGRAPHY                                                                                                             41

PARTNERS                                                                                                                 46

4                                                                                        Contents | 2017 Global Hunger Index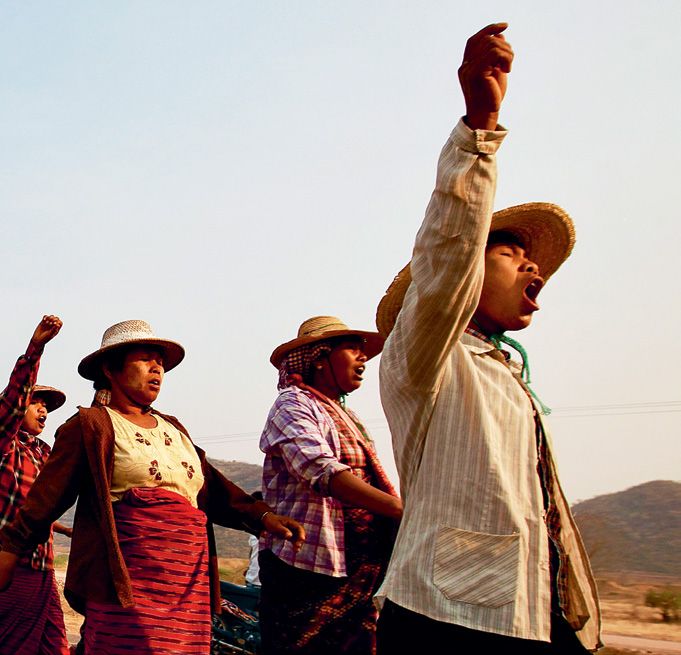
SUMMARY
The 2017 Global Hunger Index (GHI) shows long-term prog- National and Subnational Scores
ress in reducing hunger in the world. The advances have been
uneven, however, with millions of people still experiencing Eight countries suffer from extremely alarming or alarming levels
chronic hunger and many places suffering acute food crises of hunger. Except for Yemen, all are in Africa south of the Sahara:
and even famine. Central African Republic (CAR), Chad, Liberia, Madagascar, Sierra
According to 2017 GHI scores, the level of hunger in the Leone, Sudan, and Zambia. Many of these countries have experienced
world has decreased by 27 percent from the 2000 level. Of political crises or violent conflicts in the past several decades. CAR
the 119 countries assessed in this year’s report, one falls in the and Yemen, in particular, have been riven by war in recent years.
extremely alarming range on the GHI Severity Scale; 7 fall in the From the 2000 GHI to the 2017 GHI, the scores of 14 countries
alarming range; 44 in the serious range; and 24 in the moderate improved by 50 percent or more; those of 72 countries dropped by
range. Only 43 countries have scores in the low range. In addi- between 25 and 49.9 percent; and those of 27 countries fell by less
tion, 9 of the 13 countries that lack sufficient data for calculating than 25 percent. Only CAR, the sole country in the extremely alarm-
2017 GHI scores still raise significant concern, including Somalia, ing range, showed no progress.
South Sudan, and Syria. This year’s report provides a look at subnational-level data on
To capture the multidimensional nature of hunger, GHI scores are stunting, which reveal great disparities within countries. Differences
based on four component indicators—undernourishment, child wast- in hunger and nutrition profiles mean that, in most countries, a one-
ing, child stunting, and child mortality. The 27 percent improvement size-fits-all approach to tackling hunger and undernutrition is unlikely
noted above reflects progress in each of these indicators according to yield the best results. Region- or state-level data, together with other
to the latest data from 2012–2016 for countries in the GHI: information—for example, from focus group interviews—can serve as
a solid foundation for good program and policy design. Within coun-
>> The share of the overall population that is undernourished is tries in all regions of the world are wide variations in subnational-level
13.0 percent, down from 18.2 percent in 2000. rates of childhood stunting. Even in some countries with a low national
average, there are places where childhood stunting levels are high.
>> 27.8 percent of children under five are stunted, down from
37.7 percent in 2000.
Inequality, Power, and Hunger
>> 9.5 percent of children under five are wasted, down from In this year’s essay, Naomi Hossain, research fellow at the Institute
9.9 percent in 2000. of Development Studies, explores the nexus of inequality, power, and
hunger. Most often, it is the people or groups with the least social,
>> The under-five mortality rate is 4.7 percent, down from 8.2 percent economic, or political power—those who are discriminated against
in 2000. or disadvantaged, including women, ethnic minorities, indigenous
peoples, rural dwellers, and the poor—who suffer from hunger and
malnutrition. They are affected by food and agricultural policies, but
Regional Scores
have little voice in policy debates dominated by governments, corpo-
The regions of the world struggling most with hunger are South Asia rations, and international organizations. Analyzing the role that power
and Africa south of the Sahara, with scores in the serious range (30.9 plays in creating such inequalities in the food system and allowing
and 29.4, respectively). The scores of East and Southeast Asia, the space for all citizens—especially the least advantaged—to partic-
Near East and North Africa, Latin America and the Caribbean, and ipate in decision making will help address nutritional inequalities.
Eastern Europe and the Commonwealth of Independent States range The 2017 Global Hunger Index therefore presents recommen-
from low to moderate (between 7.8 and 12.8). These averages con- dations that aim to redress such power imbalances, as well as the
ceal some troubling results within each region, however, including laws, policies, attitudes, and practices that exacerbate and perpet-
scores in the serious range for Tajikistan, Guatemala, Haiti, and Iraq uate them, in order to alleviate hunger among the most vulnerable.
and in the alarming range for Yemen, as well as scores in the seri- National governments, the private sector, civil society, and interna-
ous range for half of all countries in East and Southeast Asia, whose tional organizations must all act now to reduce inequalities if Zero
average benefits from China’s low score of 7.5. Hunger is to be reached by 2030.
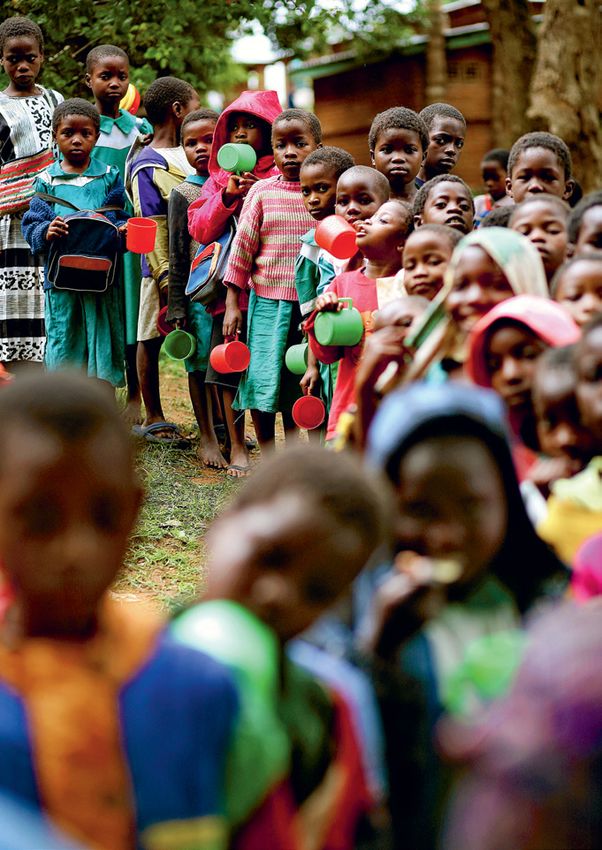
2017 Global Hunger Index | Summary501 Children queuing for porridge at a primary school in Blantyre, Malawi. The right nutrition during the first 1,000 days of a child’s life will improve her or his physical and cognitive development and ability to learn in the future.
THE CONCEPT OF THE
GLOBAL HUNGER INDEX

T
     he Global Hunger Index (GHI) is a tool designed to compre-
     hensively measure and track hunger at the global, regional,                  Box 1.1      CONCEPTS OF HUNGER
     and national levels.1 The International Food Policy Research
Institute (IFPRI) calculates GHI scores each year to assess progress              The problem of hunger is complex. Thus there are different
and setbacks in combating hunger. The GHI is designed to raise                    terms to describe its different forms.
awareness and understanding of the struggle against hunger, pro-                       Hunger is usually understood to refer to the distress
vide a means to compare the levels of hunger between countries and                associated with lack of sufficient calories. The Food and
regions, and call attention to the areas of the world in greatest need            Agriculture Organization of the United Nations (FAO) defines
of additional resources to eliminate hunger.                                      food deprivation, or undernourishment, as the consump-
   To capture the multidimensional nature of hunger, GHI scores are               tion of too few calories to provide the minimum amount of
based on four indicators:                                                         dietary energy that each individual requires to live a healthy
                                                                                  and productive life, given his or her sex, age, stature, and
1. UNDERNOURISHMENT: the share of the population that is under-                   physical activity level.*
   nourished (that is, whose caloric intake is insufficient);                          Undernutrition goes beyond calories and signifies defi-
                                                                                  ciencies in any or all of the following: energy, protein, or
2. CHILD WASTING: the share of children under the age of five who                 essential vitamins and minerals. Undernutrition is the result
   are wasted (that is, who have low weight for their height, reflect-            of inadequate intake of food in terms of either quantity or
   ing acute undernutrition);                                                     quality, poor utilization of nutrients due to infections or
                                                                                  other illnesses, or a combination of these factors. These
3. CHILD STUNTING: the share of children under the age of five who                in turn are caused by a range of factors including house-
   are stunted (that is, who have low height for their age, reflecting            hold food insecurity; inadequate maternal health or child-
   chronic undernutrition); and                                                   care practices; or inadequate access to health services,
                                                                                  safe water, and sanitation.
4. CHILD MORTALITY: the mortality rate of children under the age of                    Malnutrition refers more broadly to both undernutrition
   five (in part, a reflection of the fatal mix of inadequate nutrition           (problems of deficiencies) and overnutrition (problems of
   and unhealthy environments).2                                                  unbalanced diets, such as consuming too many calories
                                                                                  in relation to requirements with or without low intake of
   There are several advantages to measuring hunger using this                    micronutrient-rich foods).
combination of factors (Figure 1.1). The indicators included in the                    In this report, “hunger” refers to the index based on the
GHI formula reflect caloric deficiencies as well as poor nutrition.               four component indicators. Taken together, the component
By including indicators specific to children, the index captures the              indicators reflect deficiencies in calories as well as in micro-
nutrition situation not only of the population as a whole, but also               nutrients. Thus, the GHI reflects both aspects of hunger.
of children—a particularly vulnerable subset of the population for                Source: Authors.
whom a lack of dietary energy, protein, or micronutrients (essential              * In estimating the prevalence of undernourishment, FAO considers the compo-
vitamins and minerals) leads to a high risk of illness, poor physical               sition of a population by age and sex, taking into account the range of physi-
                                                                                    cal activity levels of the population and the range of healthy body masses for
and cognitive development, and death. The inclusion of both child                   attained height to calculate its average minimum energy requirement (FAO/
                                                                                    IFAD/WFP 2015). This requirement varies by country—from about 1,650 to
wasting and child stunting allows the GHI to capture both acute and                 more than 2,000 kilocalories (food calories) per person per day for developing
chronic undernutrition. By combining multiple indicators, the index                 countries in 2016 (FAO 2017b).

minimizes the effects of random measurement errors.
   GHI scores are calculated using the process described in Box 1.2,
and the complete formula is shown in Appendix A. The current for-               The 2017 GHI has been calculated for the 119 countries for which
mula was introduced in 2015 and is a revision of the original for-        data on all four component indicators are available and measuring
mula that was used to calculate GHI scores from 2006 to 2014. The         hunger is considered most relevant. GHI scores are not calculated
primary differences are that child stunting and child wasting have        1
                                                                              For further background on the GHI concept, see Wiesmann (2006a).
replaced child underweight, and the four indicator values are now         2
                                                                              According to recent estimates, undernutrition is responsible for 45 percent of deaths among
standardized (Wiesmann et al. 2015).                                          children younger than five years old (Black et al. 2013).

2017 Global Hunger Index | Chapter 01 | The Concept of the Global Hunger Index7
Figure 1.1 COMPOSITION OF THE GLOBAL HUNGER INDEX
1/3 CH
Y
P PL UN IL
DE
T
D
SU
N > Measures > Death is the most
R
M
E
-F
OD
M
inadequate food serious consequence
OR
IV
SH
supply, an important of hunger, and children
E
FO
TA
RI
indicator of hunger are the most vulnerable
MO
OU
LIT
> Refers to the entire > Improves the GHI’s ability to
TE
RT
ERN
population, both children reflect micronutrient
ALI
INADEQUA
Y 1/3
and adults deficiencies
UND
TY R
> Used as a lead > Wasting and stunting
indicator for only partially capture
GHI
ATE
international the mortality risk of
hunger targets, COMPOSITION undernutrition
including the
SDGs 3 dimensions
4 indicators
> Goes beyond calorie availability,
considers aspects of diet quality and utilization
> Children are particulary vulnerable to nutritional deficiencies
> Is sensitive to uneven distribution of food within
the household
W > Stunting and wasting are nutrition
6
AS indicators for the SDGs 1/
TI
NG I NG
1/6 NT
STU
CH /3
ILD N 1
UNDER O
NUTRITI
Source: Wiesmann et al. (2015).
Note: The values of each of the four component indicators are standardized. See Appendix A for the complete GHI formula. SDGs = Sustainable Development Goals. The source for undernourish-
ment data is the Food and Agriculture Organization of the United Nations (FAO); the source for child mortality data is the United Nations Inter-agency Group for Child Mortality Estimation (UN
IGME); and the primary sources for the child undernutrition data are the World Health Organization (WHO), World Bank, and UNICEF.
for some high-income countries where the prevalence of hunger is Congo, Eritrea, Libya, Papua New Guinea, Somalia, South Sudan,
very low. Even within certain high-income countries, however, hunger and Syria. All available indicator values for these countries appear
and undernutrition are serious concerns for segments of the popu- in Appendix C. Additionally, Box 2.1 of Chapter 2 explores the food
lation. Unfortunately, nationally representative data for three of the and nutrition security situation of those countries without GHI scores
four GHI indicators—undernourishment, child stunting, and child where hunger is cause for significant concern.
wasting—are not regularly collected in most high-income countries. GHI scores are based on current and historical data that are con-
While data on the fourth GHI indicator, child mortality, are usually tinuously being revised and improved by the United Nations (UN)
available for these countries, child mortality does not reflect under- agencies that compile them. Each year’s GHI report reflects these
nutrition in the high-income countries to the same extent as it does changes. As a result, GHI scores from different years’ reports are
in low- and middle-income countries. For these reasons, GHI scores not directly comparable with one another. This report contains GHI
are not calculated for most high-income countries. In addition, GHI scores for 2017 and three reference years—1992, 2000, and 2008.
scores are not calculated for certain countries with small populations, To track the progress of a country or region over time, the 1992,
nor for certain nonindependent entities or territories. 2000, 2008, and 2017 scores within this report can be compared.
The GHI is only as current as the data for the four component The GHI scores presented here reflect the latest revised data
indicators. This year’s GHI includes the most recent country-level for the four component indicators.3 Where original source data were
data from 2012 through 2016. Thus the 2017 GHI scores reflect unavailable, estimates for the GHI component indicators were based
hunger and undernutrition levels during this period rather than in on the most recent available data. (Appendix B provides more detailed
the year 2017.
Because data for all four indicators in the GHI formula are not
3
For previous GHI calculations, see von Grebmer et al. (2016, 2015, 2014, 2013, 2012,
available for every country, GHI scores could not be calculated for
2011, 2010, 2009, 2008); IFPRI/WHH/Concern (2007); Wiesmann (2006a, 2006b); and
some, including Burundi, the Comoros, the Democratic Republic of Wiesmann, Weingärtner, and Schöninger (2006).
8 The Concept of the Global Hunger Index | Chapter 01 | 2017 Global Hunger IndexBox 1.2 OVERVIEW OF GHI CALCULATION
GHI scores are calculated using a three-step process. This calculation results in GHI scores on a 100-point scale,
First, values for each of the four component indicators are where 0 is the best score (no hunger) and 100 is the worst.
determined from the available data for each country. The four In practice, neither of these extremes is reached. A value of 0
indicators are undernourishment, child wasting, child stunting, would mean that a country had no undernourished people in the
and child mortality. population, no children younger than five who were wasted or
Second, each of the four component indicators is given a stunted, and no children who died before their fifth birthday. A
standardized score on a 100-point scale, based on the highest value of 100 would signify that a country’s undernourishment,
observed level for the indicator globally. child wasting, child stunting, and child mortality levels were
Third, standardized scores are aggregated to calculate the each at approximately the highest levels observed worldwide in
GHI score for each country, with each of the three dimensions recent decades. (Appendix A provides a detailed guide to cal-
(inadequate food supply, child mortality, and child undernu- culating and interpreting GHI scores.)
trition, which is composed equally of child stunting and child The scale below shows the severity of hunger—from low to
wasting) given equal weight. extremely alarming—associated with the range of possible GHI scores.
GHI Severity Scale
≤ 9.9 10.0–19.9 20.0–34.9 35.0–49.9 50.0 ≤
low moderate serious alarming extremely alarming
0 10 20 35 50
Source: Authors.
background information on the data sources for the 1992, 2000, UNICEF 2017; UNICEF 2013; UNICEF 2009; MEASURE DHS 2017;
2008, and 2017 GHI scores.) authors’ estimates).
The four component indicators used to calculate the GHI scores
in this report draw upon data from the following sources: CHILD MORTALITY: Updated data from the United Nations Inter-agency
Group for Child Mortality Estimation (UN IGME) were used for the
UNDERNOURISHMENT: Data from the Food and Agriculture Organization 1992, 2000, 2008, and 2017 GHI scores. For the 2017 GHI, data
of the United Nations (FAO) were used for the 1992, 2000, 2008, on child mortality are from 2015 (UN IGME 2015).
and 2017 GHI scores. Undernourishment data for the 2017 GHI are
for 2014–2016 (FAO 2017b; authors’ estimates). The GHI incorporates the most up-to-date data available. Yet time
lags and data gaps persist in reporting vital statistics on hunger and
CHILD WASTING AND CHILD STUNTING: Data on the child undernutrition undernutrition. The United Nations’ Sustainable Development Agenda
indicators—child wasting and child stunting—are drawn from the acknowledges the need for more reliable and extensive country data
joint database of UNICEF, the World Health Organization (WHO), and on hunger and nutrition, and we applaud the efforts to improve the
the World Bank, as well as from the WHO’s continuously updated breadth and depth of available data. We encourage further improve-
Global Database on Child Growth and Malnutrition, the most recent ments in collecting high-quality data on hunger and undernutrition,
reports of the Demographic and Health Surveys (DHS) and Multiple which will allow for a more complete and current assessment of the
Indicator Cluster Surveys (MICS), and statistical tables from UNICEF. state of global hunger, a better understanding of the relationship
For the 2017 GHI scores, data on child wasting and child stunt- between hunger and nutrition initiatives and their effects, and more
ing are from the latest year for which data are available in the effective coordination among efforts to end global hunger and mal-
period 2012–2016 (UNICEF/WHO/World Bank 2017; WHO 2017; nutrition in all its forms.
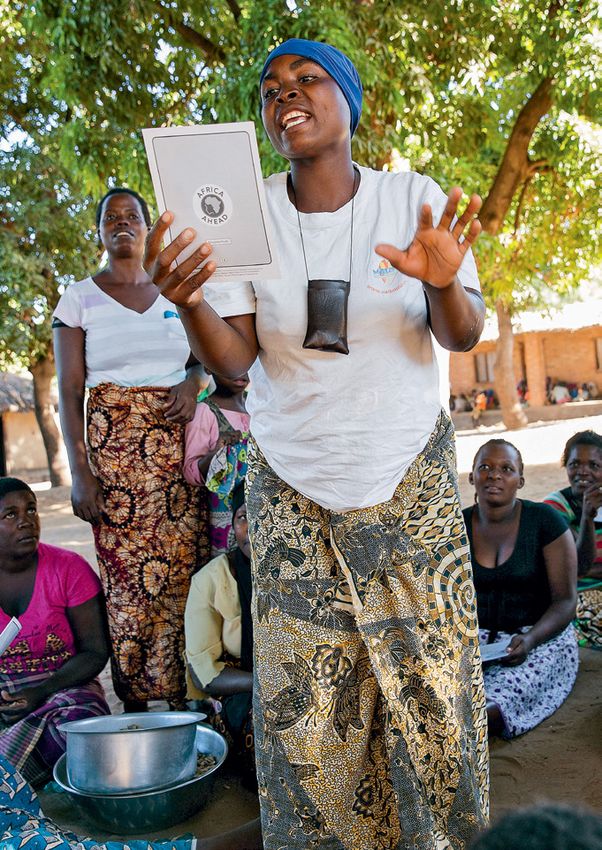
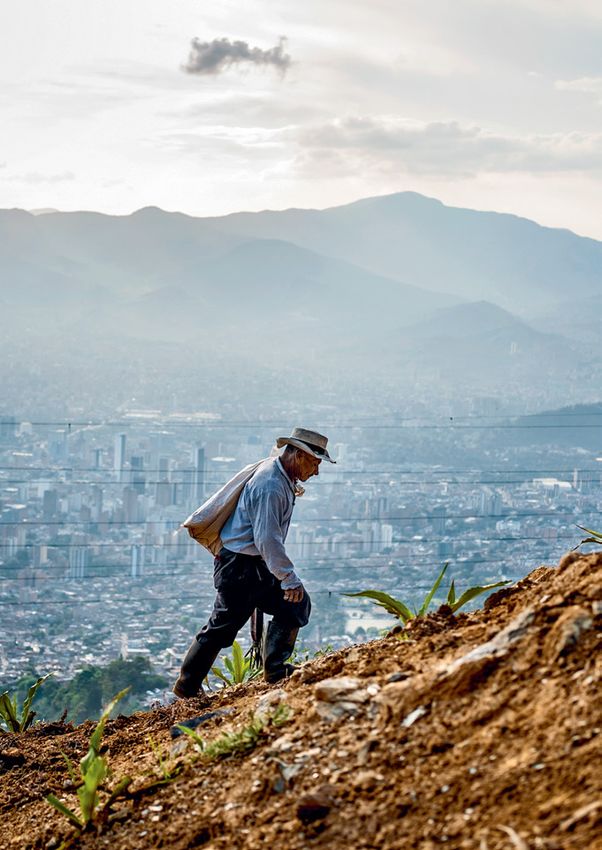
2017 Global Hunger Index | Chapter 01 | The Concept of the Global Hunger Index902 A farmer walks up a hillside close to Medellín, Colombia. The country has the world’s largest population of internally displaced people, many of whom are farmers and indigenous people. Both geography and ethnicity can impact a person’s nutritional status.
GLOBAL, REGIONAL, AND
NATIONAL TRENDS
T
he 2017 Global Hunger Index (GHI) indicates that worldwide organizations from reaching people in need. In Somalia—which has
levels of hunger and undernutrition have declined over the long suffered years of war and multiple insurgencies, and until recently was
term: At 21.8 on a scale of 100, the average GHI score for 2017 deemed a failed state—an ongoing drought sparked the initial crisis
is 27 percent lower than the 2000 score (29.9) (Figure 2.1).1 This (Economist 2017; UN 2017). In March 2017, the UN Undersecretary-
improvement reflects the reductions since 2000 in each of the four General for Humanitarian Affairs declared the situation the worst
GHI indicators—the prevalence of undernourishment, child stunt- humanitarian crisis the world has faced since World War II (UN 2017).
ing (low height-for-age), child wasting (low weight-for-height), and It is against this backdrop that we explore the state of hunger in
2
child mortality. In the countries included in the GHI, the share of the world. The following sections report on hunger and undernutrition
the population that is undernourished is down from 18.2 percent in at the regional, national, and subnational levels, and provide insight
1999–2001 to 13.0 percent as of 2014–2016. Of children under five, into how and why these have changed over time.
27.8 percent are stunted, down from the 2000 rate of 37.7 percent,
and 9.5 percent are wasted, down slightly from 9.9 percent in 2000.
Regional Variations
Finally, the under-five mortality rate dropped from 8.2 percent in
2000 to 4.7 percent in 2015.3 At the regional level, South Asia and Africa south of the Sahara have
Despite these improvements, a number of factors, including the highest 2017 GHI scores—30.9 and 29.4, respectively, indicating
deep and persistent inequalities, undermine efforts to end hunger serious levels of hunger (Figure 2.1). The GHI scores, and therefore
and undernutrition worldwide. As a result, even as the average global the hunger levels, for East and Southeast Asia, the Near East and
hunger level has declined, certain regions of the world still struggle North Africa, Latin America and the Caribbean, and Eastern Europe
with hunger more than others, disadvantaged populations experience 1
The regional and global aggregates for each component indicator are calculated as popu-
hunger more acutely than their better-off neighbors, and isolated and lation-weighted averages, using the indicator values reported in Appendix C. For countries
lacking undernourishment data, provisional estimates provided by the Food and Agriculture
war-torn areas are ravaged by famine. Organization of the United Nations (FAO) were used in the calculation of the global and
In early 2017, the United Nations declared that more than regional aggregates only, but are not reported in Appendix C. The regional and global GHI
scores are calculated using the regional and global aggregates for each indicator and the
20 million people were at risk of famine in four countries: Nigeria, formula described in Appendix A.
2
Somalia, South Sudan, and Yemen. These crises are largely “man- The estimates in this paragraph refer to the countries for which GHI data were available.
These estimates can vary slightly from those published by other organizations for the same
made,” the result of violent conflict and internal strife that are pre- indicators due to the inclusion of different countries.
3
venting people from accessing food and clean water and keeping aid Black et al. (2013) estimate that undernutrition causes almost half of all child deaths globally.
Figure 2.1 GLOBAL AND REGIONAL 1992, 2000, 2008, AND 2017 GLOBAL HUNGER INDEX SCORES, WITH CONTRIBUTION OF COMPONENTS
60
Under-five mortality rate
48.3
46.3
50
43.5
Prevalence of wasting in children
38.2
40 Prevalence of stunting in children
35.2
34.9
34.8
Proportion of undernourished
30.9
GHI score
29.9
29.4
28.9
25.7
30
21.8
20.5
19.3
17.1
16.7
16.6
20
14.4
14.4
13.6
12.8
12.6
9.7
9.3
8.4
7.8
10
0
'92 '00 '08 '17 '92 '00 '08 '17 '92 '00 '08 '17 '92 '00 '08 '17 '92 '00 '08 '17 '92 '00 '08 '17 '92 '00 '08 '17
World South Asia Africa south Near East & East & Latin America Eastern Europe &
of the Sahara North Africa Southeast Asia & Caribbean Commonwealth
of Independent
States
Source: Authors.
Note: See Appendix B for data sources. A 1992 regional score for Eastern Europe and the Commonwealth of Independent States was not calculated because many countries in this region did not
exist in their present borders.
2017 Global Hunger Index | Chapter 02 | Global, Regional, and National Trends11and the Commonwealth of Independent States are considered low this stagnation (FAO/IFAD/WFP 2015). Economic growth (particularly
or moderate, ranging from 7.8 to 12.8 points. Within each region in in certain sectors of the economy such as agriculture) and invest-
the low range, however, are also countries with serious or alarming ment (especially in public services such as health and education)
GHI scores, including Tajikistan in Central Asia, which is part of the have helped some countries in the region to reduce their undernour-
Commonwealth of Independent States; Guatemala and Haiti in Latin ishment levels (Soriano and Garrido 2016). Countries such as Angola,
America and the Caribbean; and Iraq and Yemen in the Near East Gabon, and Mali have experienced substantial reductions in under-
and North Africa region. Seven of 14 countries in East and Southeast nourishment rates in recent years, achieving rates under 15 percent
Asia have serious scores, though the low score of highly populous as of 2014–2016 (FAO 2017b). A common feature among these and
China improves the regional average. other countries in the region that have lowered their undernourish-
In the regions with the most hunger, South Asia and Africa south ment rates is relatively rapid improvement in agricultural productiv-
of the Sahara, different indicators drive the high GHI scores. In South ity (FAO/IFAD/WFP 2015).
Asia, child undernutrition, as measured by child stunting and child Although progress on certain indicators has stalled in some places,
wasting, is higher than in Africa south of the Sahara. Meanwhile, there has been a steady decline in hunger levels for each region cov-
Africa south of the Sahara has a higher child mortality rate and strug- ered in this report (Figure 2.1). Between the 2000 and 2017 scores,
gles more with undernourishment, reflecting overall calorie deficiency Eastern Europe and the Commonwealth of Independent States saw
for the population. the greatest improvement when measured by the percentage change,
Given that three-quarters of South Asia’s population resides in though not in absolute terms. During the same period, Africa south
India, the situation in that country strongly influences South Asia’s of the Sahara, which had the highest regional score in 2000, experi-
regional score. At 31.4, India’s 2017 GHI score is at the high end enced the greatest decline in absolute GHI values—a 14-point drop.
of the serious category. According to 2015–2016 survey data, more Looking all the way back to 1992, however, Africa south of the Sahara
than a fifth (21 percent) of children in India suffer from wasting. and South Asia have made comparable progress; according to their
Only three other countries in this year’s GHI—Djibouti, Sri Lanka, GHI scores, hunger levels for these regions were remarkably close in
and South Sudan—have data or estimates showing child wast- 1992 and again in the most recent reference period.
ing above 20 percent in the latest period (2012–2016). Further,
India’s child wasting rate has not substantially improved over the
Country-Level Results
past 25 years (see Appendix C). But the country has made prog-
ress in other areas: Its child stunting rate, while still relatively high The numerical ranking, ordered from lowest to highest hunger levels,
at 38.4 percent, has decreased in each of the reference periods in for each country included in the GHI is shown in Table 2.1, along with
this report, down from 61.9 percent in 1992. According to Menon each country’s 1992, 2000, 2008, and 2017 GHI scores. Appendix
et al. (2017), India has implemented a “massive scale-up” of two C shows the values of the GHI indicators—the prevalence of under-
national programs that address nutrition—the Integrated Child nourishment, child wasting, child stunting, and child mortality—for
Development Services and the National Health Mission—but these each country, including their historic values. The individual indicators
have yet to achieve adequate coverage. Areas of concern include are particularly important because the nature of hunger and under-
(1) the timely introduction of complementary foods for young chil- nutrition—and therefore the right mix of policies and interventions to
dren (that is, the transition away from exclusive breastfeeding), address them—varies from country to country. Appendix D shows the
which declined from 52.7 percent to 42.7 percent between 2006 1992, 2000, 2008, and 2017 GHI scores for each country, alpha-
and 2016; (2) the share of children between 6 and 23 months old betized by country name.
who receive an adequate diet—a mere 9.6 percent for the country; The 2017 GHI shows that seven countries suffer from levels
and (3) household access to improved sanitation facilities—a likely of hunger that are alarming, and one country, the Central African
factor in child health and nutrition—which stood at 48.4 percent Republic (CAR), suffers from a level that is extremely alarming. Seven
as of 2016 (Menon et al. 2017). of these eight countries are in Africa south of the Sahara: CAR, Chad,
In Africa south of the Sahara, meanwhile, undernourishment Liberia, Madagascar, Sierra Leone, Sudan, and Zambia. The excep-
remains stubbornly high, staying virtually the same in 2014–2016 tion is Yemen, located at the tip of the Arabian Peninsula.
(at 21.6 percent) as in 2007–2009 (at 22.0 percent), and currently As in years past, GHI scores for several countries could not be
constituting the highest regional undernourishment rate in the world. calculated because data were not available for all four GHI indicators.
Rising food prices, droughts, and political instability contributed to Nevertheless, the hunger and undernutrition situations in many of
12 Global, Regional, and National Trends | Chapter 02 | 2017 Global Hunger IndexTable 2.1 GLOBAL HUNGER INDEX SCORES BY RANK, 1992 GHI, 2000 GHI, 2008 GHI, AND 2017 GHI
1 1
Rank Country 1992 2000 2008 2017 Rank Country 1992 2000 2008 2017
Belarus —Figure 2.2 COUNTRY PROGRESS IN REDUCING GHI SCORES
Percentage change in 2017 GHI compared with 2000 GHI
Greenland
Iceland Finland Russian Federation
Sweden
Canada Norway
Estonia
United Latvia
Kingdom Denmark Lithuania
Neth. Poland Belarus
Ireland Germany
Bel. Czech Rep. Ukraine
Lux. Kazakhstan Mongolia
Austria Slovakia
Switz. Slov. Hungary Moldova
France Croatia Romania
Bos. & Herz. Serbia Uzbekistan N. Korea
Italy Mont. Bulgaria Georgia Kyrgyz Rep.
United States Spain Japan
Albania Mace. Armenia Azerb. S. Korea
of America Portugal Turkey Turkmenistan Tajikistan China
Greece
Cyprus Syria
Tunisia Lebanon Iraq Afghanistan
Morocco Iran
Israel
Jordan Kuwait Pakistan Nepal Bhutan
Algeria
Libya Egypt Bahrain
Mexico Saudi Qatar Bangladesh Taiwan
Cuba Western Sahara Arabia U.A.E India Hong Kong
Myanmar Lao
Jamaica Mauritania Oman
Dominican Rep. PDR
Belize Haiti Mali Niger Philippines
Guatemala Honduras Senegal Chad Sudan Eritrea Yemen Thailand
El Salvador Nicaragua Gambia Cambodia
Trinidad & Tobago Guinea-Bissau GuineaBurkina Faso Djibouti
Viet Nam
Costa Rica Panama Benin Nigeria
Venezuela Guyana Sierra Leone CôteGhana Central Ethiopia Sri Lanka
Suriname d'Ivoire Togo African South
French Guiana Liberia Republic Sudan Somalia Brunei
Colombia Cameroon Malaysia
Equatorial Guinea Congo, Uganda Singapore
Kenya Indonesia Papua
Ecuador GabonRep. Congo, Rwanda New
Dem. Burundi
Guinea
Rep.
Tanzania
Peru
Brazil Comoros Timor-Leste
Angola
Zambia Malawi
Bolivia Mozambique
Zimbabwe Mauritius
Namibia
Botswana Madagascar Fiji
Paraguay
Chile Swaziland
Increase Australia
Lesotho
South
Uruguay Africa Decrease by 0.0–24.9%
Decrease by 25.0–49.9%
Argentina
Decrease by 50% or more
Source: Authors.
Countries with 2000 and 2017
Note: An increase in the GHI indicates a worsening of a GHI of less than 5
country’s hunger situation. A decrease in the GHI indicates New Zealand
Insufficient data
an improvement in a country’s hunger situation. GHI
scores were not calculated for countries with very small Not calculated*
populations. *See Chapter 1 for details
these countries are cause for significant concern (Box 2.1). Notably, (out of a total population of roughly 180 million) in the northeast of
two of the four countries currently facing famine are among those the country are experiencing or are at risk of famine, mainly due to
not included in the GHI, yet their populations are indisputably facing ongoing violence spread by Boko Haram (VOA 2017; UNDP 2017a).
extremely alarming hunger. For South Sudan and Somalia, there are The remainder of the country faces minimal food-security concerns
insufficient data to calculate GHI scores, yet other data and systems (FEWS NET 2017c) and uneven levels of child undernutrition (NBS
designed to detect acute food-security crises, such as the Famine 2015). In Yemen, the crisis is also fueled by violent conflict, but is
Early Warning System (FEWS NET), make clear that their hunger lev- more evenly spread throughout the country, with 17 million people
els are extreme (FEWS NET 2017d; FEWS NET 2017b). (about 65 percent of the population) facing food insecurity (UNDP
The GHI scores of the other two famine-threatened countries, 2017a; FEWS NET 2017a). Timing, meanwhile, factors into all the
Nigeria and Yemen, fall in the serious and alarming categories, respec- scores: GHI scores are based on the most up-to-date data avail-
tively. They do not fall into the extremely alarming category for two able for the GHI indicators. In the case of the 2017 scores, data
key reasons: inequality (the theme of this year’s report) and timing. are included from the most recent reference period (2012–2016)
Inequality plays a greater role in Nigeria, where 4.5 million people and therefore reflect hunger and undernutrition in this period. The
14 Global, Regional, and National Trends | Chapter 02 | 2017 Global Hunger IndexFigure 2.3 HOW SERIOUS, ALARMING, AND EXTREMELY ALARMING COUNTRIES HAVE FARED SINCE 2000
GHI Severity Scale
extremely
moderate serious alarming
alarming
60
Higher
reduction
in hunger
50 Cambodia
Myanmar
Kenya Rwanda
Cameroon Lao PDR Angola
Percent reduction in GHI score since 2000
Togo Ethiopia
Burkina Faso
40 Nepal
Malawi Mozambique
Nigeria
Afghanistan
Mali
Benin Guinea
Niger
Tanzania
Djibouti
Bangladesh Tajikistan
30 North Korea
Swaziland Guinea-Bissau Sierra Leone
Lesotho Republic of Congo
Botswana Liberia Zambia
Guatemala Mauritania
Philippines
20 Uganda Haiti
Côte d'Ivoire
Gambia Namibia India Zimbabwe Yemen Chad
Indonesia Pakistan
Iraq
Madagascar
10
Lower
reduction in
Sri Lanka hunger
Central African Republic
0
15 20 25 30 35 40 45 50 55
2017 Global Hunger Index score
Source: Authors.
Note: This figure features countries where data were available to calculate 2000 and 2017 GHI scores and where 2017 GHI scores were equal to or greater than 20, reflecting serious, alarming,
or extremely alarming hunger levels. Some likely poor performers may not appear due to missing data.
extent of the current crises will therefore be reflected in future GHI report. The country’s child stunting and child wasting estimates are
indicators and scores. also high and cause for concern.
The Central African Republic, which has the highest 2017 GHI Despite these troubling cases, there is cause for optimism. Of
score, has suffered from instability, sectarian violence, and civil 119 countries, 43 have low 2017 GHI scores (under 10). Roughly half
war since 2012. Livelihoods have been lost, markets disrupted, and of these are in Eastern Europe and the Commonwealth of Independent
food security weakened (USAID 2017a). As of May 2017, there were States. The rest are in Latin America and the Caribbean, the Near
500,000 internally displaced persons in this country of just 5 million East and North Africa, and East and Southeast Asia. From the
people. Underlying CAR’s high GHI score are its very high under- 2000 GHI to the 2017 GHI, the scores of 14 countries improved
nourishment value of 58.6 percent, the highest in this year’s report, by 50 percent or more; those of 72 countries dropped by between
and its child mortality rate of 13 percent, the fourth highest in the 25 and 49.9 percent; and those of 27 countries fell by less than
2017 Global Hunger Index | Chapter 02 | Global, Regional, and National Trends1525 percent (Figure 2.2). Only CAR showed no progress; its 2017 and increased household assets (a proxy for household wealth), increased
2000 GHI scores are the same. maternal education levels, improved sanitation levels, and imple-
Just as overall GHI scores vary considerably, so do the component mentation and utilization of health and nutrition programs, includ-
indicators. In terms of undernourishment, Zambia, Haiti, and CAR ing antenatal and neonatal care (Headey and Hoddinott 2015). Yet
have the highest shares of undernourished people: between 45.9 and despite Nepal’s progress there are still deep inequalities within the
58.6 percent of their populations cannot meet their minimum calorie country, discussed in more detail in the subnational section below.
needs. Stunting, meanwhile, is most prevalent in Timor-Leste, Eritrea, Angola, Ethiopia, and Rwanda, all of which experienced violent
and Burundi, each with levels at or exceeding 50 percent. Wasting is conflicts in recent decades, had 2000 GHI scores in the extremely
most prevalent in Sri Lanka, Djibouti, and South Sudan, where 21.4 alarming category. The 2017 scores of each, however, are 42 to
to 27.3 percent of children under age five are affected. Finally, the 44 percent lower, placing them in the serious category. These coun-
under-five mortality rate is highest in Angola (15.7 percent), Chad tries still have major challenges to overcome. All have stunting lev-
(13.9 percent), and Somalia (13.7 percent). els between 37 and 38 percent, and Angola’s child mortality rate
According to the 2017 GHI, 52 countries have scores of 20 or (15.7 percent) is the highest in this year’s report. Yet they have
higher, and thus still suffer from at least serious levels of hunger. already come back from the highest levels of hunger and under-
Figure 2.3 shows how these countries have fared since 2000. The nutrition, providing hope for countries currently in the throes of vio-
countries in the lower right of the figure, including CAR, Chad, and lent conflict, massive food insecurity, and even famine.
Madagascar, have high GHI scores and low rates of hunger reduction The situation in Ethiopia, which experienced multiple civil wars
since 2000. The countries near the top of the figure have seen sizable and extreme famines between 1974 and 1991 (de Waal 1991), has
reductions in hunger, and those in the upper left, such as Cambodia, substantially improved, but remains tenuous. Most of the popula-
Myanmar, Kenya, Cameroon, Togo, and Nepal, have experienced rel- tion is engaged in rainfed agriculture (Asmamaw 2017) and there-
atively rapid improvements and are nearing the moderate category. fore vulnerable to food insecurity due to inconsistent rainfall (USAID
Kenya’s score has dropped by 44 percent since 2000, moving 2017c). This year, the drought in East Africa is severely impacting
the country from the alarming to the serious category, verging on crops and livestock in Ethiopia, putting millions in need of humani-
moderate. Underlying this progress is improvement in each of the tarian assistance (FAO GIEWS 2017b). In 2005, Ethiopia’s govern-
GHI indicators. Kenya has experienced steady economic growth in ment established the Productive Safety Net Programme (PSNP), a
recent years (WFP 2017a), and has worked to improve food security large-scale program to prevent future food crises. It includes pub-
and nutrition. In 2012, Kenya’s government put in place a National lic-works projects and cash or food transfers for households that are
Nutrition Action Plan (NNAP), complemented by investments in unable to participate in the public-works component. Some partici-
agriculture, disaster-resilience, food-fortification, and other related pants also receive agricultural support through a complementary pro-
initiatives (Dayton Eberwein et al. 2016). Kenya has yet to reach its gram (Gilligan et al. 2009). Research has shown that a combination
nutrition targets, and some localities are lagging behind and face of PSNP assistance and provision of agricultural support services
more serious hunger and nutrition challenges. The drought affect- improves households’ food security (Gilligan et al. 2009), and that
ing East Africa this year has created additional food-security chal- PSNP reduces child undernutrition (Debela et al. 2009). The gov-
lenges for large parts of the country, with harvests, livestock, and ernment has put in place other initiatives to support food security
food prices negatively affected (FAO GIEWS 2017b). Aside from the and nutrition, and has committed to ending child undernutrition by
immediate drought-related needs, Dayton Eberwein et al. (2016) esti- 2030. The country still needs to increase agricultural research and
mate that a full range of nutrition interventions with national cover- development; improve coordination between sectors such as nutri-
age would require an investment of US$213 million over five years, tion, agriculture, and health; and expand coverage of targeted nutri-
while a slightly scaled-down package for the areas in greatest need tion programs (Compact2025 2016).
would require $135 million.
Nepal’s GHI score was also in the alarming category in 2000,
Subnational Hunger and Undernutrition
but is now in the serious category, verging on moderate. Nepal has
experienced declines in undernourishment, child stunting, and child An examination of subnational-level data reveals wide disparities
mortality, while its child wasting rate has remained unchanged. within countries. These differences in hunger and nutrition pro-
According to one study, Nepal’s remarkable reduction in child stunting files mean that, in most countries, a one-size-fits-all approach
between 2001 and 2011 is associated with, and likely attributable to, to tackling hunger and undernutrition is unlikely to yield the best
16 Global, Regional, and National Trends | Chapter 02 | 2017 Global Hunger IndexFigure 2.4 SUBNATIONAL INEQUALITY OF CHILD STUNTING
Serbia (4)
Moldova (4)
Dominican Republic (9) Stunting rate, lowest region
Jordan (12)
Kazakhstan (16) Stunting rate, national average
Bosnia & Herzegovina (3)
Montenegro (3) Stunting rate, highest region
Armenia (11)
Turkey (12)
Tunisia (9)
Thailand (5)
Mongolia (5)
Turkmenistan (6)
Algeria (7)
Guyana (9)
Mexico (5)
Kyrgyz Republic (9)
Sri Lanka (25)
El Salvador (5)
Gabon (10)
Azerbaijan (9)
Ghana (10)
Senegal (4)
Egypt (4)
Haiti (11)
Honduras (18)
Mauritania (11)
Namibia (13)
Gambia (8)
Swaziland (4)
Kenya (8)
Tajikistan (5)
Zimbabwe (10)
Togo (6)
Guinea-Bissau (9)
North Korea (10)
Myanmar (15)
Côte d'Ivoire (11)
Comoros (3)
Philippines (17)
Guinea (8)
Liberia (15)
Cameroon (12)
Cambodia (19)
Nigeria (37)
Lesotho (10)
Benin (12)
Tanzania (30)
Bangladesh (7)
Malawi (3)
Nepal (15)
Angola (18)
Rwanda (5)
Sierra Leone (14)
Sudan (18)
Ethiopia (11)
India (34)
Chad (21)
Zambia (10)
Afghanistan (34)
Congo, Dem. Rep. (11)
Niger (8)
Lao PDR (17)
Pakistan (5)
Guatemala (22)
Yemen (21)
Timor-Leste (13)
0 10 20 30 40 50 60 70 80
Child stunting rate (under age five)
Source: Authors. Based on surveys listed in UNICEF/WHO/World Bank (2017) and WHO (2017), from 2012–2016. Countries included are those with subnational stunting data available for
2012–2016.
Note: The number in parentheses following each country name indicates the number of subnational units into which the country was divided for the sake of the survey. All stunting values in
this figure are taken directly from original survey reports. The national averages may vary slightly from those used for GHI calculations, which in some cases underwent additional analysis before
inclusion in UNICEF/WHO/World Bank 2017.
2017 Global Hunger Index | Chapter 02 | Global, Regional, and National Trends17Box 2.1 COUNTRIES WITH INSUFFICIENT DATA, YET SIGNIFICANT CONCERNS
GHI scores for 2017 could not be calculated for 13 countries (1993–2005) contributed to Burundi’s poor food security and
because data on the prevalence of undernourishment and, in nutrition situation (Verwimp 2012; WFPUSA 2015). Mercier
some cases, data or estimates on child stunting and child wast- et al. (2016) show that household exposure to violence during
ing were unavailable. Yet the countries with missing data may Burundi’s civil war still contributed to decreased household
be the ones suffering most. Therefore, we still review the hun- welfare in 2012 and predicted that the effects would per-
ger and undernutrition situations in such places. To monitor and sist through at least 2017. Due to political unrest beginning
evaluate progress, it is essential that the national governments in 2015, hundreds of people had died and roughly half a
of these countries, along with the appropriate international orga- million (of a total population of 11 million) had been inter-
nizations, take all steps necessary to make the missing data nally displaced or fled the country as of early 2017 (USAID
available without delay. Only when the extent of the problem is 2017b). The UN Office for the Coordination of Humanitarian
known can it effectively be tackled. Affairs’ 2017 Humanitarian Response Plan says 7.3 million
The table below shows the existing GHI indicator values for people, 65 percent of the population, live below the extreme
the nine countries without GHI scores that we have determined poverty line.
to be cause for significant concern. We base this determination
on the available data and information from international organi- COMOROS: Comoros’s child stunting rate is 32 percent; child wast-
zations that specialize in hunger and undernutrition. ing rate, 11 percent; and under-five mortality rate, 7 percent. A
low-lying island nation in the Indian Ocean, the Comoros is vul-
BURUNDI: Burundi’s child stunting level, estimated at nerable to the effects of climate change and has been repeatedly
56.6 percent, is the highest of all countries covered in this hit with natural disasters. Densely populated and heavily reli-
report. In 2014, the last year that adequate data were avail- ant on agriculture, the country suffers from poor environmental
able to calculate full GHI scores for Burundi, it had the management and has limited resources to support its growing
highest score of all countries for which scores could be cal- population (Burak and Meddeb 2012). In addition, the Comoros
culated, placing it in the extremely alarming category (von has experienced at least 20 coups since gaining independence
Grebmer et al. 2014). More than a decade of violent conflict from France in 1975 (CSIS 2008).
EXISTING GHI INDICATOR VALUES
Child Stunting Child Wasting Child Mortality
Country Stunting in children under five Wasting in children under five Under-five mortality
2012–2016 (%) 2012–2016 (%) 2015 (%)
Burundi 56.6* 7.6* 8.2
Comoros 32.1 11.1 7.4
Congo, Dem. Rep. 42.6 8.1 9.8
Eritrea 53.3* 14.7* 4.7
Libya 25.9* 5.8* 1.3
Papua New Guinea 41.5* 7.1* 5.7
Somalia — — 13.7
South Sudan 36.9* 27.3* 9.3
Syrian Arab Republic — — 1.3
Source: Authors.
Note: * indicates IFPRI estimates; — = not available. Undernourishment values are not available for countries in this table.
18 Global, Regional, and National Trends | Chapter 02 | 2017 Global Hunger IndexDEMOCRATIC REPUBLIC OF CONGO (DRC): The DRC has for decades food insecurity, and businesses, schools, and other services
struggled with one of the world’s most relentless emergencies. were strained (FAO 2015, UNDP 2017b). The country has yet
Recently, escalating conflict displaced 1.4 million people in to fully recover from this latest El Niño event and remains
Kasai Province. As of January 2017, more than 5.7 million peo- vulnerable to additional natural disasters, including the pos-
ple were facing crisis-level food insecurity and 173,000 were sibility of another El Niño episode occurring in late 2017
facing emergency-level food insecurity (ACAPS 2017). Roughly (UNDP 2017b).
43 percent of children under age five are stunted, 8 percent
are wasted, and the child mortality rate is nearly 10 percent. SOMALIA: Together, severe drought, high levels of internal dis-
According to the United States Agency for International placement, and difficulties providing humanitarian assistance
Development (USAID), “Recurrent conflict and subsequent to Somalia’s population brought Somalia to the brink of famine
internal displacement of persons, lack of improved agricultural in 2017. More than a quarter of the population (nearly 3 million
inputs and techniques, pervasive crop and livestock diseases, people out of a total population of 11 million) are believed
poor physical infrastructure, gender inequity, and a rising fer- to be facing crisis or emergency-level food insecurity (FEWS
tility rate are among the many factors challenging food security NET 2017b). A 2011 famine in Somalia claimed 250,000
in DRC” (USAID 2016). lives (WFP 2015). Child mortality is the only GHI indicator
for which data are available for Somalia; at 13.7 percent, it is
ERITREA: Child undernutrition levels are extreme in Eritrea, the third highest rate of child mortality among the countries
with the child stunting rate estimated at 53.3 percent and included in this report.
child wasting at 14.7 percent. In 2014, the last year for
which a GHI score could be calculated for Eritrea, the coun- SOUTH SUDAN: In February 2017, the UN declared that the coun-
try had the second highest score (von Grebmer et al. 2014). ties of Leer and Mayendit in Unity State were in the midst of
Undernutrition in Eritrea is related to the challenges of food famine (FAO 2017a). Other localities face emergency situa-
production due to limited arable land, water shortages, and tions and could cross the official threshold into famine. As of
frequent droughts. Severe poverty also limits people’s ability May 2017, nearly 6 million South Sudanese were believed to
to buy food (UNICEF 2015). be facing levels of food insecurity ranging from critical to cat-
astrophic (IPC 2017b). In 2013, a struggle for power between
LIBYA: Libya’s child stunting rate is estimated at 25.9 percent, opposing groups erupted in a civil war that still rages today.
child wasting at 5.8 percent, and child mortality at 1.3 percent. The acute food crisis, driven by conflict and insecurity, has
While these values are not extremely high, updated data are had massive impacts, including population displacement, dis-
urgently needed to shed light on how six years of intermittent ruption of markets, impending harvest deficits, and ongoing
civil war and political strife have affected food security and challenges for aid workers seeking to reach those in greatest
undernutrition. Conflict and instability have damaged supply need (IPC 2017a).
chains in parts of the country, limiting access to agricultural
inputs and diminishing agricultural production. High unemploy- SYRIAN ARAB REPUBLIC: As a result of the Syrian civil war that
ment and inflation rates have put further stress on the popu- began in 2011, current data on the country are limited or non-
lation (FAO GIEWS 2017a). These factors are worsening food existent. Up-to-date figures on the prevalence of undernourish-
security in Libya, particularly for the country’s roughly 250,000 ment, child stunting, and child wasting were not available for this
internally displaced persons (WFP 2017c). year’s GHI. But reports indicate that hunger has increased in
Syria and nutrition has suffered. In May 2017, FAO reported: “As
PAPUA NEW GUINEA: Child stunting in Papua New Guinea is the Syrian war enters its seventh year, food production remains
estimated at 41.5 percent and child wasting at 7.1 percent. at a record low. Hunger is rampant and deepening across the
As a result of drought and frosts brought on by El Niño in country with over half the population unable to meet their daily
2015–2016, a third of the country’s population suffered from food needs” (FAO 2017d).
2017 Global Hunger Index | Chapter 02 | Global, Regional, and National Trends19You can also read