2020-2023 Industrial Plan: "Broadening horizons" - FY 2019 results and 2020-23 Industrial Plan Conference Call | 13th march 2020
←
→
Page content transcription
If your browser does not render page correctly, please read the page content below

2020-2023 Industrial Plan: «Broadening horizons»
FY 2019 results and 2020-23 Industrial Plan Conference Call | 13th march 2020
DISCLAIMER
This presentation contains forward-looking statements regarding future events and the future results of Rai Way that are
based on current expectations, estimates, forecasts, and projections about the industries in which Rai Way operates, as
well as the beliefs and assumptions of Rai Way’s management. In particular, certain statements with regard to
management objectives, trends in results, margins, costs, rate of return and competition tend to be forward-looking in
nature. Words such as “expects”, “anticipates”, “targets”, “goals”, “projects”, “intends”, “plans”, “believes”, “seeks”
and “estimates”, variations of such words and similar expressions, are intended to identify such forward-looking
statements. These forward-looking statements are only predictions and are subject to risks, uncertainties, and
assumptions that are difficult to predict because they relate to events and depend on circumstances that will occur in
the future. Therefore, Rai Way’s actual results may differ materially and adversely from those expressed or implied in any
forward-looking statements. They are neither statements of historical fact nor guarantees of future performance. Rai
Way therefore cautions against relying on any of these forward-looking statements. Factors that might cause or
contribute to such differences include, but are not limited to, economic conditions globally, the impact of competition,
political, economic and regulatory developments in Italy. Any forward-looking statements made by or on behalf of Rai
Way speak only as of the date they are made. Rai Way undertakes no obligation to update any forward-looking
statements to reflect any changes in Rai Way’s expectations with regard thereto or any changes in events, conditions
or circumstances on which any such statement is based.

Considering the uncertainties related to the current extraordinary health emergency and, in particular, to its duration
and intensity and to the effectiveness of the containment measures, the scenarios and targets included in the 2020-
2023 Industrial Plan as well as the outlook for 2020 do not include any impact deriving from the spread of COVID-19

 2
Rai Way participants

 • Aldo Mancino, Chief Executive Officer

 • Adalberto Pellegrino, Chief Financial Officer

 • Giancarlo Benucci, Head of Corporate Development & IR

 3

Agenda

 1 2019FY Results

 2 2020-23 Industrial Plan

 4
2019 RESULTS

Fifth year of sequential growth 2015-19 Industrial
 Plan target for 2019

 Adj. EBITDA (2019 pre IFRS-16) Adj. EBITDA margin (2019 pre IFRS-16)

 +440bps
 122,1
 118,3 55,1%
 115,5 54,3%
 53,4%
 111,3
 109,3 51,5% 51,7%
 50,7%
 105,1

 2014 2015 2016 2017 2018 2019
 2014 2015 2016 2017 2018 2019

 NET INCOME RECURRING FCFE(1)

 77,5 77,8
 63,4
 59,7 74,6
 56,3
 69,7
 Target on recurring
 67,9 cash generation
 41,8
 38,9 63,4
 excedeed
 33,6

 2014 2015 2016 2017 2018 2019 2014 2015 2016 2017 2018 2019

 5
1) Recurring FCFE = Adj. EBITDA – Net Financial Charges – P&L Taxes – Recurring Maintenance Capex. All figures adjusted to deduct rents impacted by IFRS-16 from cash generation

2019 RESULTS

Key messages on 2019

 ➢ Agreement with RAI on refarming finalized, with full process de-risking
 o Definition of upgrade investments and remuneration and Service Contract renewal for the second
 seven-year period (until 30 June 2028) provides high visibility on revenues and cash flow

 ➢ Results in line with expectations, recording the highest recurring cash generation ever exceeding the
 target of the 2015-19 Industrial Plan
 o EBITDA improvement supported by CPI-link, New Services for Rai and cost control
 o Further improvement in Net Income, up 6,4% YoY
 o Development capex to support future growth
 o 23,29 €/cent dividend proposed to the AGM, equal to 100% pay-out and 5,7% dividend yield(1)

 ➢ 2020 guidance reflects initial contribution from growth initiatives, driving further EBITDA improvement

1) Dividend yield based on market closing price on 12/03/2020 (4,09 €/share) 6
2019 RESULTS

2019FY Financial Highlights
Mln Eur; %

 % YoY growth Core Revenues Net Income
 Adjusted EBITDA
 Adjusted EBITDA margin

 +1,7% +2,7%
 217,7 221,4 +6,4%
 127,7 131,2
 118,3
 63,4
 58,7% 59,4%
 59,7 59,5
 54,3% 59,3%

 2018FY 2019FY 2018FY 2018FY 2019FY 2018FY 2018FY 2019FY
 (1) (1)
 PF PF

 Capex Net debt (Net Cash) Cash conversion(3)

 (2)
 35,3
 9,5 2019FY excl. 85,2%
 27,0 IFRS16
 17,2 2018FY impact 83,6%
 Development 7,6
 2019FY
 4,1
 Maintenance 19,4 16,2
 18,1 (16,6)

 (30,0) 2018FY 2019FY
 2018FY 2019FY
 2019FY

1) Starting from 1 January 2019 the new IFRS-16 accounting standard was applied. Pro-forma economic data for 2018 simulate the application of the aforementioned accounting principle from 1 January 2018.
2) 2019 capex figure excluding capex related to IFRS-16 application, equal to € 1,2m 7
3) Cash conversion= (Adj. EBITDA – Maintenance Capex) / Adj. EBITDA. 2019 figures before IFRS-16 impact

2019 RESULTS

Core revenues
Mln Eur; %

 % YoY growth

 +1,7%
 221,4
 217,7
 • Revenues from Third Parties broadly in line with prior year figure
 • Good performance on Transmission services and Hosting of
 Third-Parties 33,2 +0,4%
 33,1 TV&radio broadcasters, FWAPs and corporates offset pressure
 from MNOs

 7,8
 - New services 6,8

 Revenues from RAI up 1,9%, reflecting:

 177,8 180,4 +1,9%
 • Indexation to CPI on fixed-consideration

 • € 1m higher contribution from New Services driven by release
 of 3.6-3.8 GHz radio links frequencies and extension of DAB+
 network
 2018FY 2019FY
 • First recurring contribution from refarming project (related to
 MUX coverage extension)

 8

2019 RESULTS

Opex (excluding one-offs)
Mln Eur; %

 % YoY growth

 99,6
 +1,1%
 90,1 91,1

 Personnel Excluding capitalization, personnel costs up by approx. 3%
 45,4
 costs following new hirings as part of the early-retirement plan
 -0,1%
 45,4 45,3 implemented in previous years and renewal of collective
 agreement

 Other Excluding non-core items, other operating costs increased by
 Operating 54,2
 costs 44,8 45,8 +2,3% 1,5% vs 2018PF driven by higher maintenance and energy
 price and savings on local taxes
 – 4Q comparison influenced by the low level recorded in
 2018
 2018FY 2018FY 2019FY
 PF(1)

 (1) Starting from 1 January 2019 the new IFRS-16 accounting standard was applied. Pro-forma economic and financial data for 2018 simulate the application of the aforementioned accounting
 principle from 1 January 2018. 9

2019 RESULTS

 P&L
 Eur Mln, % 4Q 2018 4Q2018 PF(1) 4Q 2019 % YoY 2018 FY 2018FY PF(1) 2019 FY % YoY

 Core Revenues 54,5 54,5 55,7 2,2% 217,7 217,7 221,4 1,7%

 Other Rev enues & income 0,1 0,1 0,9 0,1 0,1 0,9
 • 2019 Net Income up 6,4% at € 63,4m driven by:
 Adj. EBITDA 27,7 30,0 30,6 2,0% 118,3 127,7 131,2 2,7%
 % margin 50,8% 55,1% 55,0% 54,3% 58,7% 59,3%
 ˗ Underlying Adjusted EBITDA growth
 Non recurring costs -0,7 -0,7 0,0 -1,2 -1,2 -0,1
 ˗ Better contribution from non recurring items
 EBITDA 26,9 29,3 30,6 4,5% 117,1 126,6 131,1 3,6% (higher other revenues, lower one-off
 % margin 49,4% 53,8% 55,0% 53,8% 58,1% 59,2% expenses, € 1,6m benefit on D&A from release
 of provision for risks and charges)
 D&A(2) -9,0 -11,2 -10,9 -2,7% -33,3 -42,4 -41,0 -3,4%
 ˗ Reduction of financial expenses benefitting
 Operating Profit (EBIT) 18,0 18,1 19,7 9,0% 83,8 84,1 90,1 7,1% from early repayment of term loan
 Net financial income (expenses) -0,2 -0,4 -0,2 -37,6% -1,2 -1,9 -1,3 -32,8%
 ˗ Tax rate at 28,7% (2018 positively impacted by
 deferred taxes)
 Profit before Income taxes 17,7 17,7 19,4 10,0% 82,5 82,3 88,8 8,0%

 I ncome Taxes -5,2 -5,2 -5,8 11,0% -22,8 -22,7 -25,5 12,0%
 % tax rate 29,3% 29,4% 29,6% 27,6% 27,6% 28,7%

 Net Income 12,6 12,5 13,7 9,5% 59,7 59,5 63,4 6,4%

(1) Starting from 1 January 2019 the new IFRS-16 accounting standard was applied. Pro-forma economic and financial data for 2018 simulate the application of the aforementioned accounting
 principle from 1 January 2018. 10
(2) Including provisions
2019 RESULTS
 Net Debt/ 1y rolling pro-forma(1) Adj. EBITDA

Cash flow generation
Mln Eur

 Strong pre-dividend cash generation at approx. € 74m

 0,07x
 - IFRS 16 39,5m
 9,5 - Gross Debt 0,4m
 - Cash&Eq -30,4m
 40,1

 (16,6) 59,7

 (131,1) 1,1
 1,7
 (6,2)
 25,5

 n.a. z
 Benefit related to capex cycle

 35,3

 (Net Cash) Impact EBITDA Capex(2) Taxes(3) Financial Δ NWC Funds & Dividend Net Debt
 2018YE of IFRS-16 charges(4) Other payment 2019YE

 Including € 17,2m development capex,
 mainly related to start of MUX coverage
 extension and radio links frequencies release

(1) Starting from 1 January 2019 the new IFRS-16 accounting standard was applied. Pro-forma economic and financial data for 2018 simulate the application of the aforementioned accounting principle
 from 1 January 2018.
(2) 2019FY capex figure excluding capex related to IFRS-16 application, equal to € 1,2m
(3) P&L taxes 11
(4) P&L financial charges excluding interests on the employee benefit liability
2019 RESULTS

Dividend proposal
 ➢ Dividend proposal of 23,29 €cent/share (pay-out ratio of 100% of Net Income), with a dividend yield(1) of 5,7%

 ➢ Including the proposed dividend for 2019, approx. € 293 million (36% of the IPO Market Cap.) distributed to Shareholders
 since listing

 DIVIDEND PER SHARE
 Eur/cent

 23,29
 21,96

 20,26

 15,37
 14,32

 12,34

 2014 2015 2016 2017 2018 2019(2)

(1) Dividend yield based on market closing price on 12/03/2020 (4,09 €/share)
(2) Dividend proposal 12
Guidance 2020

 • ADJUSTED EBITDA
 ➢ Further organic growth of Adjusted EBITDA
 – Revenues growth driven by refarming
 – Operating costs increase related to implementation of new services (that will bring
 benefits in following years)

 • CAPEX
 ➢ Maintenance capex on core revenues ratio expected substantially in line with the 2019 figure

 ➢ Rising Development capex, mainly related to refarming process

 The outlook does NOT include potential impacts from COVID-19

 13
Agenda

 1 2019FY Results

 2 2020-23 Industrial Plan: Broadening horizons

 14
2020-2023 INDUSTRIAL PLAN KEY POINTS

2020-2023 Industrial Plan’s goals: broadening horizons
 STRENGTHENING OF EXPANSION OF OPTIONALITIES FOR INNOVATIVE USES
 THE CORE BUSINESS THE INFRASTRUCTURE MANAGED OF EXISTING INFRASTRUCTURE

 Strengthen the Core Business through Pursue expansion by external lines in Monitor any optionality for innovative
 the coverage of new technologies / infrastructures ensuring: uses of the existing infrastructure
 platforms, the offer of new services and
 the evolution of the operating model in ✓ scale (and competitiveness in a
 terms of digital transformation: market under progressive
 consolidation)
 ✓ Improving long-term positioning in
 the media industry ✓ synergies
 ✓ Introducing innovations in asset ✓ diversification
 management ✓ optimization of capital structure
 ✓ Pursuing operational efficiency (on
 costs and maintenance capex)

 15
2020-2023 INDUSTRIAL PLAN KEY POINTS Capital allocation strategy Target 2023 6% more than +17% € 200Mln EBITDA maintenance ✓ Recurring FCFE approaching Organic Development capex/ € 100 Mln, up 25% vs. 2019 vs. 2019 investments Capex sales Margin+300bps Additional 100% buyback2 Approx. 25% of the market Shareholders’ Payout + from distributable ✓ cap3 across the plan ratio1 remuneration reserves Organic capital structure 1x ✓ Availability of resources to External Net Debt/ finance external growth growth EBITDA4 1) With possibility to convert it into a mix of dividends and buy-backs depending on market and sector conditions 3) Based on Rai Way stock price of 4,09 € 16 2) In the limit of distributable reserves. Shares buyback proposal’s details will be subject to market conditions 4) Net Debt, including IFRS-16 impact
Agenda

 1 2019FY Results

 2020-23 Industrial Plan: Broadening horizons
 2
 − Market trends and key initiatives

 17
MAIN MARKET TRENDS

Main market trends
 Main dynamics Opportunities for Rai Way

 ▪ Refarming process ▪ DTT networks upgrade in the context of refarming,
 with further extension of the DAB radio network
 ▪ Evolution of consumer habits, with
 Media growing diffusion of OTT platforms ▪ Role on new media distribution platforms
 ▪ Technological changes in the TV ▪ Support roll-out of telco networks in rural areas
 production chain (eg. IP, 4K) and enable new services in view of 5G (eg.
 hospitality 5G devices, DAS, edge data centers)
 ▪ Development of fixed (fiber, IP) and ▪ Synergies from assets consolidation
 mobile networks (5G)
 ▪ High investments and returns under pressure
 Telco
 push telco operators to partnerships and cost
 Challenges for Rai Way
 optimization
 ▪ IoT services ecosystem development, with ▪ Rebalancing of distribution platforms’ relative
 weight
 increasing needs for latency/local computing
 ▪ Increasingly competitive MNOs hospitality
 ▪ Progressive captive assets spin-off and market (focus on cost optimization, site-sharing
 Towers evolution of TowerCo's role with expansion agreements, availability of assets open to the
 market)
 on adjacent businesses
 ▪ Assets consolidation

 18
MAIN MARKET TRENDS Main market trends – media platforms Market evidence Linear TV, however, still remains the reference platform, with a not steep rebalancing curve ▪ Video contents consumption (3h 43m of global average daily 85% viewing time in 20181) Strong and TV advertising revenues Peculiarity of constantly increasing substantially on DTT3 stable audience2, the Italian ▪ Growth driven by on- market, mainly confirms DTT demand and mobile Free-To-Air4 as the medium Broadcasters' devices consumption with the highest advertising (~26% of total consumption reach in 20181), particularly by collection highly 10 mln focused on the new generations, 73% average traditional both non DTT-based FTA in Italy4 daily platform audience2 vs. 25% in US 1 Source: Ampere Analysis 2 Despite improved broadband coverage and the growing popularity of OTT platforms, Management analysis on Auditel data 3 Expected CAGR 2018-2023 +0,3%, sources: PWC - Entertainment & Media Outlook in Italy 2019-2023, Nielsen 19 4 Penetration in terms of "prevailing" platform. Source: IHS Markit
MAIN MARKET TRENDS Main market trends – media platforms The rebalancing will continue ... ... but in the long term it is foreseeable a coexistence of platforms with a hybrid approach, based on the polarization fruition - type of content 99% news and generalistic 95% contents other contents Linear and DTT remains the TV set remains on-demand Obligations of most efficient the preferred fruition universality and solution for device will be coverage1 delivering linear (when complementary of the public content to a wide available) depending on service audience the content type 20 1 Deriving from the status of Public Service Broadcaster under the service contract with the Italian State
INDUSTRIAL PLAN 2020-2023 INITIATIVES

2020-2023 Industrial Plan’s key initiatives
 STRENGTHENING OF EXPANSION OF OPTIONALITIES FOR INNOVATIVE
 THE CORE BUSINESS THE INFRASTRUCTURE MANAGED USES OF EXISTING INFRASTRUCTURE

 Leadership in the media /
 broadcasting value chain Enabling factors
 Enhanced connectivity:
 ▪ Sites (FttT)
 Protection of the tower business ▪ Backbone

 Digital & Agile Transformation and evolution
 of the asset management system

 21
STRENGTHEN THE CORE BUSINESS - BROADCASTING

 Leadership in the media/broadcasting value chain

 Extension of broadcasting services on traditional platforms and evolution
 towards content distribution on OTT/IP platforms

 New platforms (Rai and 3rd parties)
 ▪ Content Delivery Network (CDN)
 3rd parties broadcasting platforms ▪ Multiplatform contribution (IP, 5G)
 ▪ Refarming DTT
 RAI broadcasting platforms ▪ DAB radio network

 ▪ Refarming DTT
 Activities mainly configured as
 ▪ DAB radio network
 technology and services business
 ▪ Satellite network on third party infrastructures

 22
STRENGTHEN THE CORE BUSINESS - BROADCASTING

 RAI broadcasting platforms – Development of services
 Refarming DAB coverage extension Satellite offer development
 Population coverage %
 From… ▪ DTH broadcasting
 Band Equip. Sites Standard reconfiguration with
 MUX1 VHF/UHF ~2k transponder and head-end
 transition in DVB-S / DVB-S2
 MUX2
 MUX3 UHF ~400
 ~2k ▪ The new configuration will
 allow to receive new
 MUX4 channels, even in 4k, from
 MUX5 N.r. satellite
 New UHF T2 Coverage T2 upgrade
 macroreg. extension on on national
 MUX nat. MUXes MUXes

 …to…
 Band Equip. Sites Standard 75%
 MUX MR ~2k
 ~2k
 MUXA UHF
 ~1k
 MUXB 56%
 As of
 31/12/2019
 23
STRENGTHEN THE CORE BUSINESS - BROADCASTING

 Third parties broadcasting platforms – Local TV refarming
 Reference context Roadmap

 ▪ Release of all frequencies currently in use
 by local operators 2020 2021 2022

 ▪ Awarding of two MUXes (I and II level) for
 the diffusion of local networks to network 1H 2020 June 2022
 operators through tenders and Launch phase Refarming
 subsequent selection of FMSAs through of the frequency completion
 beauty contest allocation
 tenders
 ▪ New configuration makes the local TV
 market potentially more sustainable (no
 network duplication, affordable Approach
 transmission capacity) yet with high
 differentiation in the regions' ▪ Prioritization of geographical areas by
 attractiveness size/market risk

 24
STRENGTHEN THE CORE BUSINESS - BROADCASTING

 Content Delivery Network (CDN)
 System of connected servers to provide multimedia Opportunities for Rai Way
 contents, reducing traffic and improving QoS1 and QoE2 Extend the positioning in the distribution of video contents on
 for Content Service Providers and end users IP platforms, implementing a "local" CDN (greater capillarity
 of the servers), carrier-neutral (through Italian ISPs), ensuring
 CDN Basic architecture Rai Way perimeter
 high QoS and QoE
 VOD files, Live Streaming,
 Multimedia files
 1 Holds the Leveraging on Rai Way fiber backbone infrastructure,
 multimedia video expertise, relationship with broadcasters and
 contents
 to be displayed presence on the territory
 Origin server 1 to users
 2 Sort traffic Enabling new B2B content transmission services
 2 CDN selector between multiple
 CDNs for
 Cache server effective traffic
 3 management

 CDN local CDN global 3 Store Web
 contents close Value proposition:
 POP1 to users
 ISP 1 quality of service and carrier-neutrality for content
 providers, backbone decongestion for ISPs
 POPx
 ISP n
 POP2
 POP1 POPy

1 Quality of Service 25
2 Quality of Experience
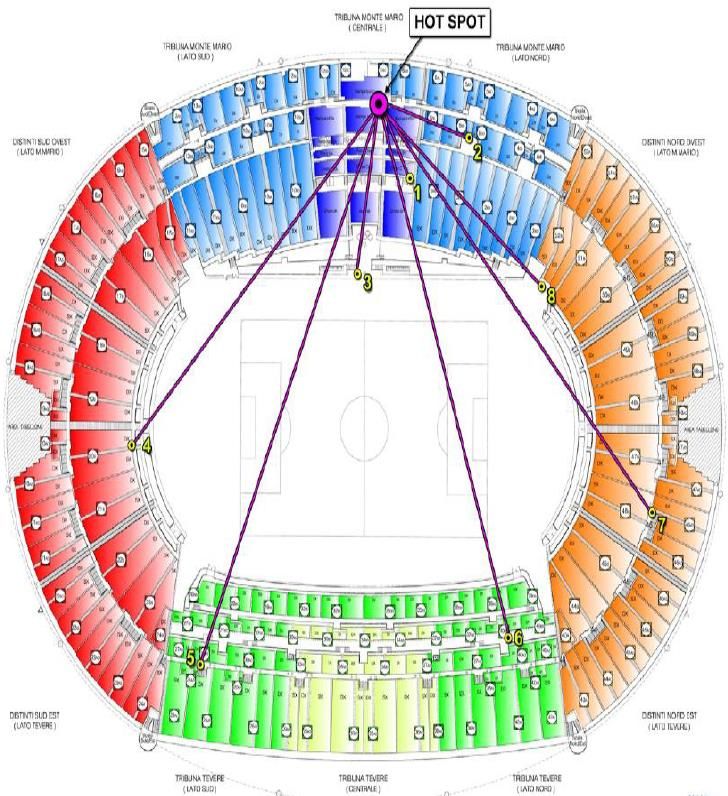
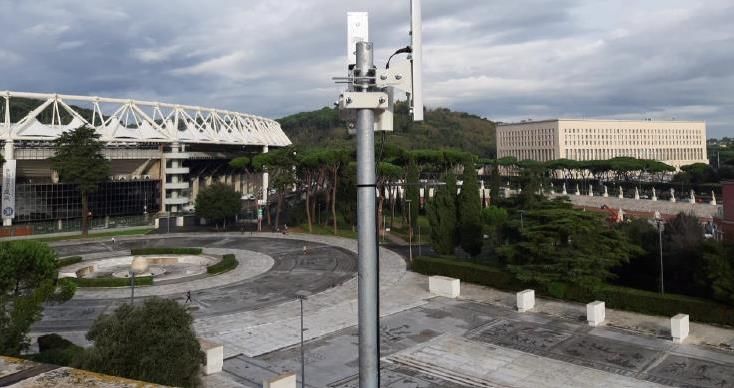
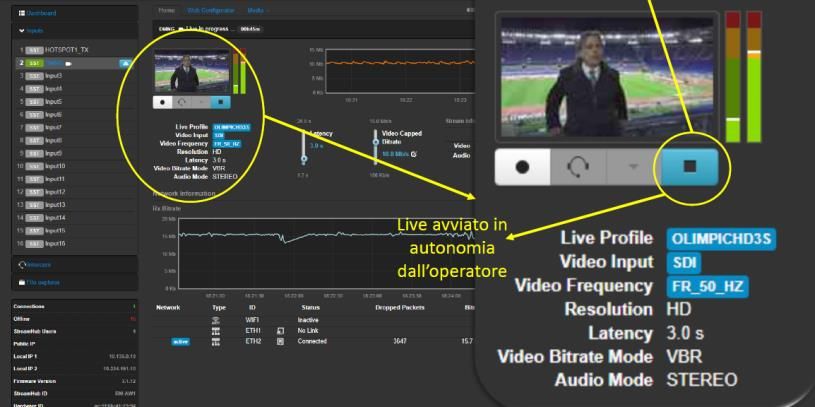
STRENGTHEN THE CORE BUSINESS - BROADCASTING

 Multiplatform contribution - Rai Way Wi-Fi Hot Spot for the
 Olympic Stadium in Rome
Wireless extension of the Rai Way contribution network with guaranteed reliability and video quality thanks to
dedicated frequencies (not sharing cellular data network)

 26
STRENGTHEN THE CORE BUSINESS - TOWERS

 Protection of the tower business widening range of services

 Edge Data
 Center FOCUS ON NEXT PAGE
 IMPROVED VALUE PROPOSITION

 ▪ Improved pricing
 OF THE TRADITIONAL OFFER

 competitiveness vs. contract o Retention / upselling of backhauling services for MNOs
 duration extension and attraction of new FWAP customers
 FttT o Implementation of new services (eg. Edge Datacenter,
 ▪ Offer widening with services DAS, …)
 enabled by new networks’ o Possible synergies with broadcast distribution network
 architectures and growing
 latency/local processing o Agreements with venue owners of points of interest
 near Rai Way towers
 requirements DAS
 o Focus on venues with high video/broadcasting
 component events

 ▪ 4G / 5G roll-out in rural areas
 EXPANSION
 VOLUME

 ▪ Leverage the growth of the fixed wireless segment, also for the entry into the traditional telco market
 ▪ Opportunities with public administrations and corporates (eg. mission critical networks)

 27
STRENGTHEN THE CORE BUSINESS - TOWERS

 (Tower) Edge Data Center
 Opportunity for Rai Way
 Distributed computing nodes equipped with data storage, data
 processing (also in real time) and connection to data
 • Infrastructural carrier-neutral operator (colocation & hosting)
 centers/louds and/or other edge computers
 for MNOs and service providers
 Global Edge Computing
 Growth driven by the need of: market expected 2019- 1 Retention and up-selling for MNO customers, following
 24 CAGR network virtualization and introduction of low-latency
 Low latency(
STRENGTHEN THE CORE BUSINESS – DIGITAL & AGILE TRANSFORMATION

 Digital transformation and "future proof" operating model
 Areas of impact Digital Transformation Pillars

 o New integrated platform to support corporate
 processes
 Organization o Evolution of the asset management and control
 & Skills model and data management with gradual tech
 integration
 Processes
 & o Development of active and passive infrastructure
 monitoring systems, through a distributed
 Procedures architecture of sensors and technologies

 Systems o Evolution of the Field Operations model
 & o CRM platform to support business processes
 Tools
 o Upgrading/reskilling of competences (digital & soft
 skills), agile and simplified solutions for processes
 and organizations
 29
INDUSTRIAL PLAN 2020-2023 INITIATIVES

2020-2023 Industrial Plan’s key initiatives
 STRENGTHENING OF EXPANSION OF OPTIONALITIES FOR INNOVATIVE
 THE CORE BUSINESS THE INFRASTRUCTURE MANAGED USES OF EXISTING INFRASTRUCTURE

 Industrial rationale

 ▪ Scale / size
 Broadcasting Towers
 Main
 ▪ Synergies
 areas of
 interest
 Colocation Data Center ▪ Diversification
 (infrastructure)

 30
EXPANSION OF MANAGED INFRASTRUCTURES - BROADCASTING TOWERS MARKET

 Broadcasting towers market Main areas of optimization

Italian vs. European market Industrial rationale
Market share of Europe's leading broadcast tower operators
(% on total broadcast towers) ▪ Synergies on costs related to the operating model and the
 management and maintenance of the technical infrastructure,
 100 100 100 100 100 freeing up resources to investment in innovation and diversification

 Transport
 41 Operations Asset
 network
 100 rationalization consolidation
 91 optimization
 70 76
 41
 ▪ Increase in dimensional scale
 Italy France Germany UK Spain
 ▪ Expansion of customers portfolio
 ▪ Promoting a possible rationalization of the broadcasting
High concentration of the broadcast towers sector in infrastructures with consequent improvement of the landscape
the main EU countries compared to Italy and environmental impact

 Source: TowerExchange; management analysis 31
EXPANSION OF MANAGED INFRASTRUCTURES – COLOCATION DATA CENTER MARKET

 Colocation Data Center: Italian market overview
 DEMAND: FAST GROWING REFERENCE MARKET SUPPLY: CAPACITY INCREASING, BUT STILL LIMITED AND FRAGMENTED

 Corporate
 USA
 Data Global IT externali- Size of bubbles= 2018
 consumpt. Cloud zation (also Data Center spend(1)
 OTT
 and Service through
 storage providers hybrid
 cloud)
 Public
 UK
 Admin.
 (DC
 GDPR
 rational.
 and cloud
 Germany
 migration) France

 Italy Spain
 Expected double-digit demand growth p.a.
 (on average)
 2018 Data Center spend as a % of 2018 GDP

▪ Cloud (mainly from global players and domestic TLC/ICT players) representing main driver of capacity demand
▪ Fragmented supply-side, with limited assets’ number and quality (vs. demand outlook)
▪ Relatively early-stage italian market (both on supply and demand) may lead to temporary unbalance
▪ In more advanced markets, trend towards outsourcing / externalization of infrastructural component
 32
 1 Source: Digital Realty presentation, October 2019, based on 2018 data center spend per Synergy Research Group.
EXPANSION OF MANAGED INFRASTRUCTURES – COLOCATION DATA CENTER MARKET

 Colocation Data Center: approach
 Domestic market dynamics influence possible entry strategy

 Target customers Entry options
 ▪ Secure occupation and growth: 1) MAKE
 o Cloud providers o Pre-agreement with anchor tenant
 o Telco o Opportunity to leverage on proprietary
 asset/land in the Rome area
 o PA
 2) BUY
 o Top-tier Independent asset
 o Asset spun-off from anchor tenant
 Asset features
 ▪ Tier-4
 ▪ Located in Industrial / financial districts
 ▪ Modular target power
 ▪ Energy and coolling efficiency

 Clear value proposition for customers/partner: independent, high-reliable and carrier-neutral operator; integration
 with Edge Data Center network to address low-latency requirements; synergies with OTT video customers

 33
INDUSTRIAL PLAN 2020-2023 INITIATIVES

2020-2023 Industrial Plan’s key initiatives
 STRENGTHENING OF EXPANSION OF OPTIONALITIES FOR INNOVATIVE
 THE CORE BUSINESS THE INFRASTRUCTURE MANAGED USES OF EXISTING INFRASTRUCTURE

 Focus on innovative services running on the existing infrastructure still not mature due to lack of technical/
 regulatory standardization

 Drones 5G Broadcasting

 34
Agenda

 1 2019FY Results

 2020-23 Industrial Plan: Broadening horizons
 2
 − Sustainability

 35
SUSTAINABILITY

Rai Way's commitment to sustainability: 2020-2023 ESG goals
 Environment, health and safety Social

 Energy Reinforcing Waste
 Efficiency mgnt systems reduction People development Community development

 • Reduction in • Maintaining • Ecological days • Smart working • Support in the transition
 consumption from ISO 14001 for employees to the new DTT
 • E-learning/ webinar
 new transmission • Achieving transmission standard
 training
 systems connected ISO 45001 • Caring initiatives
 to Refarming
 involving employees

 Innovation Governance

 Digital transformation ESG in the purchasing
 Incentive for ESG
 process
 • New IT platforms to support business and operations • ESG criteria in variable
 Management of
 • Digital skills and culture development remuneration policies
 whistleblowing
 • Digital Learning Hub/Academy creation • Sustainability
 committees Privacy and data
 • Open innovation and partnerships with universities
 security culture

 36
Agenda

 1 2019FY Results

 2020-23 Industrial Plan: Broadening horizons
 2
 − Key financials

 37
KEY FINANCIALS

2020-2023 financial highlights (1,2)

 Figures based on a refarming scenario
 Mln Eur
 with 3 MUXes managed for RAI
 % CAGR 2019-2023

 Core Revenues Adjusted EBITDA (post-IFRS16) Net Income
 Adjusted EBITDA margin
 +2,8%
 247 +4,1%
 +3,7%
 221 154
 131 73
 63
 62%
 59%

 2019 2020 2023 2019 2020 2023 2019 2020 2023

 Maintenance Capex(3) 2020-23 cumulated Development Capex Recurring FCFE(4)

 18 18 +5,9%
 220
 98
 3 Extraord..
 maintenance
 ~80 78
 ~140
 15 Recurring
 maintenance

 Recurring 2019 2020 2023
 maint. on >8% ~6% Refarming Other 2020-2023
 sales % initiatives 2019 2020 2023

1) On organic basis; 2) Based on CPI assumptions of: 0,1% in 2019, 0,8% in 2020, 1,1% in 2021 and 2022, with impact on the following year; 3) Excluding non-cash component related to IFRS-16 Leasing 4)
 38
 Recurring FCFE = Adjusted EBITDA – Net Financial Charges – P&L Taxes – Recurring Maintenance Capex. All figures adjusted to deduct rents impacted by IFRS-16 from the calculation of cash generation
KEY FINANCIALS

Core revenues
 Mln Eur

 % CAGR 2019-2023

 +2,8%
 247 Total

 221 31 Third parties Addition.
 Refarming
 new
 Rai (full impact
 216 services

 RAI
 33 from
 1 (CDN, DAB,
 14 1/7/21)
 188 16 connect…)
 8 1

 185 Retention
 Innovat. Volume
 / volume-

 THIRD PARTIES
 179 services growth on
 oriented
 (pushed by non-
 pricing 5G) MNOs
 scheme

 2019 2020 2021 2022 2023
 Revenues from Third Parties to bottom out during plan
 period, with customer mix more balanced
 RAI - Fixed consideration - current RAI - Mark-up services
 RAI - Fixed consideration - Refarming Revenues from third parties
 RAI - New services

 39
KEY FINANCIALS

Operating costs (1)

 Mln Eur
 % CAGR 2019-2023

 +0,6% Organiza-

 PERSONNEL
 93 tional
 91
 model

 46 50 Other operating(1) New service-
 Digital
 +2,3% transformation related costs

 OTHER OPERATING
 45 43 Personnel Efficiency
 initiatives
 -1,2%

 2019 2020 2021 2022 2023

 Continuous efficiency initiatives to offset emerging
 costs related to new services

1) Post IFRS-16 40
KEY FINANCIALS

Adjusted EBITDA and Net Income
 (1)

 Mln Eur
 % CAGR 2019-2023
 Ca. € 3,5m total cumulated one-off
 expenses, impacting 2020 and 2022

 +4,1% +3,7%
 154 73
 63
 ADJUSTED EBITDA(1)

 62%

 NET INCOME
 131

 59%

 2019 2020 2021 2022 2023 2019 2020 2021 2022 2023

 Acceleration of growth
 in 2022-23 driven by
 refarming (impact on From debt- Finan.
 financed D&A
 rev and opex) and charges
 digital transformation investment plan
1) Post IFRS-16 41
KEY FINANCIALS

Investments
 Mln Eur

 Including: CDN, connectivity upgrade, new
 telco services (FttT, edge data center, DAS),
 18 digital transformation and regional refarming
 18
 Non recurring
 220

 ~140
 15 Recurring
 MAINTENANCE(1)

 ~80

 DEVELOPMENT
 Total 20-23 Refarming Other
 2019 2020 2021 2022 2023
 cumulated RAI initiatives
 % Recurring Maint. Capex/ Core rev.
 >8%
 Upgraded
 network ~6%

 2019 2023 2020 2021 2022 2023

1) Excluding non-cash component related to IFRS-16 Leasing 42
KEY FINANCIALS

Cash generation
 % CAGR 2019-2023

 +5,9% 98
 EBITDA
 growth
 78
 RECURRING FCFE(1)

 Recurring
 FCFE calculated
 deducting rents
 >+25% Mainten.
 Capex
 impacted by IFRS-16 vs 2019 reduction
 to reflect actual
 cash generation

 Debt
 2019 2020 2021 2022 2023
 financing

 Recurring FCFE yield(2)
 ~7% ~9%

(1) Recurring FCFE = Adj. EBITDA – Net Financial Charges – P&L Taxes – Recurring Maintenance Capex. All figures adjusted to deduct rents impacted by IFRS-16 from the calculation of cash generation
 43
(2) Based on Rai Way shares market closing price of 12/03/2020 (4,09 €/share)
KEY FINANCIALS

Capital allocation
 ▪ External growth in infrastructures pursuing:
 ORGANIC GROWTH

 scale (and competitiveness in a market under
 220 Mln +20 Mln progressive consolidation)
 developm. recurring synergies
 capex FCFE diversification
 generation optimization of capital structure

 ▪ Business visibility and organic evolution of financial

 EXTERNAL GROWTH
 leverage3 – kept at around 1x NFP/EBITDA during the plan
 >5% period – allows availability of resources to finance external
 SHAREHOLDERS’ REMUNERATION

 Yield1 growth
 100% ~270
 Payout Additional
 ratio
 (or partly
 + buyback from
 distributable
 Mln
 (~25% of mkt
 cap1)
 buyback) reserves

 Flexibility to finance external growth
 ▪ Continuity in the dividend policy of 100% of Net Income, with
 possibility to convert it into a mix of dividends and buy-backs ~1x
 depending on market and sector conditions
 ~0,5x
 ▪ On top, implementation of an additional buy-back plan out
 from distributable reserves (at least € 20 Mln, equal to 7% of
 floating2)

(1) Based on RW share price of 4,09 and assuming distribution entirely through dividends 3) Net Debt/Adj. EBITDA. Net Debt including impact from IFRS-16 44
(2) Floating does not include stakes >5%
Q&A session
Contacts

 - Investor Relations

 +39 06 331 73973

 +39 06 331 74815

 investor.relations@raiway.it

 46
Annexes
MAIN MARKET TRENDS

Broadcasting - Recap on the refarming process
2019 Budget Law and the subsequent evolution of the regulatory framework by the competent
authorities(1) reshaped the refarming process and the DTT network configuration:

 CURRENT CONFIGURATION NEW CONFIGURATION
 o National MUX: 20 o National MUX: 12 UHF(2)
 - 19 UHF - 10 assigned through conversion of current RoU of
 frequencies (0,5 conversion ratio), of which 1 UHF
 - 1 UHF/VHF regionalized (Rai MUX1) to Rai to be regionalized
 - 2 to be auctioned (in 4 slots of ½ MUX each)
 o Transmission standard:
 - Transmission standard:
 o 10 years concession period on frequencies

 ▪ Most of the process milestones set by the 2019 Budget Law have been completed:

 2019 2020 Sept. 2021 30 June 2022

 New PNAF Conversion and Roadmap Capacity Auction Auction for Switch al Switch a
 (AGCOM) awarding (MISE) awarding to criteria additional MPEG4 DVB-T2
 criteria network (AGCOM) capacity (4 slots
 (AGCOM) operators of ½ MUX)
 Transitory period(3)
 (MISE) (MISE)

(1) Ministry of Economic Development (MISE), Authority for Communications (AGCOM); (2) One of them partially using also VHF frequencies 48
(3) Transitory period anticipated to Jan 2020 – Dec 2021 for network operators using channels 50, 51, 52 and 53
MAIN MARKET TRENDS Broadcasting - Evolution of consumer habits Consumers are watching more and more video content… Video content viewing time (minutes/day)(1) ▪ The consumption of video content Global Italy (time of use) has been constantly increasing for years ~218 ~222 ~223 ~218 ~204 ~205 ▪ Italy follows the same trend, with an average number of minutes per day (218) close to the global average ▪ Growth is expected to show the same trend for the coming years as well 2017 2018 20192 2017 2018 20193 (1) Source: Ampere Analysis; based on interviews carried out in 22 main countries around the world (e.g. USA, UK, France, Italy, Germany, Brazil, Australia, etc.) through the question "how many minutes a day on average during the week do you use to watch video content and on which devices?"; the data refers to Q3 of each year shown where not otherwise specified (2) Based on 1Q 2019 49 (3) Based on 3Q 2019
MAIN MARKET TRENDS

Broadcasting - Evolution of consumer habits
…global growth driven by on-demand and mobile device use…but linear TV still remains the
reference platform with share >80%...

 Linear vs. non-linear video consumption in Italy(1) Video consumption per device (minutes/day)(2)

 Global Italy

 87% 85% 81%
 89% ~76% ~74% ~80% ~78%

 ~26% ~22%
 13% 16% 19%
 11% ~24% ~20%

 2015 2016 2017 2018 2017 2018 2017 2018

 Linear share Non-linear share(on-demand) Regular TV set Streaming box/stick Smartphone
 Smart TV Computer Tablet

(1) Source: IHS Markit; ERGO Digital Trends 2019
(2) Source: Ampere Analysis; based on interviews carried out in 22 main countries around the world (e.g. USA, UK, France, Italy, Germany, Brazil, Australia, etc.) through the question "how many 50
 minutes a day on average during the week do you use to watch video content and on which devices?"; the data refers to Q3 of each year shown where not otherwise specified
MAIN MARKET TRENDS

Broadcasting - Evolution of consumer habits
… supported in Italy by a high audience (despite improved broadband coverage and the growing
diffusion of OTT platforms)...
 Linear TV audience in Italy on the average day Broadband coverage (vel. ≥ 30mpbs)
 Mln of viewers throughout the day (02:00 – 02:00) % of families ITA EU-28 UK

 10,4 10,5 10,4 10,4 78% 82%
 10,2 10,1 10,0 10,1 93%
 9,8 9,9 73% 89% 86% 92% 91%
 9,4 72% +19
 p.p.

 Stable at ~10M daily
2009 2010 2011 2012 2013 2014 2015 2016 2017 2018 2019
 June 2016 June 2017 June 2018
 ▪ The DTT audience has shown resilience in the past years, also thanks
 OTT(1) service subscriptions, Italy
 to the wider offer of Free To Air (FTA) thematic channels and despite: Mln of active subscriptions

 o Broadband coverage in Italy has reached EU levels 8,0

 o The OTT market (e.g. Netflix, DAZN, Amazon) has also registered an 5,2
 3,5X
 explosion in Italy (+248% from 2017 to 2019)
 2,3
 ▪ The DTT remains the mean with the highest reach: you watch
 traditional TV for less time, but you keep on watching it June 2017 June 2018 June 2019

(1) All services (Netflix, Amazon Prime,...)
 51
Sources: Management analysis based on Auditel figures, European Commission DESI report 2019, I-Com Rapporto ORES October 2019
MAIN MARKET TRENDS

Broadcasting - Evolution of consumer habits
… from advertising revenues…

 Breakdown of TV advertising sales in Italy
 EUR Bln
 DTT/FTA DTH Online TV
 ▪ Considering that DTT accounts for about 85%
 Average CAGR 2018-2023 +0,3% -1,9% +12,5%
 of TV(1) advertising revenues, it is unlikely that
 ~4,1
 national broadcasters will choose to move to
 Average
 ~3,4 3,28 3,30
 other platforms (e.g. OTT), whose advertising
 3,16 3,12 3,16 3,13 3,20 3,21
 3,01 3% 4% 5% 6% 7% 8% 8% 9% Online TV revenues will remain complementary
 3%
 11% 11% 10% 9% 9% 9% 9% DTH
 11% 10%

 ▪ Advertising revenues in the FTA segment are
 expected to remain broadly stable between
 86% 85% 85% 84% 84% 83% 83% 83% DTT/FTA
 86%
 2019 and 2023, thanks to expanding overall
 revenues

 2008- 2012- 2015 2016 2017 2018 2019 2020E 2021E 2022E 2023E
 2011 2014
 Sources: PWC - Entertainment & Media Outlook in Italy 2019-2023, Nielsen, RAI 52
 (1) Equal to 60.9% of total revenues in 2018 (EUR 6.23 bn, excluding Search & social component (Amazon, Google, other search engines and social networks)
MAIN MARKET TRENDS

Broadcasting - Evolution of consumer habits
… and the peculiarity of the Italian market

 Comparison in terms of penetration of the different "prevailing" platform(1), 2018
 % of families(2)

 ~73% ~71%
 ~58%
 ~42%
 ~25% ~27%

 Free-To-Air Pay-TV(3)
 ITA UK US

 The Italian market is mainly Free-to-air, dominated by two main national players (RAI and Mediaset)
 and difficult to be eroded by other platforms, especially if “pay”

 (1) If there is more than one platform in the family, it is considered to be the most widely used one
 (2) % calculated on a number of households equal to 25,3 mln (Italy), 27,6 mln (UK), 128 mln (US)
 (3) Includes cable, DTH and IPTV 53
 Source IHS Markit
MAIN MARKET TRENDS

Broadcasting - Evolution of consumer habits
What to expect going forward?

 The TV set remains the preferred
 device to use compared to mobile
 devices, when available.
 There will be no replacement, but a
 Linear and on-demand use will be stratification of models. A slice of the audience
 complementary depending on the will continue to have the TV not connected, and will
 continue to watch it as now. [...] In the long run I foresee a
 type of content
 very strong polarization between live events and on-
 demand content
 From a technological point of view,
 Italian TV broadcaster Senior Manager, 2019
 DTT remains the most efficient solution
 for the transmission of linear content
 to a wide audience

 The DTT will not disappear, but a coexistence of platforms through a hybrid approach,
 based on the polarization of the “way of fruition - type of content” is foreseeable
 54
MAIN MARKET TRENDS

Broadcasting - Evolution of consumer habits
TV set remains the preferred mode of use over mobile devices, when available

 BBC1 - Killing Eve ep. 6 : Viewing mode
 Case study: TV series in UK
 # viewers
 6%
 7% 3%
 ▪ An examination of how to enjoy episode 6 of the
 On-demand
 English TV series "Killing Eve" broadcast live on BBC1 pre-broadcast > 5.14m
 (Sept 15th-Oct 19th 2018)
 and also made available on-demand (pre and
 post live broadcast) shows that in both cases, the 84%
 TV set was the preferred solution for viewers. 2%
 2%
 < On demand and
 ▪ When available (e.g. at home), the television is the 4%
 2.84m timeshift within 28 days
 device that provides the best viewing experience 92% (Oct 20th-Nov 17th 2018)

 even in on-demand mode. The convenience of
 smartphones and tablets is appreciated when
 you're away from home or on the move Live Viewing >
 (Oct 20th 2018)
 1.88m

 TV-set PC 99%
 Tablet Smartphone
 55
 (1) Source: BARB, The Viewing Report May 2019
MAIN MARKET TRENDS

Broadcasting - Evolution of consumer habits
Polarization of platforms according to content type

 Case study: Fiorello on RAI Play

 Viva Rai Play: Fruition mode on OTT platform
 ▪ On 13 November 2019, the first episode of Fiorello's Show on 13 November 2019 exclusively on Rai Play

 show « Viva RAI Play», distributed exclusively on Linear
 Non-linear
 the RAI Play platform, recorded 84% of views in
 linear mode. 16%

 ▪ In the future, it is foreseeable a polarization of
 fruition mode with “on-demand” preferred for non-
 live and deferrable content (mainly TV series and 84%
 movies) while “linear” will remain the reference
 mode for live and non-deferrable events (e.g.
 entertainment, sports and news)

 56
MAIN MARKET TRENDS

Digital Television - Evolution of consumer habits
 From a technological point of view, DTT remains the most efficient solution for the transmission
 of linear content to a wide audience
 ▪ In terms of cost and spectrum, traditional terrestrial Total
 (DTT) and satellite (DTH) broadcast technologies are Cost
 efficient in delivering linear content to many viewers.
 Broadcast
 Efficiency is maximised when such events are non-
 deferrable.
 Broadband
 ▪ In case of provision of non-linear and deferrable events
 TV Series
 content - such as the consumption of on-demand Sport LIVE,
 Film
 video content whose viewing is not simultaneous and News
 usually distributed over long periods of time - the use of
 # simultaneous viewers
 Internet protocols (eg. IPTV, OTT) is the most suitable
 solution Unit
 cost Broadcast Broadband
 ▪ Transferring the offer of non-deferrable linear content
 of a traditional broadcaster (currently on DTT) entirely
 on an IP platform would entail prohibitive costs with
 current standards: events
 o For broadcasters, on the basis of a consumer Serie TV
 Sport LIVE,
 Film
 pricing model News
 o For telco, in terms of strengthening its backbone
 # simultaneous viewers

 57
Source: Ericsson, 2016, Hybrid media & TV delivery using Mobile Broadband combined with terrestrial/satellite TV
MAIN MARKET TRENDS Broadcasting - Radio FM radio remains a mainstream platform, evolving towards digital Advertising sales Radio in Italy Digital evolution is at an advanced level for domestic use... EUR mln 2.5% ▪ ~50% of Italian households have devices capable of receiving 498 FM Radio signal 482 480 484 451 ▪ Production/distribution of domestic FM equipment is decreasing ▪ Most national broadcasters transmit online and on DTT ▪ National and international online aggregator offerings are growing rapidly (TuneIn, FM World) … while it is still to be implemented for mobile use ▪ Limited DAB car radio penetration: mandatory installation from 2020 ▪ Slow renewal rate of the car fleet ( 37M of vehicles in Italy; 2M of new vehicles sold per year) 2014 2015 2016 2017 2018 58 Source: AGCOM; Confindustria Radio TV
MAIN MARKET TRENDS

Broadcasting - Evolution of the TV production chain
Technological changes in the media/broadcasting supply chain

 Challenges Main drivers

 Introduction of new ▪ SDI broadcasting infrastructure no longer adapted to the bitrates required by
 standards/forms new formats (3 Gbps vs. >12Gbps)
 (4K,HDR,8k) ▪ Scalability vs. new technological standards

 ▪ Optimized performance (100Gbps) and costs (use of standard off-the-shelf
 commercial products) vs. SDI
 Evolution to IP/Ethernet ▪ Sharing further performance improvements (low-latency and jitter, time
 ecosystem sensitive) achieved in Enterprise applications
 ▪ Interoperability guaranteed by industry-standards (eg. SMPTE ST 2110)
 ▪ Compatibility with existing broadcasting standards (eg. SDI, HD-SDI, ...)

 Virtualization (SDN, cloud- ▪ Flexible and dynamic network configuration management
 based applications) ▪ Remote use of resources and processes to reduce time-to-market, travel and
 personnel costs

 59
 Sources: Broadcast transition from SDI to IP – Arista, Sony IP live production system, management analysis
MAIN MARKET TRENDS Towers – Main market trends Evolution of the role of TowerCo TLC in Italy Captive TLC TowerCo 1.0 TowerCo 2.0 ▪ Towers substantially ▪ Separation from Telco ▪ From built-to-suite to owned by Telco ▪ Partial market proactive investment ▪ Co-tenancy limited consolidation in TowerCO ▪ Objective: infrastructure sharing 45k 45k 45k 9% 9% 9% 48% 72% Captive 90% Telco TowerCo 42% Others 18% Until 2015 Until 2019 Since 2020 Role ▪ Hosting providers ▪ Infrastructure Providers Offer ▪ Real-estate ▪ Real-estate ▪ Active equipment sharing (Das and Small Cell) Source: AgCom, management analysis 60
STRENGTHEN THE CORE BUSINESS - BROADCASTING

Multiplatform contribution – Transmission services
 Improvement of the current positioning on the transmission services market through a
 diversified offer capable of meeting the needs of broadcasters

 Reference market needs Services Market segments Networks

 ▪ High quality standards for high ▪ Point-to-point contribution services National
 value, high budget ▪ Signal monitoring and control Broadcasters
 productions (typically services
 entertainment content and Satellite Radio links
 sporting events)
 Services evolution New market
 ▪ High flexibility and cost- segments
 effectiveness for "best effort" ▪ Value-added broadcast services (4k
 productions (typically broadcasting, remote production) International
 information content) ▪ Mobile interconnection platforms (IP, Broadcasters Fiber optic IP
 wi-fi hotspot, 5G)
 ▪ Maximizing the value of Local
 content ▪ Platforms for content exchange Broadcasters
 (news exchange, event repository)
 ▪ Enabling streaming services on ▪ Signal Hybridization Platform
 DTT channel (HbbTV)

 Platforms: partnerships with industry leaders

 61
STRENGTHEN THE CORE BUSINESS - DIGITAL & AGILE TRANSFORMATION

 Infrastructure monitoring systems
 Evolution of site management system

 Benefits
 Software
 solution for ▪ Distributed architecture integrating
 ▪ Rationalisation and
 monitoring the sensors and technologies (e.g., IoT, Big
 quality levels of centralisation of control
 network Data, Artificial Intelligence)
 systems
 services...
 ▪ Efficiency of corrective
 actions (predictive
 ▪ Supervision and control of equipment
 maintenance)
 ...integrated
 with probes,
 ▪ Acquisition of data from probes and
 ▪ Improved fault detection
 sensors, sensors of different technologies that
 process
 equipment and
 will allow monitoring of the
 systems for E2E ▪ Network performance
 management environment, metal infrastructure...
 of the "site" evaluation

 62
2019FY RESULTS

Detailed summary of Income Statement
 (€m; %) 4Q18 4Q18PF 4Q19 FY18 FY18PF FY19

 Core revenues 54,5 54,5 55,7 217,7 217,7 221,4

 Other rev enues and income 0,1 0,1 0,9 0,1 0,1 0,9

 Purchase of consumables (0,4) (0,4) (0,4) (1,0) (1,0) (1,2)

 Cost of serv ices (13,0) (10,6) (12,1) (50,3) (40,9) (42,2)

 Personnel costs (13,2) (13,2) (12,6) (46,1) (46,1) (45,3)

 Other costs (1,1) (1,1) (0,9) (3,4) (3,4) (2,6)

 Opex (27,6) (25,3) (25,9) (100,8) (91,3) (91,3)
 Depreciation, amortization and write-
 (8,9) (11,2) (10,8) (33,3) (42,4) (42,4)
 downs
 Prov isions (0,1) (0,1) (0,1) (0,1) (0,1) 1,5

 Operating profit (EBIT) 18,0 18,1 19,7 83,8 84,1 90,1

 Net financial income (expenses) (0,2) (0,4) (0,2) (1,2) (1,9) (1,3)

 Profit before income taxes 17,7 17,7 19,4 82,5 82,3 88,8

 Income taxes (5,2) (5,2) (5,8) (22,8) (22,7) (25,5)

 Net Income 12,6 12,5 13,7 59,7 59,5 63,4

 EBITDA 26,9 29,3 30,6 117,1 126,6 131,1

 EBITDA m argin 49,4% (1,5%) 55,0% 53,8% 58,1% 59,2%

 Non recurring costs (0,7) (0,7) (0,0) (1,2) (1,2) (0,1)

 Adjusted EBITDA 27,7 30,0 30,6 118,3 127,7 131,2

 Adjusted EBITDA m argin 50,8% 55,1% 55,0% 54,3% 58,7% 59,3% 63
2019FY RESULTS

Summary of Balance Sheet
 2018FY 2019FY 2018FY 2019FY
 (€m) (€m)
 Non current assets Shareholders' Equity
 Tangible assets 180,9 177,6 Share capital 70,2 70,2
 Rights of use for leasing 0,0 36,2 Legal reserv es 14,0 14,0
 Intangible assets 12,9 14,3 Other reserv es 37,1 37,1
 Financial assets, holdings and other non-current assets 1,3 1,3 Retained earnings 59,5 62,9
 Deferred tax assets 3,3 2,7 Total shareholders' equity 180,8 184,2
 Total non-current assets 198,5 232,1
 Non-current liabilities
 Current assets Non-current financial liabilities 0,4 0,3
 Inv entories 0,9 0,9 Non-current leasing liabilities 0,0 26,3
 Trade receiv ables 71,5 74,8 Employee benefits 15,1 14,4
 Other current receiv ables and assets 5,8 5,0 Prov isions for risks and charges 17,0 15,9
 Current financial assets 0,1 0,3 Other non-current liabilities 0,3 0,0
 Cash and cash equiv alents 17,2 30,2 Deferred tax liabilities 0,0 0,0
 Current tax receiv ables 0,1 0,1 Total non-current liabilities 32,8 56,9
 Total current assets 95,5 111,2
 TOTAL ASSETS 294,0 343,3 Current liabilities
 Trade payables 45,6 54,3
 Other debt and current liabilities 33,9 34,1
 Current financial liabilities 0,3 0,2
 Current leasing liabilities 0,0 13,3
 Current tax payables 0,6 0,4
 Total current liabilities 80,4 102,3
 TOTAL SHAREHOLDERS' EQUITY AND LIABILITIES 294,0 343,3

 64
2019FY RESULTS

Summary of Cash Flow Statement
 (€m) 4Q2018 4Q2019 FY2018 FY2019

 Profit before income taxes 17,7 19,4 82,5 88,8
 Depreciation, amortization and write-downs 8,9 10,8 33,3 42,4
 Prov isions and (releases of) personnel and other funds 1,4 1,5 4,0 2,4
 Net financial (income)/expenses 0,2 0,2 1,0 1,0
 (Retained earnings)/Losses carried forward - Effect of IFRS adoption 0,0 0,0 (0,8) 0,0
 Net operating CF before change in WC 28,2 31,9 120,0 134,7
 Change in inv entories 0,0 0,0 0,0 0,0
 Change in trade receiv ables 13,1 5,5 0,2 (3,6)
 Change in trade payables 7,8 8,4 7,9 8,7
 Change in other assets 0,5 2,3 (0,4) 0,8
 Change in other liabilities (3,4) (4,3) 2,7 (0,7)
 Use of funds (0,1) (0,9) (0,9) (1,2)
 Payment of employee benefits (0,6) (0,7) (3,2) (3,3)
 Change in tax receiv ables and payables 0,0 (0,0) 0,3 0,2
 Taxes paid (2,3) (2,4) (21,6) (24,6)
 Net cash flow generated by operating activities 43,3 39,8 105,0 111,0
 Inv estment in tangible assets (12,5) (20,3) (24,0) (32,3)
 Disposals of tangible assets 0,1 0,1 0,1 0,2
 Inv estment in intangible assets (2,2) (2,3) (3,0) (3,0)
 Disposals of intangible assets 0,0 0,0 0,0 0,0
 Change in other non-current assets 0,0 (0,0) (1,0) 0,1
 Change in holdings 0,0 0,0 0,0 0,0
 Change in non-current financial assets 0,0 0,0 0,1 0,0
 Business combination 0,0 0,0 0,0 0,0
 Net cash flow generated by investment activities (14,6) (22,5) (27,8) (35,1)
 (Decrease)/increase in medium/long-term loans (0,1) (0,1) (60,2) (0,2)
 (Decrease)/increase in current financial liabilities (17,9) (0,1) (0,0) (0,8)
 (Decrease)/increase in IFRS 16 financial liabilities 0,0 (0,7) 0,0 (1,8)
 Change in current financial assets 0,1 (0,1) 0,1 (0,2)
 Net Interest paid (0,2) (0,1) (0,7) (0,2)
 Div idends paid 0,0 0,0 (55,1) (59,7)
 Net cash flow generated by financing activities (18,2) (1,0) (115,9) (62,9)
 Change in cash and cash equivalent 10,5 16,4 (38,7) 13,0
 Cash and cash equiv alent (beginning of period) 6,7 13,8 55,9 17,2
 Cash and cash equiv alent of newly consolidated companies
 0,0 0,0 0,0 0,0
 (beginning of period)
 65
 Cash and cash equiv alent (end of period) 17,2 30,2 17,2 30,2
You can also read