2020 Medicaid and CHIP Beneficiary Profile: Characteristics, Health Status, Access, Utilization, Expenditures, and Experience - Released August 2021
←
→
Page content transcription
If your browser does not render page correctly, please read the page content below
2020 Medicaid and CHIP
Beneficiary Profile: Characteristics,
Health Status, Access, Utilization,
Expenditures, and Experience

                         Released August 2021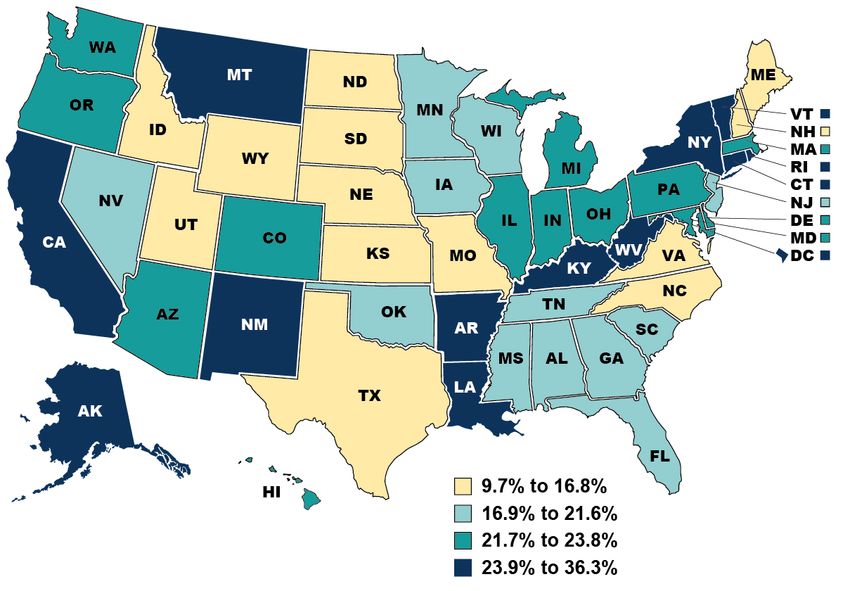
Introduction

The Medicaid and CHIP Beneficiary Profile provides an overview of the characteristics,
health status, access, utilization, expenditures, and experience of the beneficiaries served
by Medicaid and CHIP. It is not intended as a comprehensive assessment of Medicaid and
CHIP.

• The charts in the profile are based on the most recent publicly available, published data
  sources that allowed for meaningful comparative analysis.
• The data sources included in the profile vary in terms of the time frame available and
  the populations included. Please refer to the sidebar on each chart for notes (including
  populations excluded from the data), data sources, and links (where available). Please
  refer to the Appendix for more information on each data source.

More information about the Medicaid and CHIP programs, their beneficiaries, and the
quality of care is available in the following additional resources:

• 2020 Medicaid and CHIP Beneficiaries at a Glance shows key highlights from the
  Medicaid and CHIP Beneficiary Profile. It is available at:
  https://www.medicaid.gov/medicaid/quality-of-care/index.html.
• CMS developed the Medicaid and CHIP Scorecard to increase public transparency
  and accountability about the programs’ administration and outcomes. It is available at:
  https://www.medicaid.gov/state-overviews/scorecard/index.html.                               Suggested Citation:
                                                                                               Center for Medicaid and CHIP Services,
• More information on the measurement of quality of care in Medicaid and CHIP,                 Division of Quality and Health
                                                                                               Outcomes. 2020 Medicaid and CHIP
  including the Child and Adult Core Sets of health care quality measures, is available at:    Beneficiary Profile. Centers for Medicare
  https://www.medicaid.gov/medicaid/quality-of-care/index.html.                                & Medicaid Services. Baltimore, MD.
                                                                                               Released August 2021.

2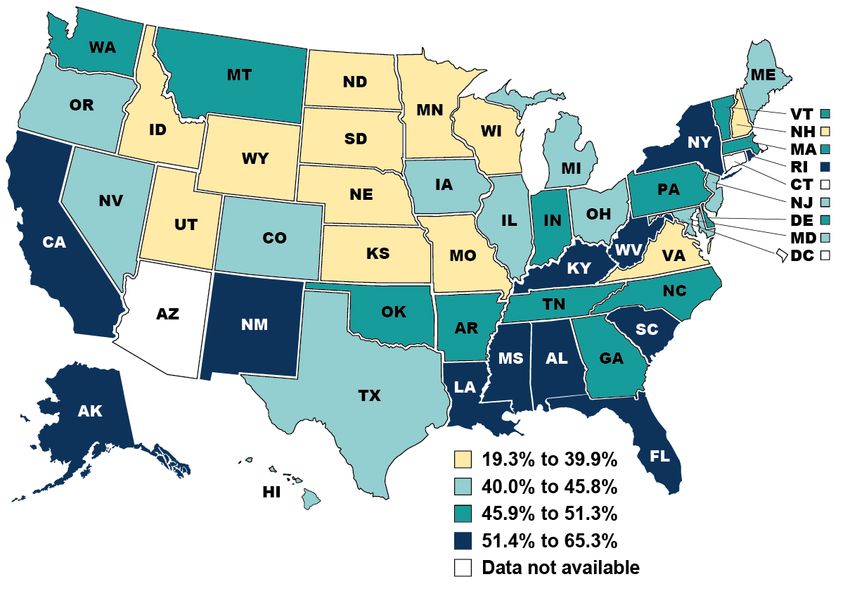
Table of Contents

About the Medicaid and CHIP Beneficiary Profile…………………………………….…………….                           4

Medicaid and CHIP Program Overview.…...…...…...…………………………..………………….                            6

Beneficiary Characteristics ……………………….…………………………………………………..                                    14

Beneficiary Health Status……………….…………………………………………………………….                                       18

Beneficiary Access and Utilization…….………………………………………….…………………..                                26

Beneficiary Expenditures…….………………………………………………………………………..                                       35

Beneficiary Experience…….………………………………………………………………………….                                         39

Special Population: People Dually Eligible for Medicare and Medicaid……………………….…                48

Special Population: Children with Special Health Care Needs…….………….…........................   63

Appendix: Data Sources………………………………………………………………………………                                           69

3
ABOUT THE MEDICAID AND CHIP
       BENEFICIARY PROFILE

4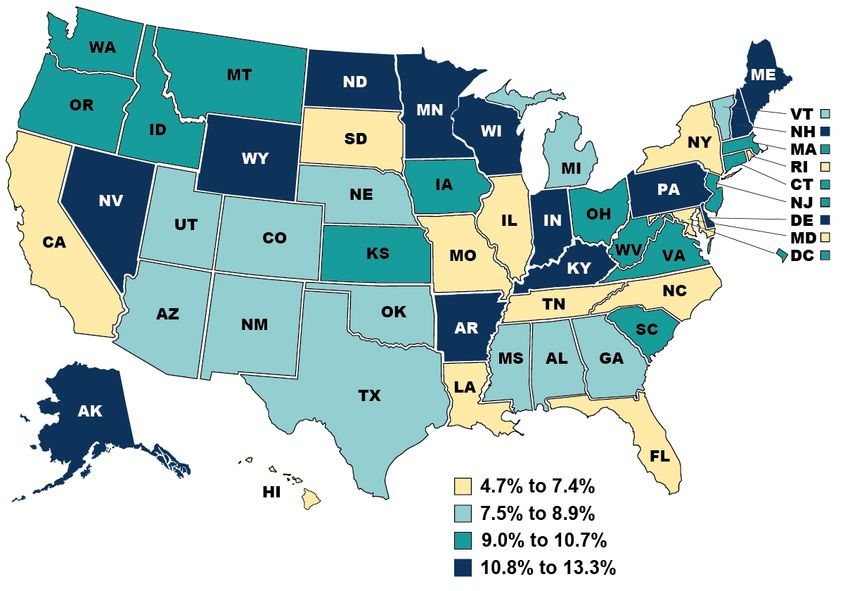
About the Medicaid and CHIP Beneficiary Profile

The Medicaid and CHIP Beneficiary Profile provides an overview of the characteristics,
health status, access, utilization, expenditures, and experience of the beneficiaries served   Unless otherwise noted,
by Medicaid and the Children’s Health Insurance Program (CHIP). As the agency                  charts include all Medicaid
                                                                                               and CHIP beneficiaries. One
responsible for ensuring quality health care coverage for Medicaid and CHIP beneficiaries,
                                                                                               notable exclusion from some
the Center for Medicaid and CHIP Services (CMCS) plays a key role in promoting quality         charts is institutionalized
health care for adults and children in Medicaid and CHIP.                                      individuals; surveys tend to
                                                                                               exclude such individuals from
                                                                                               their samples. Please refer to
The profile covers the following domains:                                                      the sidebar on each chart for
• Medicaid and CHIP Program Overview                                                           notes (including exclusions),
• Beneficiary Characteristics                                                                  data sources, and links
                                                                                               (where available). Please refer
• Beneficiary Health Status                                                                    to the Appendix for more
• Beneficiary Access and Utilization                                                           information on data sources.
• Beneficiary Expenditures
• Beneficiary Experience
• Special Population: People Dually Eligible for Medicare and Medicaid
• Special Population: Children with Special Health Care Needs

5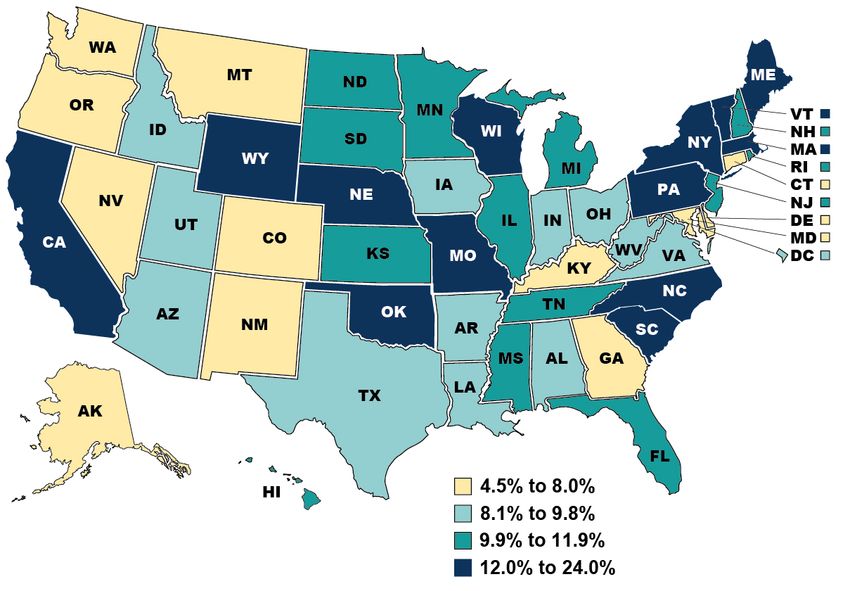
MEDICAID AND CHIP PROGRAM
            OVERVIEW

6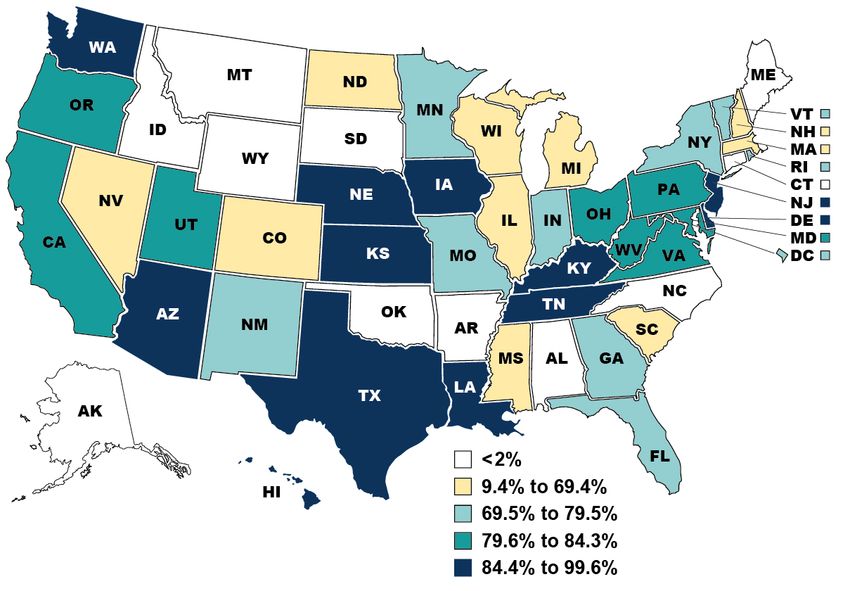
Medicaid and CHIP Program Overview

Fast fact: In 2019, Medicaid and CHIP covered about 17% of people in
the United States.

This section of the profile provides context on Medicaid and CHIP enrollment and
expenditures.

The charts in this section include:
• National Medicaid and CHIP Enrollment Trends
• Key Facts About Medicaid and CHIP
• Health Insurance Coverage of the U.S. Population
• Percentage of Population Enrolled in Medicaid or CHIP by State
• Percentage of Child Population Enrolled in Medicaid or CHIP by State
• Percentage of Medicaid Beneficiaries in Comprehensive Managed Care by State

 For most of the data sources used in the profile, the available information predates the
 COVID-19 national public health emergency. As a result, these sources may not fully
 reflect the Medicaid and CHIP population covered during and after the emergency. To
 provide a consistent picture of the Medicaid and CHIP population, most of the                Note:
                                                                                              While newer enrollment data are
 enrollment estimates and exhibits tell the story of the population prior to the pandemic.    available for some slides, some data
 For additional context, Slide 8 shows the change in the size of the Medicaid and CHIP        points were calculated with 2019 data to
                                                                                              align with the available Census data.
 population that occurred during the pandemic. When more current data become
 available, future versions of the profile will capture the characteristics and experiences
 of the Medicaid and CHIP population during and after the pandemic.

7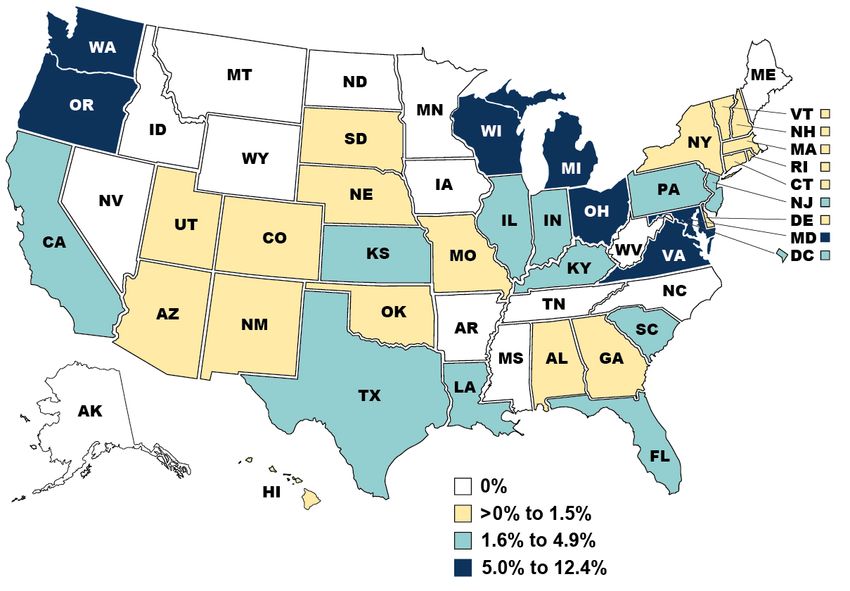
National Medicaid and CHIP Enrollment Trends,
     February 2020 – January 2021
                                                                                                                From February 2020 to
                     Enactment of Families First
                     Coronavirus Response Act                                                         80.5 M    January 2021, national
                     (FFCRA)                                                                                    Medicaid and CHIP
                                                                                                      73.8 M    enrollment increased by
70.7 M                                                                                                          9.9 million individuals
                                                                                                                (13.9%).
64.0 M
                                                                                                               Notes: This analysis includes preliminary
                                                                                                               enrollment data from 50 states and the
                                                                                                               District of Columbia. Enrollment totals
                                                                                                               represent the total unduplicated number of
                                                                                                               individuals enrolled in Medicaid and CHIP as
                                                                                                               of the last day of the reporting period. These
                                                                                                               figures are point-in-time counts of program
                                                                                                               enrollment and include only those
                                                                                                               individuals who are eligible for
                                                                                                               comprehensive benefits. The Families First
                                                                                                               Coronavirus Response Act (FFCRA)
                                                                                                               maintenance of effort requirement made
                                                                                                               available a temporary 6.2 percentage point
                                                                                                               increase to each state or territory's federal
                                                                                                               medical assistance percentage (FMAP)
                                                                                                               during the emergency. As a condition of
                                                                                                               receiving the FMAP increase, states must
                                                                                                               meet several requirements pertaining to
                                                                                                               eligibility and maintenance of enrollment.

                                                                                                               Source: CMS. December 2020 and January
                                                                                                               2021 Medicaid and CHIP Enrollment Trends
                                                                                                      6.8 M    Snapshot. Figure 1.
 6.7 M
                                                                                                               Available at:
                                                                                                               https://www.medicaid.gov/medicaid/program
         Feb     Mar      Apr     May        Jun    Jul    Aug     Sep     Oct   Nov    Dec     Jan            -information/medicaid-chip-enrollment-
                                                                                                               data/medicaid-and-chip-enrollment-trend-
         2020    2020    2020     2020      2020   2020    2020    2020   2020   2020   2020   2021
                                                                                                               snapshot/index.html

                Medicaid and CHIP enrollment              Medicaid enrollment       CHIP enrollment

     8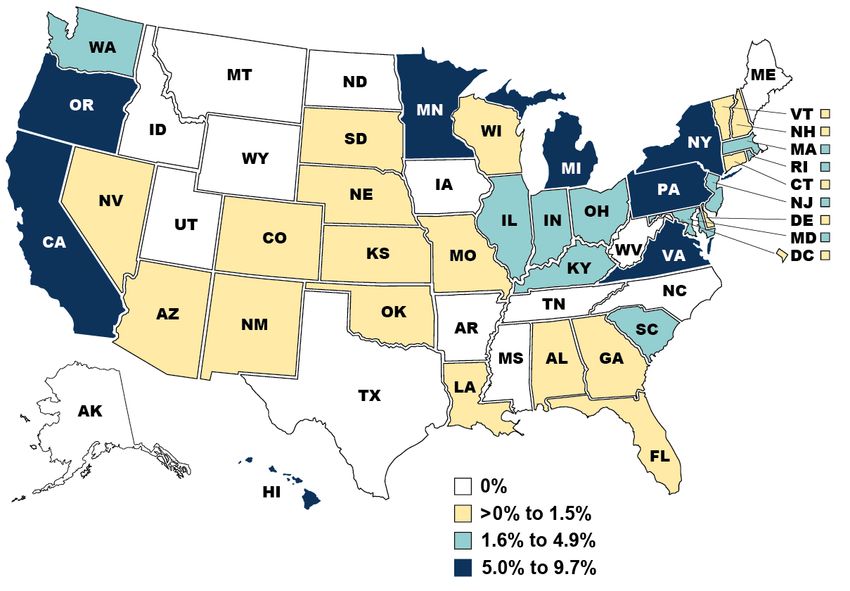
Key Facts About Medicaid and CHIP

                                                Key Facts
                                                Medicaid & CHIP Enrollment,1           80,543,351
                                                2021
                                                Medicaid Expansion Adult               18,740,932
                                                Enrollment,2 2020
                                                Full Benefit Dually Eligible           7,888,961              Notes:
                                                Beneficiaries,3 2020                                          “Full Benefit Dually Eligible Beneficiaries”
                                                                                                              are beneficiaries eligible for full Medicaid
             80.5 M
                                                Total Medicaid & CHIP                  $633 Billion           benefits who were also eligible for Medicare
                                                                                                              due to age and/or disability. The total,
                                                Expenditures,4 2019                                           national number of all dually eligible
                                                                                                              beneficiaries does not equal the sum of the
                                                                                                              number of full benefit and partial benefit
                                                                                                              beneficiaries. The national total includes
                                                                                                              values that have been suppressed at the
                                                                                                              county-level for privacy reasons and cannot
                                                                                                              be broken out by full or partial benefit status.
                                                                                                              “Total Medicaid & CHIP Expenditures”
                                                                                                              include federal, state, and local
                                                                                                              expenditures. Full website links for each
                                                                                                              data source can be found in the Appendix.

                                                                                                              Sources:
                                                                                                              1 CMS. December 2020 and January 2021

                                                                                                              Medicaid and CHIP Enrollment Trends
                                                                                                              Snapshot. Figure 1. (Jan 2021 data.)
                                                                                                              2 CMS MBES Expansion Adult Enrollment
                                                 18.7 M                                                       October-December 2020 (Dec 2020 data).
                                                                                                              3 CMS Medicare-Medicaid Coordination

                                                                                                              Office Quarterly Enrollment Snapshot (Jun
                                                                                          7.9 M               2020 data).
                                                                                                              4 CMS National Health Expenditures

                                                                                                              Accounts (2019 data).

Total Medicaid & CHIP Enrollment   Medicaid Expansion Adult Enrollment         Full Benefit Dually Eligible
             (2021)                             (2020)                            Beneficiaries (2020)

   9
Health Insurance Coverage of the U.S. Population,
2019
56.4%
Percentage of Total U.S. Population
Notes:
Health insurance coverage is based on
self-report and categories do not sum to
100% as people may report more than
one type of coverage. “Medicare”
includes any Medicare coverage.
“Direct-purchase” includes coverage
purchased directly from an insurance
company or through a federal or state
marketplace. “TRICARE” refers to
coverage under the Military Health
System. "Other Public" includes
coverage under the Civilian Health and
18.1% Medical Program of the Department of
17.2%
Veterans Affairs, as well as care
provided by the Department of Veterans
Affairs and the military.
10.2% Source:
8.0% U.S. Census Bureau. Health Insurance
Coverage in the United States: 2019
(2019 data).
2.6%
1.0% Available at:
https://www.census.gov/library/publicatio
ns/2020/demo/p60-271.html
Employer Medicare Medicaid & Direct-purchase Uninsured TRICARE Other public
CHIP
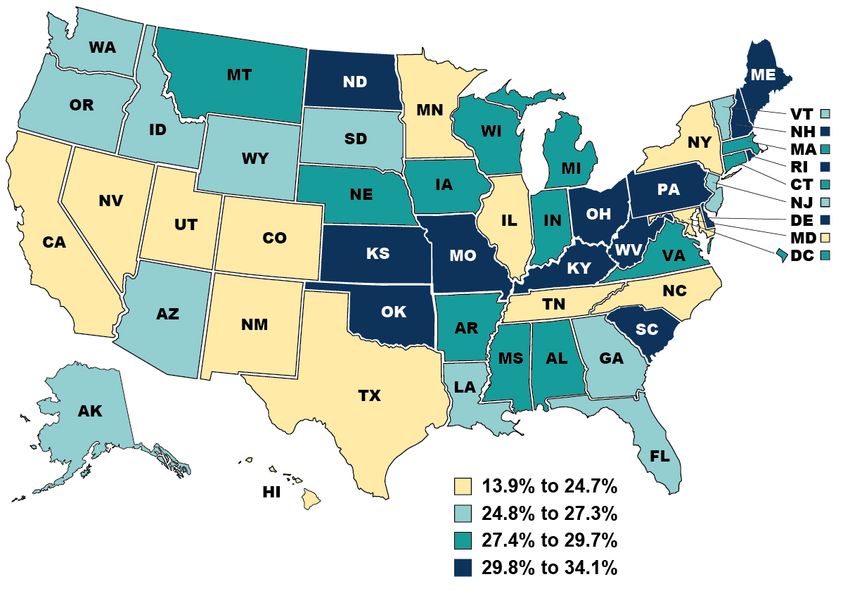
10Percentage of Child and Adult Population Enrolled
in Medicaid or CHIP, by State, 2019
Population: Beneficiaries of all ages with full Medicaid or CHIP benefits
Notes:
Enrollment in Medicaid or CHIP
represents individuals who are eligible
for full Medicaid or CHIP benefits and
excludes individuals who are eligible
only for restricted benefits, such as
Medicare cost-sharing, family planning
only benefits, and emergency services
due to alien status. The percentage of
each state’s population enrolled in
Medicaid or CHIP was calculated by
dividing administrative counts of
Medicaid and CHIP enrollment by
estimates of each state’s resident
population. Results were rounded to one
decimal place, and then states were
assigned to quartiles.
Sources:
CMS. Updated July 2019 Applications,
Eligibility, and Enrollment Data (as of
November 2, 2020).
Available at:
https://www.medicaid.gov/medicaid/prog
ram-information/medicaid-and-chip-
enrollment-data/monthly-
reports/index.html
U.S. Census Bureau. Annual Estimates
of the Resident Population for the
United States, Regions, States, and
Puerto Rico (July 2019 population
estimate).
Available at:
https://www.census.gov/newsroom/pres
s-kits/2019/national-state-estimates.html
11Percentage of Child Population Enrolled in
Medicaid or CHIP, by State, 2019
Population: Beneficiaries age less than 19 with full Medicaid or CHIP benefits
Notes:
Enrollment in Medicaid or CHIP represents
individuals who are eligible for full Medicaid
or CHIP benefits and excludes individuals
who are eligible only for restricted benefits,
such as Medicare cost-sharing, family
planning only benefits, and emergency
services due to alien status. The percentage
of each state’s population enrolled in
Medicaid or CHIP was calculated by dividing
administrative counts of Medicaid and CHIP
child enrollment by estimates of each state’s
resident population of children. Children in
each state include children and adolescents
up to age 19. The following states did not
report data to CMS or the data did not align
with CMS’s specifications: AZ, CT, and DC.
Results for remaining states were rounded
to one decimal place, and then states were
assigned to quartiles.
Sources:
CMS. Updated July 2019 Applications,
Eligibility, and Enrollment Data.
Available at:
https://www.medicaid.gov/medicaid/program
-information/medicaid-and-chip-enrollment-
data/monthly-reports/index.html
Mathematica analysis of U.S. Census
Bureau, American Community Survey, 2019
PUMS data.
Available at:
https://www.census.gov/programs-
surveys/acs/microdata.html
See Appendix for more information on each
data source.
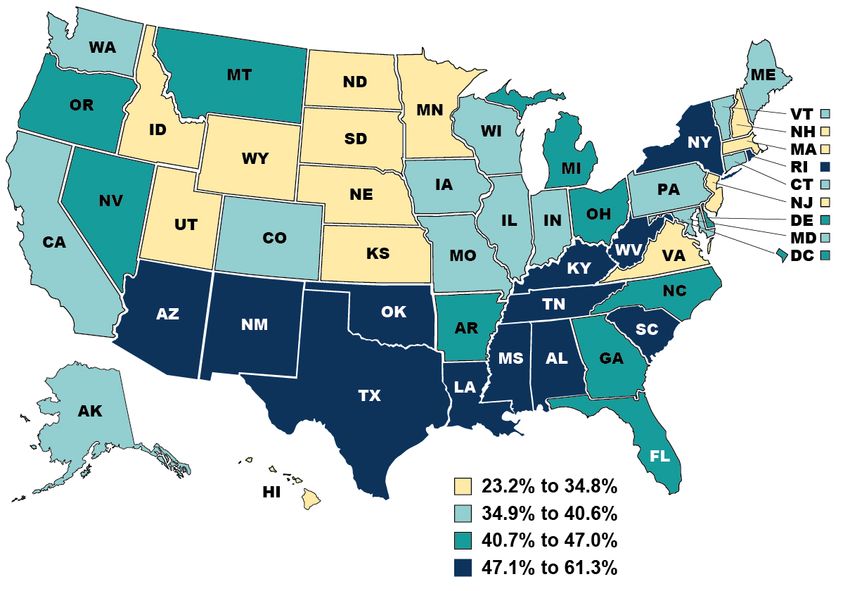
12Percentage of Medicaid Beneficiaries in
Comprehensive Managed Care, by State, 2018
Population: Beneficiaries of all ages with full Medicaid or CHIP benefits
Nationally, 69.0% of
Medicaid beneficiaries
are enrolled in a
comprehensive managed
care plan.
Notes:
Medicaid enrollment in Comprehensive
Managed Care represents an
unduplicated count of Medicaid
beneficiaries enrolled in a managed care
plan that provides comprehensive
benefits (acute, primary care, specialty,
and any other), as well as PACE
programs. It excludes beneficiaries who
are enrolled in a Financial Alignment
Initiative Medicare-Medicaid Plan as
their only form of managed care. Eleven
states have less than 2% of
beneficiaries in comprehensive
managed care. Results for remaining
states were rounded to one decimal
place, and then states were assigned to
quartiles. Puerto Rico is excluded from
the map and national calculations.
Source:
2018 CMS Managed Care Enrollment
Report.
Available at:
https://www.medicaid.gov/medicaid/man
aged-care/downloads/2018-medicaid-
managed-care-enrollment-report.pdf
13BENEFICIARY CHARACTERISTICS 14
Beneficiary Characteristics

Fast fact: Persons with disabilities account for 15% of Medicaid
beneficiaries (10.6 million) and 38% of expenditures ($216 billion).
Children (non-disabled) account for 39% of beneficiaries (27.9 million)
and 19% of expenditures ($107.2 billion).

This section of the profile shows the demographic characteristics of Medicaid and CHIP
beneficiaries by age group and sex. It also shows enrollment, expenditures, and average
cost by beneficiary category (children, adults, expansion adults, aged, and persons with
disabilities).

The charts in this section include:
• Demographics of Medicaid and CHIP Beneficiaries
• Medicaid Enrollment, Expenditures, and Average Cost, by Beneficiary Category

15
Demographics of Medicaid and CHIP
  Beneficiaries, 2018 & 2019
  Population: Beneficiaries enrolled in Medicaid, CHIP, or other government health
  plan

Share of Beneficiaries by Age Group                  Share of Beneficiaries by Sex
              (2018)
                                                                                     Age Group and Sex:
                                                                (2018)               Note:
                                                                                     Data come from administrative sources
 Ages 0-20                                                                           and include beneficiaries in both
                                       54%
                                                                                     Medicaid and CHIP. Total may not sum
                                                                                     to 100 due to rounding.

                                                                                     Source:
Ages 21-26    7%                                                                     CMS. 2020 Medicaid & CHIP Scorecard.
                                                                                     Analysis of calendar year 2018 T-MSIS
                                                                                     Analytic Files, v 4.0.
                                                                        Male
Ages 27-45           18%                             Female             46%          Available at:
                                                      54%                            https://www.medicaid.gov/state-
                                                                                     overviews/scorecard/who-enrolls-
                                                                                     medicaid-chip/index.html
Ages 46-64         13%
                                                                                     Institutionalized:
                                                                                     Notes:
                                                                                     Data include individuals who self-report
  Age 65+     7%                                                                     coverage through Medicaid, CHIP, or
                                                                                     another government health plan. An
                                                                                     institution is defined as a correctional
                                                                                     facility, nursing home, or mental
                                Share of Beneficiaries                               hospital.
                           Institutionalized by Age (2019)
                                                                                     Source:
                                                               10%                   Mathematica analysis of U.S. Census
                                                                                     Bureau, American Community Survey,
                                                                                     2019 PUMS data

                                                                                     Available at:
                                                                                     https://www.census.gov/programs-
                                                                                     surveys/acs/microdata.html

                                             3%                                      See Appendix for more information on
                                                                                     each data source.
Medicaid Enrollment, Expenditures, and Average
Cost, by Beneficiary Category, 2017
Population: Institutionalized and non-institutionalized Medicaid beneficiaries
Total Enrollment and Expenditures
Persons with
Disabilities Average Medicaid
Ages 0-64
Expenditures Per
10.6
Persons with Beneficiary
Aged 65+ Disabilities Notes:
5.8 The Actuarial Report defines children as
Ages 0-64
ages 0 to 19. Children and adults with
$216.0 $20,359 Disabled
disabilities as their basis for eligibility are
Expansion included in the category of persons with
Adults disabilities. The Actuarial Report
Ages 20-64 includes both institutionalized and non-
12.2 institutionalized individuals; however, it
does not include CHIP enrollment.
Enrollment and expenditure totals
Aged 65+ exclude the territories. Expenditure
$15,059 Aged totals exclude collections and
Adults $87.7
adjustments, DSH expenditures, and
Ages 20-64 administration.
15.4 Expansion
Adults Expansion adults = Adults made newly
$5,669 Expansion Adults eligible for Medicaid under the
Ages 20-64 Affordable Care Act beginning in 2014
$69.0 pursuant to section
1902(a)(10)(A)(i)(VIII) of the Social
Adults Security Act [42 U.S.C. § 1396a].
Ages 20-64
Non-Disabled $5,616 Adults Source:
$86.7
Children 2018 CMS Actuarial Report (FFY 2017
Ages 0-19 data). Table 21.
27.9 Non-Disabled Available at:
Children https://www.cms.gov/files/document/201
Ages 0-19 $3,836 Children
8-report.pdf
$107.2
Enrollment (in millions) Expenditures (in billions)
17BENEFICIARY HEALTH STATUS 18
Medicaid and CHIP Beneficiary Health Status

Fast fact: The most common parent-reported health condition in
children ages 0 to 17 is asthma. The most common self-reported health
condition in adults ages 18 to 64 is hypertension.

This section of the profile shows the self-reported or parent-reported health status of
children and adults covered by Medicaid or CHIP (adults report on behalf of children
through age 17). Information is presented on health conditions and functional status,
current health status, body mass index (BMI), and smoking status (for adults).

The charts in this section include:
• Health Conditions and Functional Status of Children Enrolled in Medicaid or CHIP
• Current Health Status and BMI of Children Enrolled in Medicaid or CHIP
• Health Conditions of Adults Enrolled in Medicaid or CHIP
• Current Health Status, BMI, and Smoking Status of Adults Enrolled in Medicaid or CHIP
• Mental Health Status of Adults Enrolled in Medicaid or CHIP
• Functional Status of Adults Enrolled in Medicaid or CHIP

19
Health Conditions and Functional Status of
 Children Enrolled in Medicaid or CHIP, 2019
 Population: Non-institutionalized beneficiaries ages 0 to 17 covered by Medicaid,
 CHIP, or other state-sponsored health plans
                                                                                                  Notes:
                                                                                                  Data include all non-institutionalized
                                                                                                  children under age 18 covered by Medicaid
                                                                                                  or CHIP, or other state-sponsored health
                                                                                                  plans. “ADHD or ADD,” “Autism,” “Learning
 Has ever been told he/she has:                                                                   disability,” and “Uses equipment for mobility”
                                                                                                  are limited to children age 2 and up.
                                                                                                  Questions on functioning and disability are
                                                                                                  part of sets of international standard
                                      Asthma                                      14.3%           measures developed, tested, and endorsed
                                                                                                  by the Washington Group on Disability
                              ADHD or ADD                               10.6%                     Statistics. Questions ask about the child’s
                                                                                                  level of difficulty in basic domains of
                          Learning disability                          10.0%                      functioning including seeing, hearing,
                                                                                                  mobility, dexterity, self-care, communication,
                                                                                                  cognition, playing, learning, relationships,
                 Other developmental delay                      6.5%                              and behavior. Composite disability
                                                                                                  indicators are designed to include domains
                                       Autism            3.5%                                     of functioning relevant for each age group
                                                                                                  (ages 2-4 and ages 5-17); as a result, these
                        Intellectual disability      2.7%                                         categories are shown separately.
                                                                                                  Responses of “refused,” “not ascertained,”
                                                                                                  and “don’t know” (
Current Health Status and BMI of Children
Enrolled in Medicaid or CHIP, 2018-2019
Population: Non-institutionalized beneficiaries ages 0 to 17 covered by Medicaid,
CHIP, or other state-sponsored health plans
Health Status:
Notes:
Data include all non-institutionalized children
under age 18 covered by Medicaid, CHIP, or
Parent-Reported Current
other state-sponsored health plan.
Parent-Reported Body Mass Responses of “refused,” “not ascertained,”
Health Status (2019) Index (BMI) (2018) and “don’t know” (Health Conditions of Adults Enrolled in Medicaid
or CHIP, 2019
Population: Non-institutionalized beneficiaries ages 18 to 64 covered by Medicaid,
CHIP, or other state-sponsored health plans
Has ever been told he/she has:
Hypertension 30.3%
Depression 27.4%
Notes:
Anxiety disorder 25.3% Data include all non-institutionalized
civilian adults ages 18 to 64 covered by
Arthritis 21.7% Medicaid, CHIP, or other state-
sponsored health plans. All data on
Asthma 20.1% health conditions are based on self-
report. “Anxiety disorder” includes
High cholesterol 20.0% generalized anxiety disorder, social
anxiety disorder, panic disorder, post-
Prediabetes 13.7% traumatic stress disorder, obsessive-
compulsive disorder, and phobias.
Diabetes 11.0% “Pregnant (currently)” is limited to female
respondents ages 18 to 49. Responses
COPD, emphysema, or chronic bronchitis 7.5% of “refused,” “not ascertained,” and
“don’t know” (Current Health Status, BMI, and Smoking Status
of Adults Enrolled in Medicaid or CHIP, 2019
Population: Non-institutionalized beneficiaries ages 18 to 64 covered by Medicaid,
CHIP, or other state-sponsored health plans
Notes:
Self-Reported Current Health Status Self-Reported Body Mass Index (BMI) Data include all non-institutionalized civilian
adults ages 18 to 64 covered by Medicaid,
Underweight (BMIMental Health Status of Adults Enrolled in
Medicaid or CHIP, 2019
Population: Non-institutionalized beneficiaries ages 18 to 64 covered by Medicaid,
CHIP, or other state-sponsored health plans
Notes:
Moderate to Severe Depressive or Anxiety Symptoms, by Age and Sex Data include all non-institutionalized civilian
adults ages 18 to 64 covered by Medicaid,
20.4% CHIP, or other state-sponsored health
plans. Depressive symptoms are measured
using the 8-item Patient Health
17.6% 17.2% Questionnaire depression scale (PHQ-8).
16.9%
15.8% 16.2% Anxiety symptoms are measured using the
7-item Generalized Anxiety Disorder scale
14.3% 14.6% (GAD-7). The set of questions in the PHQ-8
13.6%
and GAD-7 ask adults to assess how often
11.5% they have been bothered over the last 2
10.3% weeks by a set of specific symptoms. In
9.4% both scales, a score of 10-14 indicates
moderate symptoms and a score of 15 or
higher indicates severe symptoms. Note that
adults could report both anxiety and
depressive symptoms. Among those with
symptoms, receipt of counselling or therapy
from a mental health professional is based
on self-report. Responses of “not
ascertained” on depression and anxiety
scales (4% of responses) and of “refused,”
“not ascertained,” and “don’t know” to
Overall Ages 18 to 29 Ages 30 to 44 Ages 45 to 64 Male Female receipt of therapy (2% of responses) are
excluded from the respective exhibits.
Depressive symptoms Anxiety Symptoms
Source:
Mathematica analysis of National Center for
Health Statistics, National Health Interview
Percentage with Survey, 2019.
Moderate to Severe Available at:
Depressive or Anxiety Depressive symptoms 45.1% https://www.cdc.gov/nchs/nhis/data-
questionnaires-documentation.htm
Symptoms Who
Received Counseling or See Appendix for more information on the
data source.
Therapy from a Mental Anxiety symptoms 42.7%
Health Professional in
Past Year
24Functional Status of Adults Enrolled in Medicaid
or CHIP, 2018 & 2019
Population: Non-institutionalized beneficiaries ages 18 to 64 covered by Medicaid,
CHIP, or other state-sponsored health plans
Notes:
Disability status: Data include all non-institutionalized civilian
adults ages 18 to 64 covered by Medicaid,
CHIP, or other state-sponsored health plans.
Has a disability 17.2% “Has lost all natural teeth” comes from the
2018 National Health Interview Survey
(NHIS); all other indicators come from the
2019 NHIS. Questions on functioning and
Has difficulty walking or climbing steps 10.6% disability in the 2019 survey are part of sets of
international standard measures developed,
tested and endorsed by the Washington
Has difficulty remembering or concentrating 5.6% Group on Disability Statistics. Questions ask
about adults’ level of difficulty in six domains:
seeing, hearing, mobility, communication,
Has difficulty seeing even when wearing glasses 2.6% cognition, and self-care. Adults are
categorized as having difficulty with a domain
if they report that they “have a lot of difficulty”
Has difficulty communicating 2.5% or “cannot do at all.” (Other response options
are “no difficulty” and “some difficulty.”) “Has a
disability” identifies adults who “have a lot of
difficulty” with or “cannot do at all” at least one
Has difficulty with self care 2.3% of six domains. Adults who report
experiencing pain “most days” or “every day”
during the past 3 months are categorized as
Has difficulty hearing even when using a hearing aid 1.9% having chronic pain. Responses of “refused,”
“not ascertained,” and “don’t know” (3% of
responses for chronic pain andBENEFICIARY ACCESS AND
UTILIZATION
26Beneficiary Access and Utilization
Fast fact: Behavioral health conditions1 were the most common
condition for which people under age 65 with public insurance reported
receiving care, followed by chronic obstructive pulmonary disease,
asthma, and other respiratory conditions.
This section of the profile shows where Medicaid and CHIP beneficiaries receive care, the
types of providers they see, the conditions for which they reported seeking care, their
usual source of care, and their difficulties in receiving needed care.
The charts in this section include:
• Percentage of Births Covered by Medicaid, by State
• Self-Reported Health Care Utilization Among Children Covered by Medicaid or CHIP
• Self-Reported Health Care Utilization Among Adults Covered by Medicaid or CHIP
• Percentage of Adults Up-to-Date on Colorectal Cancer Screening by Current Insurance
Coverage
• Percentage of People with Public Insurance who Reported Receiving Care for Selected
1 Behavioral health conditions include
Conditions substance use disorders and mental
• Usual Source of Care and Difficulty Receiving Care Among People with Public health conditions. These types of
conditions are coded as “mental
Insurance disorders” in the Medical Expenditure
Panel Survey (MEPS) Household
Component Tables. See slide 32 for
more information on how health
conditions are classified in MEPS.
27Percentage of Births Covered by Medicaid, by
State, 2019
Population: All births with Medicaid as primary payer
Nationally, 42.1% of
births in 2019 were
covered by Medicaid.
Note:
Births where Medicaid is the principal
payer for the delivery are shown.
Percentages were rounded to one
decimal place, and then states were
assigned to quartiles.
Source:
National Center for Health Statistics
(NCHS). 2019 Natality Public Use Data
on CDC WONDER online database.
Available at:
https://wonder.cdc.gov/
28Self-Reported Health Care Utilization Among
Children Covered by Medicaid or CHIP, 2019
Population: Non-institutionalized beneficiaries ages 0 to 17 covered by Medicaid,
CHIP, or state-sponsored health plans
Notes:
Type of Care Percentage of Beneficiaries with at Least 1 Visit Data include all non-institutionalized children
in the Past 12 Months, By Type of Visit under age 18 covered by Medicaid, CHIP, or
other state-sponsored health plans. “Had at
96.5%
least 1 visit to a doctor or other health
Well visit professional” excludes dental visits and
95.3%
includes inpatient hospital stays. “Mental
health counseling or therapy” includes
Dental exam or cleaning 84.1% children ages 2 to 17. “Dental exam or
cleaning,” and “Had at least 1 overnight
stay” includes children ages 1 to 17. “Well
Eye exam 42.7% visit” is defined as any visit to a “doctor or
other health professional for a well child
visit, physical, or general purpose check-up.”
Mental health counseling or therapy 10.6% “Well visit,” “dental exam or cleaning,” “eye
exam,” “mental health counseling or
therapy,” and “PT, speech therapy, rehab, or
PT, speech therapy, rehab, or OT 9.5% OT” include services from multiple types of
providers. Responses of “refused,” “not
ascertained,” and “don’t know” (≤1% of
responses for each indicator) are excluded.
Number of Visits to ED Total number of ED visits may not sum to
100 due to rounding.
ED = Emergency Department; PT = Physical
No visits 74.6% Therapy; OT = Occupational Therapy;
Rehab = Rehabilitation
1 visit 15.0% Source:
25.3% Mathematica analysis of National Center for
Health Statistics, National Health Interview
Survey, 2019.
2-3 visits 8.8%
Available at:
https://www.cdc.gov/nchs/nhis/data-
4 or more visits 1.5% questionnaires-documentation.htm
4.2% See Appendix for more information on the
1.9% data source.
Had at least 1 visit Had at least 1 ED Had at least 1 Received care at
to a doctor or other visit overnight hospital home
health professional stay
29Self-Reported Health Care Utilization Among
Adults Covered by Medicaid or CHIP, 2019
Population: Non-institutionalized beneficiaries ages 18 to 64 covered by Medicaid,
CHIP, or state-sponsored health plans
Percentage with at Least 1 Visit in the
Type of Care
Past 12 Months, By Type of Visit Notes:
Data include all non-institutionalized
Well visit 80.3% civilian adults ages 18 to 64 covered by
Medicaid, CHIP, or other state-
86.9% sponsored health plans. “Had at least 1
Dental exam or cleaning 55.6% visit to a doctor or other health
professional” excludes dental visits and
includes inpatient hospital stays. “Well
Eye exam 46.4% visit” is defined as any visit to a “doctor
or other health professional for a
wellness visit, physical, or general
Mental health counselling or therapy 16.6% purpose check-up.” “Well visit,” “dental
exam or cleaning,” “eye exam,” “mental
health counseling or therapy,” and “PT,
PT, speech therapy, rehab, or OT 13.3% speech therapy, rehab, or OT” include
services from multiple types of
providers. Responses of “refused,” “not
Number of Visits to ED ascertained,” and “don’t know” (≤2% of
responses for each indicator) are
excluded.
No visits 62.0%
38.0% ED = Emergency Department; PT =
Physical Therapy; OT = Occupational
Therapy; Rehab = Rehabilitation
1 visit 19.4%
Source:
Mathematica analysis of National Center
2-3 visits 12.8% for Health Statistics, National Health
Interview Survey, 2019.
13.9% 4 or more visits Available at:
5.8%
https://www.cdc.gov/nchs/nhis/data-
questionnaires-documentation.htm
5.2%
See Appendix for more information on
the data source.
Had at least 1 visit Had at least 1 ED Had at least 1 Received care at
to a doctor or other visit overnight hospital home
health professional stay
30Percentage of Adults Up-to-Date on Colorectal
Cancer Screening, 2019
Population: Non-institutionalized U.S. population ages 50 to 75
Notes:
Data include all non-institutionalized civilian
adults ages 50 to 75. Being up-to-date
consisted of a home blood stool test within
the past year, sigmoidoscopy within the past
5 years, colonoscopy within the past 10
years, computed tomography colonography
81.4% within the past 5 years, OR a stool DNA test
within the past 3 years. All data are based
on self-report. “Medicaid (non-duals)”
includes individuals covered by Medicaid or
70.3% 70.6% other state-sponsored health plans alone or
in combination with private insurance but
excludes individuals dually eligible for
Medicaid and Medicare, who are shown
separately. “Medicare (non-duals)” includes
individuals covered by Medicare alone or in
combination with private insurance but
51.2% excludes individuals dually eligible for
Medicaid and Medicare. “Private coverage”
includes coverage obtained through
employment or directly purchased, including
military coverage and Medigap plans, and
excludes individuals who also report either
33.9% Medicaid or Medicare coverage. 3% of
respondents with missing information on
colorectal cancer screening are excluded
from the exhibit.
Source:
Mathematica analysis of National Center for
Health Statistics, National Health Interview
Survey, 2019.
Available at:
https://www.cdc.gov/nchs/nhis/data-
questionnaires-documentation.htm
Medicaid (non- All dually eligible Medicare (non- Private coverage No current
See Appendix for more information on the
duals) beneficiaries duals) coverage data source.
31Percentage of People with Public Insurance who
Reported Receiving Care for Selected Conditions, 2018
Population: Non-institutionalized beneficiaries under age 65 with public insurance
only
Notes:
Mental disorders 19.4% Data are shown for the U.S. civilian non-
institutionalized population under age 65
COPD, asthma, and other respiratory conditions 14.4% with public insurance only. Individuals are
considered to have only public health
Osteoarthritis and other non-traumatic joint disorders insurance coverage if they were not covered
13.8%
by private insurance or TRICARE and they
were covered by Medicare, Medicaid, or
Nervous system disorders 13.1% other public coverage at some point during
the year. Medical conditions are self-
Hypertension 12.3% reported and based on conditions for which
treatment was received, where treatment
Trauma-related disorders 8.8% includes emergency room visits, home
health care, inpatient stays, office-based
visits, outpatient visits, and prescription
Acute bronchitis and URI 8.7% medicine purchases. Other medical
equipment and services and dental visits are
Infectious disease 8.4% excluded. “Mental disorders” include
substance use disorders and mental health
Hyperlipidemia 8.1% conditions. The following categories were
excluded from this chart: Symptoms and
Skin disorders 8.0% Other Care and Screening. Starting in 2016,
medical conditions were coded into ICD-10
and CCSR codes before collapsing into
Allergic reactions 7.3% condition categories. AHRQ recommends
caution when comparing data on medical
Diabetes mellitus 6.7% conditions before and after this transition.
Other stomach and intestinal disorders 6.3% COPD = Chronic Obstructive Pulmonary
Disease; URI = Upper Respiratory Infection
Disorders of mouth and esophagus 5.3% Source:
Agency for Healthcare Research and
Other eye disorders 5.1% Quality, Medical Expenditure Panel Survey
(MEPS) Household Component Tables,
Other endocrine, nutritional & immune disorder 4.6% 2018 data.
Heart disease 4.6% Available at:
https://meps.ahrq.gov/mepstrends/home/ind
ex.html
Otitis media and related conditions 4.3%
Influenza 4.3%
Chart continued on the next slide.
Back problems 4.2%
32Percentage of People with Public Insurance who Reported
Receiving Care for Selected Conditions, 2018 (Continued)
Population: Non-institutionalized beneficiaries under age 65 with public insurance
only
Thyroid disease 3.8% Notes:
Data are shown for the U.S. civilian non-
institutionalized population under age 65
Other circulatory conditions of arteries, veins, and lymphatics 3.1% with public insurance only. Individuals are
considered to have only public health
Headache 3.1% insurance coverage if they were not covered
by private insurance or TRICARE and they
were covered by Medicare, Medicaid, or
Female genital disorders, and contraception 3.1% other public hospital and physician coverage
at some point during the year. Medical
Systemic lupus and connective tissues disorders 3.0% conditions are self-reported and based on
conditions for which treatment was received,
where treatment includes emergency room
Normal pregnancy/birth, and live born 2.4% visits, home health care, inpatient stays,
office-based visits, outpatient visits, and
Other bone and musculoskeletal disease 2.4% prescription medicine purchases. Other
medical equipment and services and dental
visits are excluded. The following generic
Disorders of teeth and jaws 2.2% categories were excluded from this chart:
Symptoms and Other Care and Screening.
Cancer 2.2% Starting in 2016, household-reported
medical conditions were coded into ICD-10
and CCSR codes before collapsing into
Disorders of the upper GI 2.0% condition categories. AHRQ recommends
extreme caution when comparing data on
Kidney Disease 2.0% medical conditions before and after this
transition.
Urinary tract infections 2.0% GI = Gastrointestinal
Epilepsy and convulsions Source:
1.6%
Agency for Healthcare Research and
Quality, Medical Expenditure Panel Survey
Other genitourinary condition 1.4% (MEPS) Household Component Tables,
2018 data.
Pneumonia 1.4% Available at:
https://meps.ahrq.gov/mepstrends/home/ind
Intestinal infection 1.1% ex.html
Gallbladder, pancreatic, and liver disease 1.1%
Cerebrovascular disease 1.1%
33Usual Source of Care and Difficulty Receiving Care
Among People with Public Insurance, 2017 & 2018
Population: Non-institutionalized beneficiaries under age 65 with public insurance
only
Usual Source of Care (2018)
Notes:
Data are shown for the U.S. civilian non-
institutionalized population under age 65
with public insurance only. Individuals are
considered to have only public health
insurance coverage if they were not covered
by private insurance or TRICARE and they
were covered by Medicare, Medicaid, or
Hospital (not other public hospital and physician coverage
ER), 26.0% at some point during the year. For each
individual family member, the respondent is
Office- asked whether there is a particular doctor's
based, 52.3% office, clinic, health center, or other place
that the individual usually goes to if he/she
Emergency is sick or needs advice about his/her health.
room, 0.5% “Office-based” includes doctor’s office, clinic,
No usual source and health centers. “Hospital (not ER)”
includes hospital clinics and outpatient
of health care,
departments. “Difficulty receiving needed
21.2% care” categories are not mutually exclusive.
For example, a person can have difficulty
Percentage Reporting Difficulty
obtaining both medical and dental care.
Difficulty receiving care is shown for 2017
Receiving Needed Care (2017) because this topic was not assessed in the
2018 survey.
ER = Emergency Room
Any care 11.3%
Source:
Agency for Healthcare Research and
Quality, Medical Expenditure Panel Survey
Dental care 5.9% (MEPS) Household Component Tables,
2017 & 2018 data.
Available at:
Medical care 5.2% https://meps.ahrq.gov/mepstrends/home/ind
ex.html
Prescription medicines 4.0%
34BENEFICIARY EXPENDITURES 35
Beneficiary Expenditures

Fast fact: Managed care capitation payments are the largest category
of Medicaid program expenditures overall and for three of the four
beneficiary categories (children, adults, and persons with disabilities);
nursing facility expenditures are the largest category for beneficiaries
age 65 and older.

This section of the profile shows annual Medicaid expenditures by service category overall
and by beneficiary category.

The charts in this section include:
• Annual Medicaid Expenditures by Service Category
• Annual Medicaid Expenditures by Service Category and Beneficiary Category

36
Annual Medicaid and CHIP Expenditures by
                      Service Category (billions of dollars), 2018
                      Source: Medicaid & CHIP Scorecard

                                                                                                                                 Notes:
                                                                                                                                 Expenditures by service category do not
                                                                                                                                 sum to the total expenditures. Total
                           $296                                                                                                  expenditures also include Medicare
                                                                                                                                 payments for some beneficiaries and
                                                                                                                                 adjustments to prior year payments.
                                                                                                                                 Managed care expenditures cover the
                                                                                                                                 same services that are delivered via fee-
                                                                                                                                 for-service. Data do not permit allocation
                                                                                                                                 of managed care expenditures to the
                                                                                                                                 different service categories. Data are for
Billions of dollars

                                                                                                                                 Federal Fiscal Year 2018. Note that
                                                                                                                                 there are discrepancies between the
                                                                                                                                 expenditure totals in this slide and on
                                                                                                                                 slide 38 as they rely on different data
                                                                                                                                 sources.

                                                                                                                                 Source:
                                                                                                                                 CMS. 2020 Medicaid & CHIP Scorecard.
                                         $125                                                                                    Analysis of CMS-64 expenditure reports
                                                                                                                                 for FFY 2018 from the Medicaid Budget
                                                                                                                                 and Expenditure System/State
                                                           $99                                                                   Children's Health Insurance Program
                                                                                                                                 Budget and Expenditure System
                                                                                                                                 (MBES/CBES).
                                                                              $62
                                                                                                                                 Available at:
                                                                                                                                 https://www.medicaid.gov/state-
                                                                                                                                 overviews/scorecard/annual-medicaid-
                                                                                                                     $29
                                                                                                                                 chip-expenditures/index.html
                                                                                                 $11
                                                                                                                                 Additional information available at:
                                                                                                                                 https://www.medicaid.gov/medicaid/fina
                                                                                                                                 ncial-management/state-expenditure-
                      Managed care   Long-term care      Physician,     Inpatient services Prescription drugs   Administrative
                                                                                                                                 reporting-for-medicaid-chip/expenditure-
                                                      laboratory, and                                                            reports-mbescbes/index.html
                                                       other services
                                                         Fee-for-service payments

                      37
Annual Medicaid Expenditures by Service Category and
Beneficiary Category (billions of dollars), 2017
Source: CMS Actuarial Report
Children Adults
(in billions) (in billions)
Managed care $69.9 Managed care $59.8
Notes:
This chart shows projected values for
Inpatient hospital $10.8 Inpatient hospital $12.8 the highest Medicaid expenditure
categories for each population as
Prescription drugs $4.1 reported in the CMS Actuarial Report.
Outpatient hospital $3.7 “Other” includes the remaining
categories not broken out in the CMS
Outpatient hospital $2.6 Prescription drugs $2.5 Actuarial Report. Prescription drug
expenditures do not include Medicaid
prescription drug rebates. This exhibit is
Physician services $2.5 Physician services $2.0 based on expenditure projections in the
2018 CMS Actuarial Report. Due to the
lack of more recent data, these
Other $17.3 Other $5.9 projections are subject to considerable
uncertainty. Children include ages 0–19
(not disabled). Adults include ages 20–
64 (not disabled). Persons with
Persons with Disabilities Age 65 and Older
disabilities include ages 0–64. Note that
there are discrepancies between the
(in billions) (in billions) expenditure totals in this slide and on
slide 37 as they rely on different data
Managed care $69.2 sources.
Nursing facility $32.4
HCBS = Home and Community-Based
HCBS waivers $44.3 Managed care $19.7 Services.
Source:
Inpatient hospital $19.7 HCBS waivers $7.8 2018 CMS Actuarial Report (FFY 2017
data). Tables 7, 9, 11, and 13.
Prescription drugs $11.4 Medicare Part B premiums $7.3
Available at:
https://www.cms.gov/files/document/201
Nursing facility $10.3 Inpatient hospital $3.1 8-report.pdf
Personal care $2.2
Other $61.1
Other $15.2
38BENEFICIARY EXPERIENCE 39
Beneficiary Experience

Fast fact: The Consumer Assessment of Healthcare Providers and Systems
(CAHPS) Health Plan Survey captures the experience of Medicaid and CHIP
beneficiaries. The Agency for Healthcare Research and Quality (AHRQ) CAHPS
Database includes data submitted directly by state Medicaid agencies or
individual health plans. The data are submitted voluntarily to the CAHPS
Database and are not from a statistically representative sample of all plans.
They are not representative of all plans, enrollees, or states.                            Notes:
                                                                                           The results from the AHRQ CAHPS
                                                                                           Database are based on data collected
This section of the profile shows data from the AHRQ CAHPS Database, including how the     between July 2019 and July 2020. The
                                                                                           Child Medicaid results include 56,311
experiences of Medicaid children and adults vary overall and across key dimensions of      respondents across 137 plans in 35
getting needed care, getting care quickly, how well doctors communicate, and health plan   states. The Adult Medicaid results
                                                                                           include 51,211 respondents across 159
information and customer service.                                                          plans in 37 states. The Child Medicaid
                                                                                           results from eight states account for
                                                                                           54% of responses and Adult Medicaid
                                                                                           results from eight states account for
The charts in this section include:                                                        61% of responses. Thus, the estimates
                                                                                           may be biased, and it is not possible to
•    Percentage Distribution of Child Survey Respondents By State                          compute precision estimates from the
•    Percentage Distribution of Adult Survey Respondents By State                          data. See the maps on the following
                                                                                           pages for more information on the
•    Overall Ratings                                                                       percentage distribution of survey
                                                                                           respondents by state for the Child and
•    Getting Needed Care                                                                   Adult Medicaid surveys.
•    Getting Care Quickly
                                                                                           Source:
•    How Well Doctors Communicate                                                          Agency for Healthcare Research and
•    Health Plan Information and Customer Service                                          Quality, CAHPS Health Plan Survey
                                                                                           Database 2020 Chartbook.

                                                                                           Available at:
                                                                                           https://cahpsdatabase.ahrq.gov/files/202
                                                                                           0CAHPSHealthPlanChartbook.pdf

40
Percentage Distribution of Child Medicaid CAHPS
Survey Respondents By State, 2020
Population: Beneficiaries enrolled in Medicaid who responded to the survey
Notes:
The Agency for Healthcare Research
and Quality (AHRQ) CAHPS
Database includes data submitted
directly by state Medicaid agencies or
individual health plans. The data are
submitted voluntarily to the CAHPS
Database and are not from a statistically
representative sample of all plans. They
are not representative of all plans,
enrollees, or states. These results are
based on data collected between July
2019 and July 2020. The Child Medicaid
results include 56,311 respondents
across 137 plans in 35 states. Results
from eight states account for 54% of
responses. States excluded from this
analysis include those that did not
conduct the Child Medicaid CAHPS
survey or that did not submit data to the
AHRQ CAHPS Database.
Source:
Agency for Healthcare Research and
Quality, CAHPS Health Plan Survey
Database 2020 Chartbook.
Available at:
https://cahpsdatabase.ahrq.gov/files/202
0CAHPSHealthPlanChartbook.pdf
41Percentage Distribution of Adult Medicaid CAHPS
Survey Respondents By State, 2020
Population: Beneficiaries enrolled in Medicaid who responded to the survey
Notes:
The Agency for Healthcare Research
and Quality (AHRQ) CAHPS
Database includes data submitted
directly by state Medicaid agencies or
individual health plans. The data are
submitted voluntarily to the CAHPS
Database and are not from a statistically
representative sample of all plans. They
are not representative of all plans,
enrollees, or states. These results are
based on data collected between July
2019 and July 2020. The Adult Medicaid
results include 51,211 respondents
across 159 plans in 37 states. Results
from eight states account for 61% of
responses. States excluded from this
analysis include those that did not
conduct the Adult Medicaid CAHPS
survey or that did not submit data to the
AHRQ CAHPS Database.
Source:
Agency for Healthcare Research and
Quality, CAHPS Health Plan Survey
Database 2020 Chartbook.
Available at:
https://cahpsdatabase.ahrq.gov/files/202
0CAHPSHealthPlanChartbook.pdf
42Overall Ratings: Percentage of Survey Respondents
Selecting a Rating of 9 or 10 out of 10, 2020
Population: Beneficiaries enrolled in Medicaid who responded to the survey
69%
Overall rating of personal doctor
78%
Notes:
The results from the AHRQ CAHPS
Database are based on data collected
69% between July 2019 and July 2020. The
Child Medicaid results include 56,311
Overall rating of specialist respondents across 137 plans in 35
74% states. The Adult Medicaid results
include 51,211 respondents across 159
plans in 37 states. The Child Medicaid
results from eight states account for
56% 54% of responses and Adult Medicaid
Overall rating of health care results from eight states account for
61% of responses. Values represent
70% responses of 9 or 10 on a scale of 0 to
10. Child Medicaid excludes CHIP. Due
to the variability in response rates from
different states, the data presented in
61% this exhibit are not nationally
Overall rating of health plan representative.
71% Source:
Agency for Healthcare Research and
Quality, CAHPS Health Plan Survey
Database 2020 Chartbook.
Adult Medicaid Child Medicaid
Available at:
https://cahpsdatabase.ahrq.gov/files/202
0CAHPSHealthPlanChartbook.pdf
43Getting Needed Care: Percentage of Survey
Respondents Selecting ‘Always’, 2020
Population: Beneficiaries enrolled in Medicaid who responded to the survey
55% Notes:
Getting Needed Care Composite The results from the AHRQ CAHPS
Database are based on data collected
61% between July 2019 and July 2020. The
Child Medicaid results include 56,311
respondents across 137 plans in 35
states. The Adult Medicaid results
include 51,211 respondents across 159
58% plans in 37 states. The Child Medicaid
results from eight states account for
Easy to get necessary care, tests, or treatment 54% of responses and Adult Medicaid
results from eight states account for
68% 61% of responses. Values represent
responses of ‘Always.’ Child Medicaid
excludes CHIP. “Getting Needed Care
Composite” combines responses to the
two individual questions. Due to the
52% variability in response rates from
different states, the data presented in
Got appointment with specialists as soon as needed this exhibit are not nationally
representative.
55%
Source:
Agency for Healthcare Research and
Quality, CAHPS Health Plan Survey
Database 2020 Chartbook.
Available at:
Adult Medicaid Child Medicaid https://cahpsdatabase.ahrq.gov/files/202
0CAHPSHealthPlanChartbook.pdf
44Getting Care Quickly: Percentage of Survey
Respondents Selecting ‘Always’, 2020
Population: Beneficiaries enrolled in Medicaid who responded to the survey
59% Notes:
Getting Care Quickly Composite The results from the AHRQ CAHPS
Database are based on data collected
73% between July 2019 and July 2020. The
Child Medicaid results include 56,311
respondents across 137 plans in 35
states. The Adult Medicaid results
include 51,211 respondents across 159
63% plans in 37 states. The Child Medicaid
Got care for illness, injury or condition as soon as results from eight states account for
54% of responses and Adult Medicaid
needed results from eight states account for
79% 61% of responses. Values represent
responses of ‘Always.’ Child Medicaid
excludes CHIP. “Getting Care Quickly
Composite” combines responses to the
two individual questions. Due to the
55% variability in response rates from
different states, the data presented in
Got non-urgent appointment as soon as needed this exhibit are not nationally
67% representative.
Source:
Agency for Healthcare Research and
Quality, CAHPS Health Plan Survey
Database 2020 Chartbook.
Adult Medicaid Child Medicaid
Available at:
https://cahpsdatabase.ahrq.gov/files/202
0CAHPSHealthPlanChartbook.pdf
45How Well Doctors Communicate: Percentage of
Survey Respondents Selecting ‘Always’, 2020
Population: Beneficiaries enrolled in Medicaid who responded to the survey
77%
How Well Doctors Communicate Composite
81%
Notes:
The results from the AHRQ CAHPS
Database are based on data collected
77% between July 2019 and July 2020. The
Doctor explained things in a way that was easy to
Child Medicaid results include 56,311
understand respondents across 137 plans in 35
84%
states. The Adult Medicaid results
include 51,211 respondents across 159
plans in 37 states. The Child Medicaid
78% results from eight states account for
Doctor listened carefully 54% of responses and Adult Medicaid
84% results from eight states account for
61% of responses. Values represent
responses of ‘Always.’ Child Medicaid
excludes CHIP. “How Well Doctors
82% Communicate Composite” combines
Doctor showed respect for what beneficiary had
responses to the five individual
to say questions for Child Medicaid and four
88%
individual questions for Adult Medicaid.
Due to the variability in response rates
from different states, the data presented
Child Only - Child's doctor explained things in a in this exhibit are not nationally
representative.
way that was easy for child to understand
78%
Source:
Agency for Healthcare Research and
Quality, CAHPS Health Plan Survey
71% Database 2020 Chartbook.
Doctor spent enough time with beneficiary
72% Available at:
https://cahpsdatabase.ahrq.gov/files/202
0CAHPSHealthPlanChartbook.pdf
Adult Medicaid Child Medicaid
46Health Plan Information and Customer Service:
Percentage of Survey Respondents Selecting ‘Always’,
2020
Population: Beneficiaries enrolled in Medicaid who responded to the survey
69% Notes:
Health Plan Information and Customer Service The results from the AHRQ CAHPS
Database are based on data collected
Composite between July 2019 and July 2020. The
68% Child Medicaid results include 56,311
respondents across 137 plans in 35
states. The Adult Medicaid results
include 51,211 respondents across 159
plans in 37 states. The Child Medicaid
59% results from eight states account for
Customer service gave necessary information or help 54% of responses and Adult Medicaid
results from eight states account for
59% 61% of responses. Values represent
responses of ‘Always.’ Child Medicaid
excludes CHIP. “Health Plan Information
and Customer Service Composite”
combines responses to the two
79% individual questions. Due to the
variability in response rates from
Customer service staff courteous and respectful
different states, the data presented in
78% this exhibit are not nationally
representative.
Source:
Agency for Healthcare Research and
Quality, CAHPS Health Plan Survey
Adult Medicaid Child Medicaid Database 2020 Chartbook.
Available at:
https://cahpsdatabase.ahrq.gov/files/202
0CAHPSHealthPlanChartbook.pdf
47SPECIAL POPULATION:
PEOPLE DUALLY ELIGIBLE
FOR MEDICARE AND MEDICAID
48People Dually Eligible for Medicare and Medicaid:
Overview
Fast fact: Dually eligible beneficiaries are people covered by both
Medicare and Medicaid. About 71% of dually eligible beneficiaries
receive full Medicaid benefits and the remainder (about 29%) receive
partial Medicaid benefits.
This section of the profile shows the enrollment, benefits, pathways to eligibility,
demographics, health conditions, current health status, and utilization and expenditures by
service category for dually eligible beneficiaries. For dually eligible beneficiaries, Medicare is
the primary payer for all Medicare covered services, including acute and post-acute care
services covered by that program. Medicaid provides varying levels of assistance with
Medicare premiums and cost sharing and often covers services not included in the Medicare
benefit, such as long-term services and supports (LTSS). Full-benefit dually eligible
beneficiaries receive the full range of Medicaid benefits offered in a given state. For partial-
benefit dually eligible beneficiaries, Medicaid pays Medicare premiums and may also pay the
cost sharing for Medicare services.
The charts in this section include:
• Share of Dually Eligible Beneficiaries by Type of Full and Partial Medicaid Benefits
• Percentage of Medicaid Beneficiaries who are Dually Eligible for Medicare and Medicaid
• Demographic Characteristics of Dually Eligible Beneficiaries
• Pathway to Medicaid Eligibility for Dually Eligible Beneficiaries, by Age Group
• Health Conditions of Dually Eligible Beneficiaries
• Self-Reported Current Health Status for Dually Eligible Beneficiaries
• Self-Reported Health Status Compared to One Year Ago for Dually Eligible Beneficiaries
• Self-Reported Body Mass Index (BMI) for Dually Eligible Beneficiaries
Continued on the next slide.
49You can also read