2021 Interim Results - Macfarlane Group
←
→
Page content transcription
If your browser does not render page correctly, please read the page content below

2021 Interim Results
                       1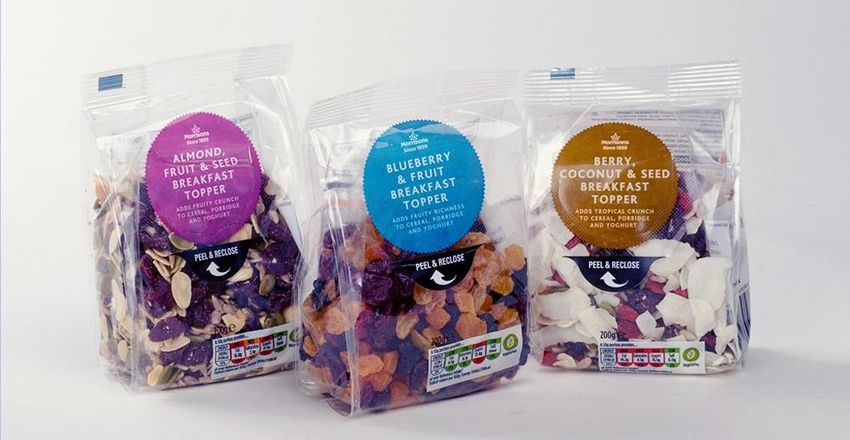
Overview
• Executive Summary
• H1 2021 Results/Cash Flow
• Business Review
Packaging Distribution
Manufacturing Operations
• Pension Scheme
• 2021 Key Actions
• Conclusions
• Appendix
2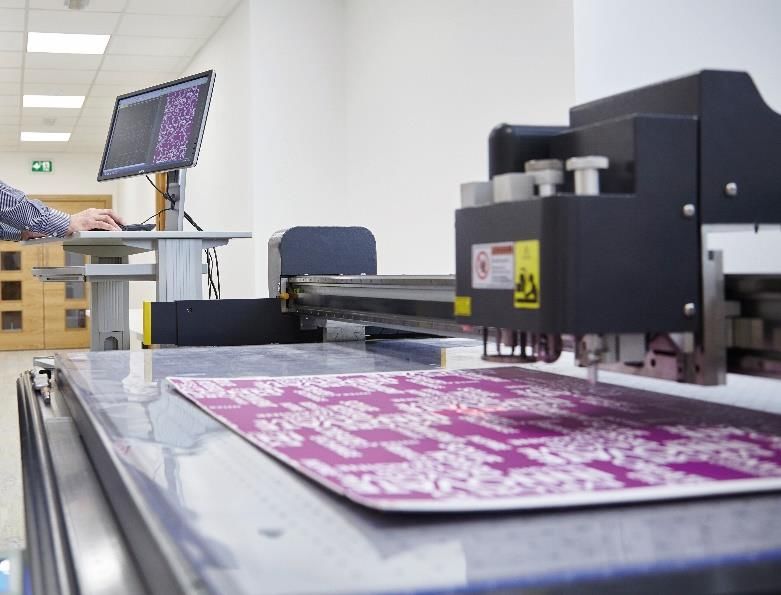
Executive Summary
                                                                                                                         H1 2020              H1 2019
                                                                                                    H1 2021
                                                                                                                        Restated*            Restated*
Operating profit before amortisation & impairment(‘PBITA’)                                           £11.1m                £5.5m                £5.9m

Profit before tax (‘PBT’)                                                                             £7.8m                £3.5m                £3.8m

•    Group sales £134m, 26% growth on H1 2020
•    PBITA £11.1m, 103% growth on H1 2020 ; PBT £7.8m, 121% growth on H1 2020
•    Distribution sales growth of 21% and PBITA growth of £3.8m reflects resilient demand from
     customers, the benefit of the Carters acquisition, strong gross margins partly offset by
     higher costs
•    Manufacturing Operations sales growth of 51% and PBITA growth of £1.8m with a strong
     recovery from Design and Manufacture and the benefit of the GWP acquisition
•    Impairment of historic goodwill in the Manufacturing Operations of £1.0m
•    Pension in £4.6m surplus, an improvement of £6.1m from H1 2020; reduced contributions
     commenced from May 2021
•    Net bank debt of £8.7m increased by £8.1m in H1 2020 following acquisition costs of
     £12.2m
•    Interim dividend of 0.87p per share payable 14 October 2021, with a record date 17
     September 2021 (H1 2020: 0.70p per share)
*   2020/2019 restated to reflect the rectification of backdated customs duties on export business in the Manufacturing Operations (previously 2020 Profit
    before Tax : £3.5m; 2019 Profit before Tax £3.8m)

                                                                                                                                                             3
Financial Summary – H1 2021
Revenue PBT PBITA
Revenue and profit ▲ ▲ ▲
26% 121% 103%
Pre-tax ROCE Bank debt Pension in surplus
Returns and
balance sheet
▲ ▲
19% £8.7m £4.6m
Diluted EPS Dividend cover Dividend per share
EPS and dividend ▲ ▲ ▲
112% 4.4x 0.87p
4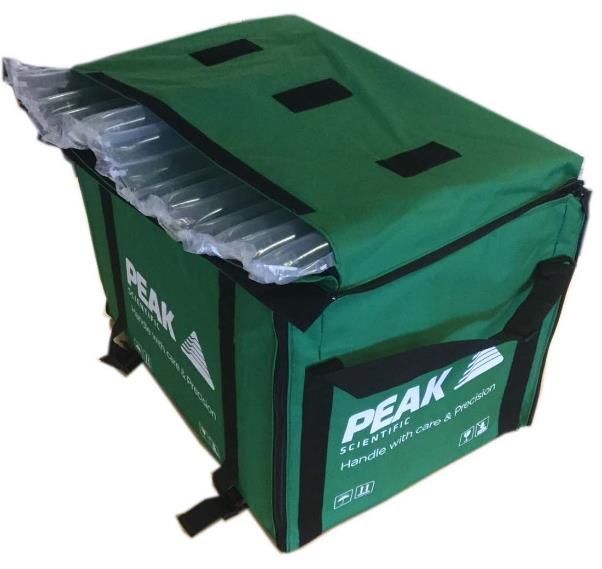
Results £m

                                                                   H1 2021                        H1 2020                        H1 2019
                                                                                                    Restated*                      Restated*

 Sales                                                                        133.5                           105.5                         107.5
 Gross profit                                                 33.9%             45.3          33.0%             34.8        30.9%              33.2
 Overheads                                                                      34.2                            29.3                           27.3
 Operating profit before
 amortisation and impairment                                                    11.1                              5.5                            5.9
 Amortisation/impairment                                                           2.6                            1.3                            1.1
 Operating profit                                                                  8.5                            4.2                            4.8
 Interest                                                                          0.7                            0.7                            1.0
 Profit before tax                                                                 7.8                            3.5                            3.8
 Diluted EPS                                                         3.79p                          1.79p                          1.95p
 Dividend                                                            0.87p                          0.70p                          0.69p
 Dividend cover                                                        4.4x                           2.6x                           2.8x
 *   2020/2019 restated to reflect the rectification of backdated customs duties on export business in the Manufacturing Operations (previously 2020
     Profit before Tax : £3.5m; 2019 Profit before Tax £3.8m)

                                                                                                                                                       5
Cash Flow £m
                                                             H1 2021          H1 2020      H1 2019
                                                                               Restated*    Restated*

  EBIT                                                           8.5             4.2           4.8
  DA                                                             7.1             5.4           5.4
  EBITDA                                                        15.6             9.6         10.2
  Working Capital                                                (0.4)            9.9          1.5
  Lease Obligations                                              (3.4)          (3.2)        (3.3)
  Interest                                                       (0.7)          (0.6)        (0.9)
  Acquisitions                                                  (12.2)          (0.9)        (2.8)
  Tax                                                            (2.0)          (0.8)        (0.9)
  Capital expenditure                                            (0.9)          (0.6)        (1.3)
  Pension                                                        (1.2)          (1.5)        (1.7)
  Dividend                                                       (2.9)                 -     (2.6)
  Movement in bank debt                                           (8.1)          11.9        (1.8)

  *   EBIT and working capital restated, no impact on movement in bank debt

                                                                                                        6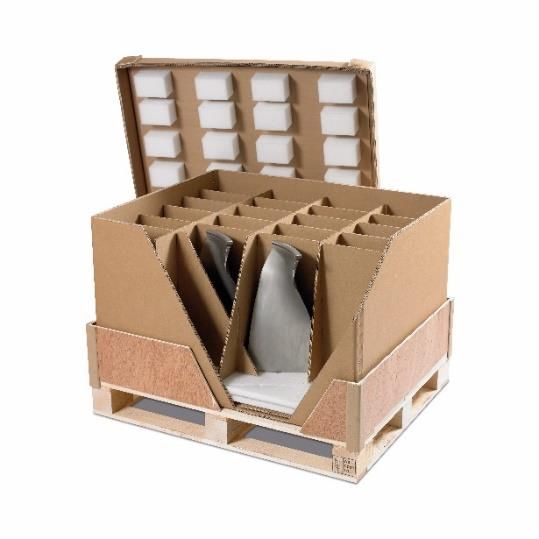
Profit Progression

  Profit £m                                                                            Earnings per share
                                    Pre-tax profit   Basic Earnings per share
   14                                                                                                7.00

   12                                                                                                6.00

   10                                                                                                5.00

    8                                                                                                4.00

    6                                                                                                3.00

    4                                                                                                2.00

    2                                                                                                1.00

    0                                                                                                0.00
        2009   2010   2011   2012   2013      2014   2015     2016     2017     2018   2019   2020

                                                                                                            7
Packaging Distribution- Financial Overview
                     £m                            H1 2021 H1 2020 H1 2019

                     Revenue                        111.0      91.5       93.1
                     Gross margin                   32.7%     32.2%      30.0%
                     Overheads                       27.2      24.2       22.4
                     PBITA                            9.1       5.3       5.6
                     PBITA Margin                    8.2%      5.8%      6.0%
                     Net Promoter Score               50        52         46
                   • Results include Carters acquisition which is performing well
                   • Organic sales increase of 19.4% versus 2020, driven by e-
                     commerce retail and recovery of some industrial sectors
                   • New business growth of £4.3m, 9% above 2019 and 47%
                     above 2020, which was impacted by Covid-19 in Q2 2020
                   • Gross margin reflects effective management of inflation in
                     input pricing on paper and polymer based products
                   • Overhead increase due to higher transport costs, increased
                     accrual for employee incentives and the acquisition.

                                                                                8
Packaging Distribution – Raw Material Movements
         £1,800                                                                                           £600

         £1,700
                                                                                                          £575

         £1,600
                                                                                                          £550
         £1,500

         £1,400                                                                                           £525

         £1,300                                                                                           £500

         £1,200
                                                                                                          £475
         £1,100

                                                                                                          £450
         £1,000

           £900                                                                                           £425
                  Q1 2019 Q2 2019 Q3 2019 Q4 2019 Q1 2020 Q2 2020 Q3 2020 Q4 2020 Q1 2021 Q2 2021
  Polymer £/tonne £1,090   £1,137   £1,115   £1,046   £1,013   £919   £1,010   £1,017   £1,322   £1,738
  Paper £/tonne    £532     £478     £460     £458     £440    £440    £438     £433     £476     £577

                                                                                                           9
Packaging Distribution- Operational Overview
• Strong demand from e-commerce retail and medical
• Recovery in automotive, home & garden and electronics
• Continued weak demand from high street retail and hospitality
• Retail c.28% (H1 2020 c.27%) of Distribution revenue with structural
  shift to on line purchasing
• Key new customer wins – Bella & Duke, Parsley Box
• Significant inflation in input prices and shortage of supply of some
  materials
• Operating cost increases due to difficultly recruiting/retaining
  staff, particularly logistics.
• Further acquisitions being progressed; execution likely in 2022
• European “Follow the Customer” programme progressing with
  J&J, Farnell, Scholle, Flowtech

                                                                         10
Packaging Distribution – Organic Growth
The Significant Six Supported by our Recent
Approach Innovation Lab Customer wins
Reduce damage Improve the
rate speed of
packing
Reduce logistics Increase
costs customer loyalty
Reduce storage Reduce admin
costs costs
11Packaging Distribution- Environmental Action Plan
• We support our customers to make an “informed choice” about the
packaging they use to reduce their environmental impact
• As a distributor we are ideally placed to provide that “informed choice”
• Key actions…………
Launched an Environmental Impact Rating Trained our sales teams to support our Expanded our range of packaging
providing clear visibility of the environmental customers to reduce material usage that is recyclable and made with
credentials of our products and waste recycled content
** Over 80% of our product families
are recyclable
**Over 70% of our product families
are made with some recycled content
** Based on weight of product families sold in 2019
12Packaging Distribution – Acquisitions 2014 to H1 2021
EBITDA
Acquisition Location Sales Placing price Integrated
multiple
Lane Reading £3m 5-6x N/A
Network Wolverhampton £9m 5-6x Sep-14 37.5p
One Bingham £5m 5x N/A
Colton Teesside £3m 5x N/A
Edward McNeil Glasgow £3m 5x N/A
Nelsons Leicester £9m 5-6x Jul-16 58.0p SRP 2023 earliest
Greenwoods Nottingham £15m 5x Sep-17 66.0p H1 2022
Tyler Leicester £2.5m 5x N/A
Harrisons Leyland £3.5m 5x N/A H2 2021
Ecopac Aylesbury £6.5m 6x N/A H1 2022
Leyland Leyland £4.0m 5x N/A H2 2021
Armagrip Durham £1.5m 5x N/A
GWP Swindon/Salisbury £13.1m 5.5x N/A Ongoing
Carters Redruth £5.3m 6x N/A Ongoing
13Macfarlane Design and Manufacture
H1 2020 H1 2019
£m H1 2021 Restated Restated
Revenue 13.0 5.5 6.9
Gross Margin 42.7% 37.1% 36.3%
PBITA 1.9 0.0 0.2
Sales to Distribution 27% 24% 20%
% of base business excluding GWP acquisition
• H1 2021 results include GWP acquisition which is
performing ahead of expectations
• Organic growth of 17.7% with strong recovery from
defence and automotive sectors offset by
continued weakness in aerospace
• New business development focused on growth
sectors- medical, electronics and defence
• Strengthened partnership with Distribution
• Effective management of inflation in input prices
and realignment of cost base in H2 2020 have
contributed to a recovery back to profit in the base
business
14Macfarlane Labels
H1 2020 H1 2019
£m H1 2021 Restated Restated
Revenue 11.4 9.8 8.9
Gross margin 31.5% 32.9% 30.5%
PBITA 0.1 0.2 0.1
Self-Ad/Reseal-it % 44/56 53/47 50/50
• Re-sealable labels revenue 17% above H1 2020 and
machinery sales higher in H1 2021
• Self-adhesive label sales down 1% versus H1 2020
• Strong demand from food sector offsetting
slowdown in household essentials sector
• Higher transport costs and adverse currency
movements impacting profitability
• Efficiency investment in new printing press in
Kilmarnock will help to offset impact of raw material
price increases
15Pension Scheme £m
H1 2021 H1 2020
Opening (deficit) (1.5) (6.5)
Ongoing accrual/Interest cost (0.1) (0.1)
Contributions 1.3 1.6
Bond yield 0.55% to 1.90% (2020 0.5%) 8.1 (8.2)
Investment returns (3.2) 7.0
Net effect of other assumptions 0.0 0.2
Closing surplus / (deficit) 4.6 (6.0)
• Increase in bond yields costs offset by LDIs
• LDI provided > 85% hedge vs. interest liabilities
• Deficit recovery contributions for 2021 £1.3m in H1; £0.6m in H2
• Contributions reducing from £3.0m per annum to £1.3m per annum from H2
2021until 2024.
16Pension Scheme Details £m
Investments H1 2021 H2 2020
Growth assets
Diversified Growth Funds 32.6 24.0
Equities 25.5 20.0
European Loan Fund 6.6 6.1
Long-term Property Fund 6.6 6.1
Matching assets
Liability-driven Investments 24.9 32.7
Cash 0.3 6.8
Total investments 96.5 95.7
Liabilities Members
Active members 10 (14) 4.3 5.7
Deferred members 187 (194) 36.1 34.3
Pensioners 366 (371) 51.5 61.8
Total liabilities 563 (579) 91.9 101.8
17Profitable Growth in Packaging Distribution
Growth Proposition Capability
Reduce total cost of
Expertise, 3PL partnerships
Retail packaging and improve
and customer referrals
sustainability
Rationalise packaging supplier UK national network
Industrial base to reduce costs and
improve sustainability IT capability
Rationalise packaging “Follow the Customer”
Geographic expansion
supplier base to reduce costs programme
Regional infill
Acquisition Experience and case studies
leveraging existing network
Performance Improvement Proposition Capability
Leverage scale
Sourcing Reduce input prices
Strategic supplier base
Reduce property costs Streamline property footprint
Operations
Reduce cost to serve Logistics best practice
18Profitable Growth in Manufacturing
Growth Proposition Capability
Leading-edge MOD
Aerospace, Medical, Unique protection for high
approved design and sector
Electronics value, fragile Items
expertise
Re-sealable Labels Ease of opening, food waste
Proven technology
reduction and brand integrity
Performance Improvement Proposition Capability
Margin protection against
Commercial Approach Activity-based pricing
volatile ordering patterns
Improved operational Selective investment and
Operations
efficiency best practice focus
19Conclusions
• Strong performance in H1 2021 driven by strength of e-commerce retail and
recovery of certain industrial sectors and the benefit of acquisitions
• H2 2021 will be challenging with further input price inflation, continuing supply
constraints and operating cost increases
• Board expects FY 2021 to be ahead of its previous expectations
• Trading Agenda:
Use “Significant Six” Programme to add value for customers and drive
organic growth in key market segments – E-Commerce Retail, National
Accounts, 3PL
Management of inflation in input prices
Actions in place for cost reduction through site consolidation and
integration
Manufacturing focus on operational efficiency and sales focus on
sustainable growth sectors
Pipeline of further acquisition targets now being pursued for 2022
• Balance Sheet Agenda:
Lower pension deficit contributions from H2 2021
Continued focus on cash generation - working capital efficiency
• Significant bank facilities in place until December 2025 to support growth plans
20Macfarlane Business Case
Strong
operating Good market Clear plans
A simple and and a track
companies positions with
flexible record of
with growth
business model performance
differentiated potential
propositions
21You can also read


