2021 NS ADCP campaign 2020-21: Annapolis Basin (Sep-Oct 2020)
←
→
Page content transcription
If your browser does not render page correctly, please read the page content below

1

2021

NS ADCP campaign 2020-21: Annapolis Basin (Sep-Oct
2020)

Prepared by:
Fundy Ocean Research Centre for Energy

 27 Parker Street · Dartmouth, Nova Scotia · B2Y 4T5

 CMAR.CA
 CMAR.CA

NS ADCP campaign 2020-21:
Annapolis Basin (Sep-Oct 2020)
Prepared for: Centre for Marine Applied Research
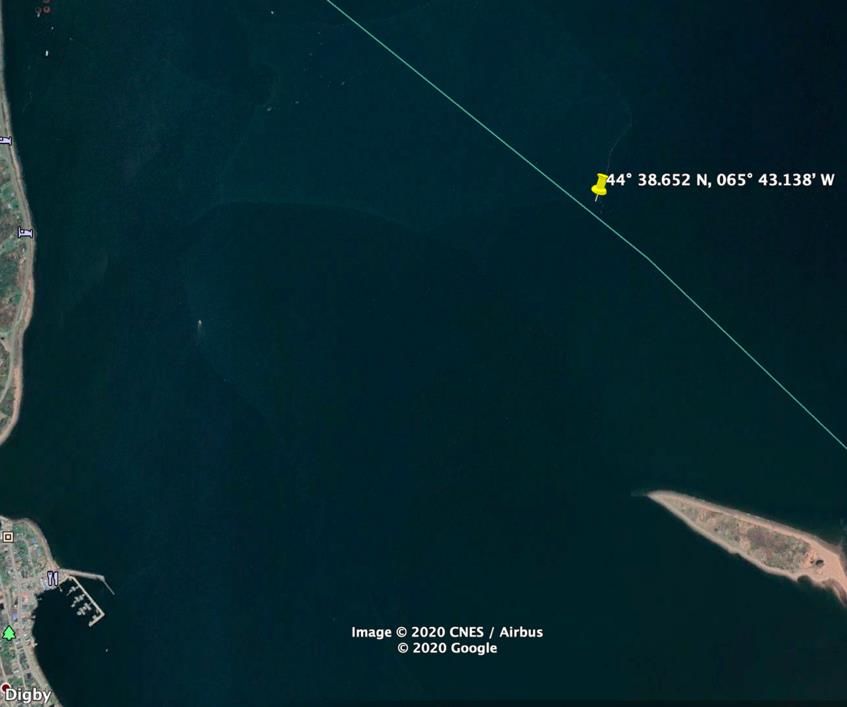
Table of Contents
1 Executive Summary ........................................................................................................ 2
2 Background and deployment parameters ....................................................................... 2
3 Raw data ....................................................................................................................... 4
4 Post-processing .............................................................................................................. 5
5 QA/QC ........................................................................................................................... 5
6 Temperature .................................................................................................................. 7
7 Averaged/Current Velocity ............................................................................................. 8
8 Wave statistics............................................................................................................. 10
Appendix A: Screenshots of the ADCP Configuration GUI ...................................................... 11

1 Executive Summary

The ADCP data collected in late summer and fall of 2020 in Annapolis Basin, Nova Scotia are of
excellent quality. There were no issues during deployment and recovery of the ADCP, the ADCP
passed with respect to internal diagnostics and QA/QC metrics, and summary plots of current
and wave statistics show high quality data.

This report presents an overview of the metadata and data, including QA/QC results and
summary plots of current and wave metrics. Data available through an FTP link include
configuration files, raw ADCP output, and post-processed data. The post-processed files,
generated using the ADCP manufacturer’s software, contain a comprehensive set of velocity and
wave metrics.

2 Background and deployment parameters

The Centre for Marine Applied Research (CMAR) commissioned the Fundy Ocean Research
Centre for Energy (FORCE) to deploy eight (8) seabed-mounted ADCPs in Nova Scotian waters, to
measure currents and waves. Four of these were deployed in western Nova Scotia in late Aug
2020. This report provides the deployment parameters and high-level analysis of ADCP data
collected in Annapolis Basin, Nova Scotia, for the 30+ day sampling period starting in Sep 2020.

Figure 1 shows the as-laid deployment/recovery location of the Annapolis Basin ADCP and Table
1 summarizes the deployment and ADCP configuration parameters. Figure 2 gives a schematic of
the ADCP platform and its ground line, and Figure 3 shows a photograph of the platform/ADCP
on the deployment/recovery vessel. No float line/surface float was used as a tertiary recovery
mechanism, to prevent against the possibility of tampering.

 2

Figure 1: The Annapolis Basin ADCP deployment location: in Google Earth (left) and a Navionics bathymetry map (right). Table 1: Deployment Parameters for Annapolis Basin ADCP Deployment, Sep-Oct 2020 Parameter Value Notes ADCP AWAC 400 Manufacturer: Nortek Sampling intervals: Current: First 2 mins of every 10 mins Wave: Approx. first 17 mins of every hour Note: The AWAC does not sample ADCP sampling frequency 1 Hz current currents & waves simultaneously. Avg’d 0.75 Hz wave current time stamps are (approx.) at the 8th, 38th, 48th, and 58th min of each hour. ADCP altitude above seabed 0.5 metres ADCP blanking distance 1 metre ADCP vertical bin size 1 metre Deployment/Recovery location 44 38.652 N, 65 43.138’ W Deployment date 4-Sep-2020 Recovery date 5-Oct-2020 3

Figure 2: Schematic of the ADCP platform, with ADCP (blue head), float recovery mechanism and ground line/clump weight. No
 float line/surface float buoy (i.e., tertiary recovery) was used, to obviate against the possibility of tampering.

 Figure 3: AWAC being lowered into Annapolis Basin.

3 Raw data

The ADCP configuration file (‘.dep’ file) and raw data (‘.WBP’ and ‘.WPR’ binary files) are
contained in ‘Annapolis_Basin_ADCP_2020_Raw.zip’. Screenshots of the configuration settings
from the configuration GUI are provided in Appendix A of this document.

Note: Data were saved in Coordinated Universal Time (UTC).

 4

4 Post-processing

The raw data from the AWAC were processed in Nortek’s Storm software, using its default
processing parameters (with the addition of the compass offset/magnetic declination; see Fig.
4). The key averaging parameters are shown in Table 2. The text files of averaged/current data
and wave statistics are contained in ‘Annapolis_Basin_ADCP_2020_Post-processed.zip’; see the
*whr file for header/metadata information on the file formats.

 Figure 4: The settings used in Nortek's Storm software to derive the averaged/current data and wave statistics.

 Table 2: Averaging Parameters for Shelburne ADCP Deployment
 Parameter Value Notes
 Averaging interval 10 minutes 120 samples/averaging interval
 ADCP altitude above
 bottom/seabed 0.5 m
 Outputted velocities (and other metrics)
 Magnetic declination -16.63° are referenced to geographic north

 Coordinate system Earth East-North-Up (ENU) coordinate system

5 QA/QC

QA/QC metrics include platform orientation and the ADCP QA/QC metrics of echo intensity,
correlation, and percent good. Among standard QA/QC metrics, only echo intensity is outputted
by an AWAC.

Orientation (i.e., heading and tilt) should be nearly constant in time, and tilt (i.e., pitch and roll)
should be less than 10°. As shown in Fig. 5, the platform/ADCP satisfied these requirements.

 5
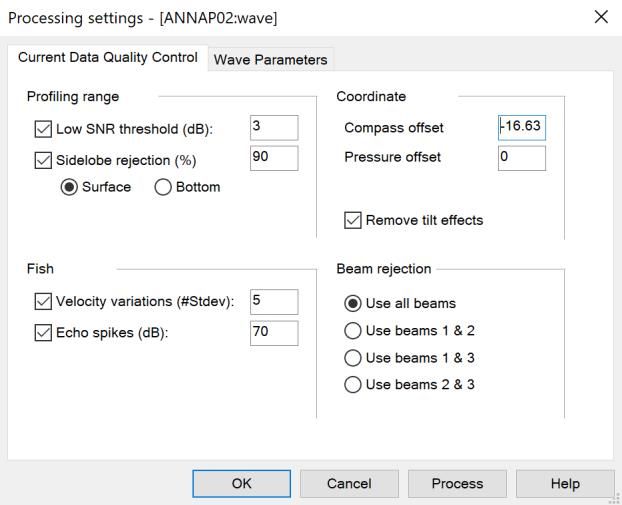
Figure 5: Depth and orientation time series. Orientation data are good.

Besides the platform’s orientation, echo intensity is also considered. Its definition is as follows:

 • Echo intensity (counts): Measure of return signal strength. Values should significantly
 exceed the noise floor of 25 counts.

 6
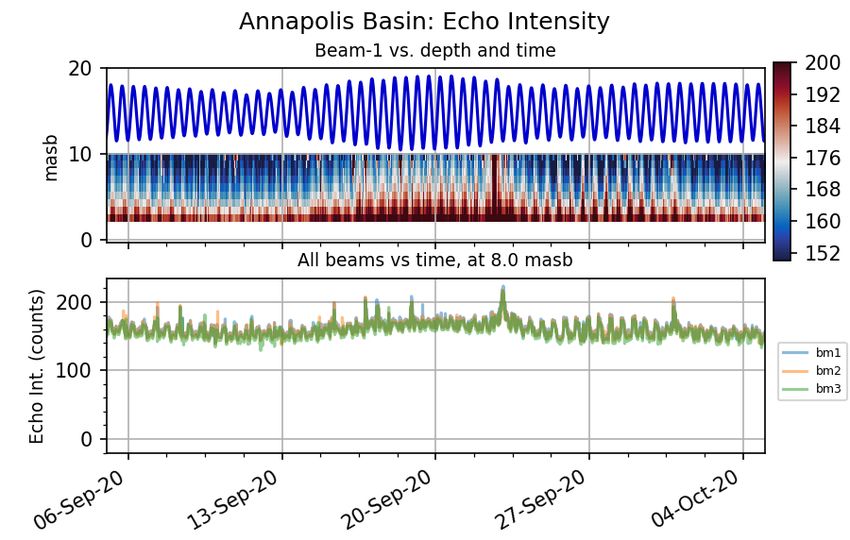
The values of echo intensity are consistent with high quality ADCP data (Fig. 6). Specifically, echo
intensity values lie well above the lower bound on acceptable echo intensities and there is
excellent consistency across beams.

 Figure 6: Averaged echo intensity (count). The beams have intensities consistent with high quality data.

6 Temperature

Figure 7 shows ADCP-recorded temperature data, which kept relatively constant for the duration
of the deployment.

 7

Figure 7: Time series of averaged temperature.

7 Averaged/Current Velocity

As discussed in Section 4, the data were processed in Nortek’s Storm software, using the
averaging parameters in Table 2 (including an applied magnetic declination of -16.63°). The
figures shown here are generated using FORCE scripts.

Figure 8 shows averaged/current speeds through the water column and over time. Figure 9
shows horizontal velocities over one week. There is a clear semi-diurnal tidal signal in the flow.

 8

Figure 8: Averaged flow speeds.

Figure 9: Averaged horizonal velocity: components and direction, for 1 week of data. Flow is tidally driven.

 9
8 Wave statistics

Wave statistics are also derived in Storm, using the parameters shown in Fig. 4.

Figure 10 shows time series relating to the three components of the wave field: wave height,
frequency, and direction. The metrics include the significant wave height 0 and the maximum
wave height , mean wave period 02 and peak period , and mean wave direction
DirMean, the direction at peak wave period DirTp, and the spreading at peak wave period SprTp.

The post-processed files provide comprehensive wave statistics and time series.

 Figure 10: Time series of depth, wave height, and wave direction (see the main body for definitions of individual metrics). The
 instance of a wave heights nearing 2.5 m coincides with the passing of post-tropical storm Teddy.

 10
Appendix A: Screenshots of the ADCP Configuration GUI

 11
12
You can also read