2021 Seasonal Water Supply Augmentation and Contingency Plan
←
→
Page content transcription
If your browser does not render page correctly, please read the page content below
2021 Seasonal Water Supply Augmentation and Contingency Plan
June 23, 2021

1.     BACKGROUND
Each year the Portland Water Bureau (bureau) prepares a seasonal water supply augmentation and
contingency plan, referred to as the Seasonal Supply Plan (SSP). The plan focuses supply planning on the
summer and fall months, when the Bull Run is in drawdown as well as times when groundwater capacity
may not be able to meet system demands year-round. The SSP provides a comprehensive strategy for
augmenting the bureau’s baseline water resources, if needed, to meet year-round demands. An
interdisciplinary team of bureau staff prepares the plan based on current supply and demand
information and analysis of resource options.

The seasonal supply strategy is designed to make the best use of existing resources to meet multiple
objectives. Key objectives include water supply reliability, high water quality, water use efficiency, fish
recovery, system maintenance and cost management. A glossary of key terms is included at the end of
this document.

Peak Season Supply
During the summer of 2021, the bureau expects that sufficient water will be available to meet the range
of potential supply and demand conditions that could occur in the Portland water system. The bureau
will continue to focus on water efficiency and augmentation of the Bull Run supply with groundwater
from the Columbia South Shore Well Field (CSSWF) to meet peak season water demands. The bureau will
also continue flow releases into the lower Bull Run River to enhance fish habitat and reduce river water
temperatures. As the summer progresses, the bureau will coordinate with key stakeholders to ensure
that interested parties are apprised of supply and demand conditions as they unfold.

Emergency Supply Planning
To meet customer needs when the Bull Run is unavailable and system demands exceed existing
groundwater capacity, the bureau has developed contingency plans to supplement supply capacity. This
contingency planning relies on the ability to off-load wholesale provider demands to other regional
drinking water sources, combined with implementation of curtailment and utilization of other
emergency contingency resources if needed.

The following document outlines the bureau’s plan for managing water supplies during 2021.

2.     SUPPLY PLANNING OBJECTIVES
The bureau wants to reliably meet the demands of all users with high quality water while effectively
managing costs. To meet this overarching goal, the bureau is required to balance multiple objectives and
coordinate the efforts of staff in several work groups.

                                                                                                   Page 1 of 18
Supply Reliability—Demand includes residential, commercial and industrial users, both in the Portland
service area and in the wholesaler service areas. It also includes water demand for fish, or in-stream
demand. Supply reliability is ensured by carefully managing the use of primary water resources,
employing conservation strategies, and preparing for the potential use of contingency resources.

Water Quality—Water quality for users involves meeting all drinking water quality regulations as they
apply from the source water to the distribution system. Meeting the regulations is a minimum standard
for the bureau; the bureau strives to supply water that has a better water quality than that defined by
regulations. This means managing the system to keep a large suite of water quality parameters within
optimal ranges. Water quality is also important for fish. Temperature and minimum flows are regulated
for fish downstream of Headworks at Larson’s Bridge. Managing stream temperature and flow are part
of the bureau’s larger objective to contribute to recovery of federally-listed steelhead, Coho salmon, and
Chinook salmon (Endangered Species Act, ESA). The water quality component of managing summer
supply is complex, with operational changes having varied effects on different water quality parameters.

Cost Management—Managing potential public and private costs is important to the bureau. The primary
water supply, the Bull Run Watershed, provides water through a gravity-fed system that is efficient and
cost-effective. Operation of the CSSWF, the bureau’s main augmentation resource, involves greater
energy costs. The bureau strives to balance use of its groundwater resource and other augmentation
resources to keep water provisions cost-effective while meeting all other objectives.

System Maintenance—The bureau has a goal of maintaining the equipment and operational skills
needed for using the bureau’s main augmentation resource, the CSSWF. Exercising the wells and pump
station help to keep equipment in good repair and to identify needed maintenance. Doing so also keeps
operators up to date with the process of operating the groundwater system and ensures that the
groundwater system will work properly when it is needed. As in past years, the bureau plans to conduct
a maintenance operation of the groundwater system. In 2021, the operation will last approximately
twenty days and produce about 400 million gallons of groundwater. In addition to preventive
maintenance, the operation will also use up the supply of sodium hypochlorite at the groundwater
facility before it degrades which would require significant disposal costs.

Seasonal supply planning is a complex process that involves continually weighing multiple factors as
conditions change throughout the year. The Supply Planning Group meets regularly during the reservoir
drawdown period of the year to decide what operations are necessary to meet all these objectives.

3.     ASSESSMENT OF PEAK SEASON DEMAND AND SUPPLY RESOURCES
In late winter and early spring of each year, the bureau evaluates information available about the
upcoming summer peak demand season. The bureau monitors precipitation, snowpack, and streamflow,
and evaluates current and projected water demands. The population supplied by the city’s water system
during the 2021 peak season will be approximately 1 million (including retail and wholesale customers
and accounting for wholesale customer offloads). In an average weather year, the bureau estimates that
peak season (122 days) daily average water demand would be about 120 million gallons per day (MGD).
The actual average peak season demand in 2020 was 133 MGD.
Fish in the Bull Run River also require water for their habitat needs. The bureau continues to work
collaboratively with numerous partner organizations to improve habitat for federal Endangered Species
Act-listed fish species in the Sandy River Basin and to reduce summer season water temperatures in the
                                                                                                Page 2 of 18
lower Bull Run River. Federal rules require protection of the listed steelhead, Coho salmon, and Chinook
salmon. State and federal rules also require meeting temperature objectives designed to protect aquatic
habitat. The bureau will release flows into the lower Bull Run River consistent with the Bull Run Water
Supply Habitat Conservation Plan (HCP) and final Temperature Management Plan that was approved in
April 2009.
Supply Probability Analysis
The bureau employs its Groundwater Use Model to evaluate the need for and approximate timing of
groundwater pumping. This model does not rely on weather forecasts but uses historic weather and
streamflow data to construct a set of groundwater pumping curves that are compared to actual
drawdown as it progresses. The Groundwater Use Model uses current-year demand projections
(generated by the bureau’s Demand Model using historical weather data), historical reservoir inflows,
and anticipated fish flow releases into the lower Bull Run River to develop a series of reservoir
drawdown curves – one for each weather year from 1940 to 2020. These projected drawdown curves
are used to determine suggested groundwater pump rates based on the remaining volume of Bull Run
storage above baseline elevations, and the calendar date. During drawdown, if the actual storage
volume in the Bull Run reservoirs drops below a groundwater pumping curve, then the pumping rate
corresponding to that curve is recommended to augment supply. The recommended groundwater pump
rates should keep the Bull Run reservoirs above their baseline storage levels while minimizing the
volume of pumped groundwater and attempt to maintain a relatively constant pumping rate throughout
the drawdown season.
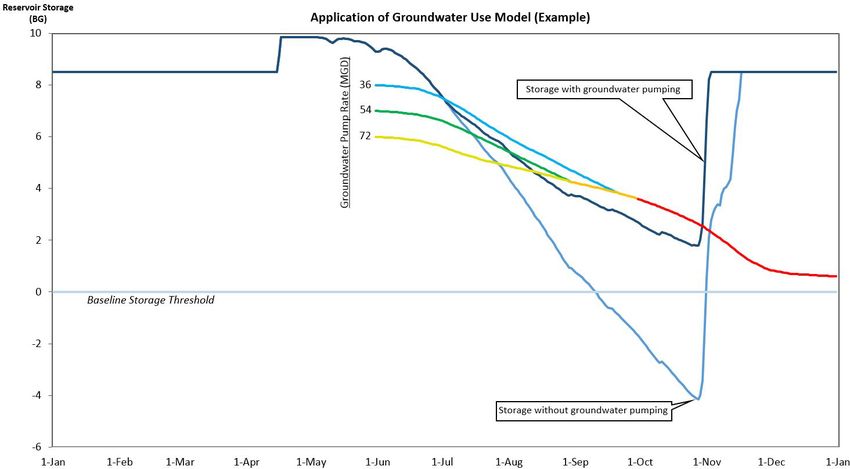
An example of groundwater pumping curves and a hypothetical drawdown curve (based on 2015
weather, a hotter and drier than average year) are shown in Figure 1. In this example, the storage curve
remains above the pumping curves until July 2, at which point the storage curve crosses the 36 MGD
pumping line. In response, two of the main groundwater pumps (18 MGD each) are turned on and
reservoir drawdown is slowed measurably.
The blue, green, and yellow curves represent constant groundwater pump rates. The orange and red
curves represent a constant supply from Bull Run with variable groundwater flow to meet demands. The
orange curve is in effect from September 1 to September 30 and uses a flow of 20 MGD in each of the
three conduits for a total Bull Run flow of 60 MGD. This maximizes the amount of groundwater that can
be supplied while keeping all three conduits in service, as 20 MGD is currently the minimum flowrate
that each conduit can supply. The red curve is in effect starting October 1 and uses two conduits for a
total Bull Run flow of 40 MGD. This conserves additional water in the Bull Run Reservoirs if drawdown
extends further into Fall. When conduit flows are constant, the groundwater flow rate varies from 35-80
MGD depending on demand.
The light blue storage line in Figure 1 shows what the progression of drawdown would have been if no
groundwater had been used. Table 1 summarizes the subsequent changes in storage and groundwater
pumping made in response.
Page 3 of 18Figure 1
Table 1. Example of applying the Groundwater (GW) Use Model to determine the timing and rate of
groundwater pumping.
Date Position of Storage Response GW
Line Relative to GW Pumping
Pumping Curves Rate
July 2 Cross 36 MGD curve Turn on two main GW 36 MGD
pumps
August 2 Cross 54 MGD curve Turn on one additional main 54 MGD
GW pump
August 13 Cross 72 MGD curve Turn on one additional main 72 MGD
GW pump
September 1 Under 3 conduit curve Supply 60 MGD from Bull Variable
Run, GW makes up the
remaining demand
October 1 Under 2 conduit curve Supply 40 MGD from Bull Variable
Run, GW makes up the
remaining demand
October 30 Cross above 2 conduit Turn off all GW pumps 0 MGD
curve
In actual practice, the groundwater pumping curves inform supply decisions but do not dictate them.
Other factors, such as short-range weather forecasts coupled with knowledge of antecedent hydrologic
conditions in the Bull Run Watershed, the state of distribution system storage, minimum conduit flows,
Page 4 of 18water quality and the timing of the electric power billing cycle at the groundwater pump station are also
taken into account in determining the timing and rate of groundwater pumping.
The groundwater pumping curves take into consideration continued flow releases from the Bull Run
reservoirs into the lower Bull Run River for fish habitat needs. Released water helps reduce water
temperatures in the lower river and maintain wetted habitat for spawning and rearing of steelhead,
Coho salmon, and Chinook salmon. These fish species are listed as threatened under the ESA, and
federal rules prohibit harming them or their habitat.
Habitat Conservation Plan Supply Provisions
The city’s Habitat Conservation Plan (HCP) is a package of actions to improve habitat conditions for fish
in the Bull Run and Sandy rivers. The HCP was developed in coordination with more than a dozen public
and private organizations working on salmon recovery in the Sandy River Basin and it includes flow and
water temperature commitments for the lower Bull Run River. The fifty-year HCP was approved by the
Portland City Council in September 2008. The National Marine Fisheries Service approved the plan in
April 2009 and issued the city an Incidental Take Permit which ensures regulatory compliance with the
federal ESA. The flow commitments described within the HCP are now part of a regulatory compliance
program for the bureau and will determine fish flow releases by the bureau for the duration of the plan.
More information regarding the HCP is available on the bureau’s web site,
www.portlandoregon.gov/water/HCP.
Minimum flow releases from Headworks during this summer's drawdown period will typically range from
20 to 50 cubic feet per second (cfs) from July 1 through September 30. Release volumes may change
each day in response to the temperature of the water being released and the expected (forecasted)
maximum air temperature. In October and November, minimum release volumes are a percentage of
the total inflow to the Bull Run reservoirs, with a minimum of 70 cfs (October) to 150 cfs (November)
during normal water years. The total volume of the downstream flow releases that occur during
drawdown varies from year to year.
The total volume of the Bull Run downstream flow releases during drawdown can also change depending
on the amount of precipitation that the Bull Run Watershed receives during the year. With low amounts
of precipitation, two types of critically dry seasonal conditions, or triggers, can result in lower
downstream flow releases: 1) a dry spring that causes early reservoir drawdown; and/or 2) dry fall
conditions. These triggers provide the bureau with the option to respond by altering the flow releases
for fish in the lower Bull Run River. The altered flow regime would be an earlier ramp down from spring
flows after June 1, and/or lower fall season releases (based on a percentage of inflow and both
minimums and flow caps).
A critical spring can be declared anytime drawdown begins prior to June 15. If this trigger is met in 2021,
the bureau may decrease the flow as early as June 1 in the lower Bull Run River down to approximately
30-40 cfs while following a down-ramping rate of 2 inches per hour of water stage as measured at the
United States Geological Survey (USGS) gauge site on the lower Bull Run River. Critical spring conditions
have occurred five times since 2010 (2014, 2015, 2016, 2018 and 2019), the first year of HCP
implementation. Modeling of current demand levels with historic weather conditions and stream flows
suggests that critical spring conditions can be expected about one year in five on average, though the
past seven years have had a very high incidence of critical spring conditions.
Page 5 of 18The trigger for a critical fall season is based on whether the August and September inflows to the Bull
Run reservoirs are within the lower 10% of historical flows for that time period. Critical fall flows cannot
be implemented more frequently than two years in a row and cannot be implemented four years after a
year that has had critical fall flows implemented. For example, because critical fall flows were
implemented in 2014 and 2015, the bureau could not apply critical fall flows in 2016 (two consecutive
year rule) and could not apply them in 2018 or 2019 (four years later rule). In all cases, critical fall flows
can be implemented in a given year only if the August-September low flow criterion is met that year. By
definition, the city can expect to experience critical fall conditions one year out of ten on average. The
city will have the option to implement critical fall flows in 2021. Table 2 shows conditions starting in
2010.
Table 2. History of critical spring and fall conditions starting in 2010.
Year Spring Fall
Conditions Flow Conditions Flow
Implemented Implemented
2010 Normal Normal Normal Normal
2011 Normal Normal Normal Normal
2012 Normal Normal Normal Normal
2013 Normal Normal Normal Normal
2014 Critical Critical Critical Critical
2015 Critical Critical Critical Critical
2016 Critical Critical Normal Normal
2017 Normal Normal Normal Normal
2018 Critical Critical Critical Normal
2019 Critical Critical Normal Normal
2020 Normal Normal Normal Normal
4. EMERGENCY SUPPLY RESOURCES
When the Bull Run source is not available (for a turbidity event or other situation), the bureau plans to
rely on the CSSWF. However, if the Bull Run were to be unavailable when system demands are greater
than CSSWF capacity, the bureau will need to reduce system demands and increase supply. Several
contingency resources identified in Table 3 will be instrumental to meet customer needs.
5. 2021 BASELINE AND SEASONAL CONTINGENCY RESOURCES
The following section of this plan outlines the baseline and contingency resources available to help the
bureau meet demand in 2021. Available resources are shown in Table 3. This table reflects conservative
assumptions to ensure that the bureau can manage even extreme supply shortage situations. For
example, the estimated duration of the drawdown period shown in Table 3 is 151 days. Based on historic
information, this is a conservative estimate because the drawdown period should be shorter than 151
days in about 90 percent of the years. In addition, the hypothetical date at which drawdown begins that
is shown in the table is June 1, which is approximately one month earlier than the average drawdown
date. Drawdown has occurred as early as June 1 only six times since 1963, when Bull Run Reservoir 2
Page 6 of 18came on-line. In 2020, continuous drawdown began on July 11 and ended on October 11, lasting 122
days. For planning purposes, the seasonal supply plan uses June 1 – October 29 (151 days) for the
potential duration of drawdown. Actual drawdown and refill vary each year.
“Baseline Primary Resources” include Bull Run streamflow, Bull Run reservoirs, CSSWF maintenance
operation, and ongoing water efficiency. “Baseline Augmentation Resources” includes wells from the
Columbia South Shore Well Field, and Bull Run Lake Increment #1. The bureau manages these resources
to meet water demand and to provide the multiple benefits described in Section 2.
Based on current demand and supply projections, baseline primary, augmentation and contingency
resources available for 2021 should be sufficient to meet peak season demand even in a hot, dry
summer.
Page 7 of 18Table 3. Baseline, Augmentation, and Seasonal Contingency Resource Availability for Peak Season 2021.
Seasonal Water Supply Resources Potential Rate of Use Potential Volume (Billion Potential Use Period
(Million Gallons a Day) Gallons) (Drawdown = 151 days,
6/1– 10/29)
BASELINE PRIMARY RESOURCES
Bull Run Watershed
− Streamflow Variable 9.5 – 52.5 BG 1 Year-Round
− Reservoirs 1 and 2 Variable 9.9 BG (usable storage) Drawdown
Water Efficiency Incorporated into Incorporated into demand Drawdown
demand forecast forecast
Columbia South Shore 36-42 MGD 0.4 BG 20 days
Maintenance Operation
BASELINE AUGMENTATION RESOURCES
Columbia South Shore Wells SGA, 78 / 70 / 62 MGD 2.2 / 4.0 / 10.3 BG Year-Round
BLA and TSA Wells 2 (30 / 90 / 151 days) (30 / 90 / 151 days)
(excludes wells off-line for repairs and
accounts for mechanical redundancy for large
wells)
Bull Run Lake Increment #1 Up to 27 MGD An estimated 0 BG Drawdown (release not
(above elevation 3,164 ft) Dependent on Lake Refill permitted prior to July 15) 3
Levels.
CONTINGENCY – TIER 1 4
Wholesale Requested 0.21-0.32 MGD; 0.03 BG; Incorporated into 122 days max (June through
Interruptible Water Incorporated into demand forecast September)
demand forecast
Bull Run Lake Increment #2 Up to 27 MGD Approximately 1.1 BG 5 Drawdown (release not
(elevation 3,164 to 3,154 feet) permitted prior to July 15)2
PWB Operations Curtailment 0.75 MGD 0.02 – 0.07 BG Year-Round
Limit Tabor Operations
(Res 5 and 6)
Bubbler shut-downs
Limit hydrant permits
Limit flushing
Citywide Operations Curtailment 1.2 MGD 0.04 – 0.2 BG June 1 – Oct. 31
(Parks seasonal uses,
irrigation, splashpads,
fountains) 0.002 MGD 0.0001 BG Nov. 1 – May 31
Voluntary Customer Curtailment 12 MGD 0.36 BG 30 days June 1 – Oct. 31
(10% demand reduction) 8 MGD 0.24 BG 30 days Nov. 1 – May 31
Wholesale Demand Offloads 5 – 22 MGD 0.9 BG Year-Round
1
Based on measured tributary inflows 1976-2020.
2
Rates of use and potential volumes are maximums that may be achieved if the CSSWF is used at 100% capacity for full duration of the season. Normal
operations apply low pumping rates early in the season and higher rates late in the season, resulting in a likely maximum of about 7 BG of augmentation.
3
Potentially longer period, if the gravity flow rate or temperature considerations require a more prolonged discharge.
4
Contingency resources within a given tier are not listed in priority order.
5
Entire 1.4 BG typically available for release from the increment decreased by low winter refill in Bull Run Lake. Approximately half of this increment will
release naturally through landslide deposits during the summer, leaving only half available for additional release.
Page 8 of 18Seasonal Water Supply Resources Potential Rate of Use Potential Volume (Billion Potential Use Period
(Million Gallons a Day) Gallons) (Drawdown = 151 days,
6/1– 10/29)
CONTINGENCY – TIER 2
Mandatory Curtailment 25 MGD 0.8 BG 30 days (June 1 – Oct. 31)
(20% of demand) 12.5 MGD 0.4 BG 30 days (Nov. 1 – May 31)
Additional draft of Bull Run Unspecified Unspecified Unspecified
Reservoirs 1 & 2 below 9.9 BG
usable storage
CONTINGENCY - EMERGENCY
Bull Run Lake Increment #3 Up to 27 MGD Approximately 1.4 BG Drawdown (release not
(elevation 3,154 to 3,143 feet) 6 permitted prior to July 15)2
Emergency Curtailment 60 MGD (June 1–Oct. 31) 0.8 BG (June 1–Oct. 31) 14 days
(50% of Demand) 40 MGD (Nov. 1–May 31) 0.6 BG (Nov. 1–May 31)
CSSWF BLA wells Year-Round
PW-17 3.6 / 3.2 / 2.9 MGD 0.1 / 0.3 / 0.5 BG
PW-18 9.4 / 8.4 / 7.5 MGD 0.3 / 0.8 / 1.2 BG
(30 / 90 / 151 days) (30 / 90 / 151 days)
Milwaukie Intertie (with portable 2.0 MGD 0.3 BG Drawdown
pump)
Vivian Wells (pump to distribution) 2.5 / 2.3 / 2.0 MGD 0.1 / 0.2 / 0.3 BG Year-Round
(30 / 90 / 151 days) (30 / 90 / 151 days)
Clackamas Intertie (with portable 2.0 MGD 0.3 BG Year-Round
pump)
A. Baseline Primary Resources
Bull Run Water Supply
Bull Run Streamflow
Historical averages for total reservoir inflow, by month, are shown below in Table 4.
Table 4: Monthly statistics for inflow volumes to Bull Run reservoirs in billions of gallons (BG) based on
flows from 1976-2020.
Month Minimum Inflow Maximum Inflow Mean Inflow
Volume (BG) Volume (BG) Volume (BG)
June 2.1 29.6 19.6
July 1.7 11.4 3.9
August 1.4 6.7 2.6
September 1.5 10.9 3.5
October 1.3 27.2 8.9
6
A temporary pump setup would be required to access this increment. Considerable coordination with the U.S. Forest Service would be necessary to gain
approval for using this increment of Bull Run Lake.
Page 9 of 18Bull Run Reservoirs 1 and 2 – 9.9 BG Total Usable Storage
Routine usable storage is defined as the amount available above 970 feet elevation for Reservoir 1 and
above 840 feet elevation for Reservoir 2. The analysis supporting these levels is documented in a January
2002 memorandum titled “Definition of Water Quality Based Threshold Elevations in the Bull Run
Reservoirs and Resulting Conclusions about Volume Available for Water Supply.” In addition, the Habitat
Conservation Plan includes commitments to draw reservoirs down no further than 970 feet and 832 feet
in Reservoir 1 and 2, respectively.
Columbia South Shore Well Field Maintenance Operation
As mentioned in Section 2, the bureau plans to conduct a maintenance operation of the CSSWF. This
involves daytime operations for 5-6 days a week producing approximately 15 - 20 MGD of groundwater
for approximately 20 days for an estimated total of 300 to 400 MG groundwater. Timing of this
operation will be coordinated with electrical meter read dates at the groundwater pump station and
degradation of the sodium hypochlorite solution in order to minimize electrical and disposal costs. In
2021, the maintenance operation is anticipated to begin on August 3.
Water Efficiency
Portlanders use water wisely and have for decades. Our demand reflects customer water use patterns
including ongoing efficiency practices. Water efficiency programs and messages are a key component of
the bureau’s ongoing summer supply strategy. These programs help reduce water demand and stretch
surface water supplies. Water savings from water efficiency are embedded in demand forecasts.
In 2020, the bureau received approval of the city’s Water Management and Conservation Plan. This plan
contains State-mandated conservation and water curtailment elements. Bureau water efficiency
programs, including activities associated with the Regional Water Providers Consortium (RWPC) are
detailed in the plan.
The bureau’s Water Efficiency Program offers technical resources and information about efficient water
use to all customer classes. Programs include public education, toilet rebates, meter data logging,
consumption evaluation, and onsite water efficiency surveys for commercial and multifamily customers.
Water efficiency devices are also distributed to all customer classes. More information about the bureau
water efficiency programs can be found at portland.gov/water/water-efficiency-programs.
An important supplement to Portland’s own water efficiency programs is the RWPC’s regional water
conservation program. The RWPC’s program operates year-round, but targets most of its resources
toward reducing summer peak season demands. The RWPC’s program consists of five key elements:
television and radio ads; a comprehensive website; educational materials and conservation devices;
school assembly programs; and community events and workshops geared toward homeowners,
commercial property managers, landscape professionals, gardeners, and kids. Information on the
RWPC’s conservation program can be found at www.conserveh2o.org/.
B. Baseline Augmentation Resources
Baseline Augmentation Resources are sources of supply that are readily available for use, but are not
used on a routine, ongoing basis. In 2021, they consist of the CSSWF.
Page 10 of 18Columbia South Shore Well Field (CSSWF)
The bureau is prepared, if necessary, to augment the Bull Run surface water supply by pumping
groundwater and blending it with the Bull Run supply. Groundwater augmentation contributes to supply
reliability, including meeting seasonal peak daily demands and/or making up seasonal supply deficits. If
seasonal forecasting indicates a potential supply deficit, groundwater augmentation early in the summer
helps the bureau maintain a desirable groundwater to surface water blend ratio. Maintaining a lower
blend ratio can help minimize impacts on water quality-sensitive customers, aesthetic effects, and other
potential customer inconveniences associated with water chemistry fluctuations in the system.
If groundwater is needed for supply augmentation, the bureau’s working target for the groundwater
blend ratio is approximately 30 % groundwater or less. However, the projected or actual supply deficit,
water demand, and the timing, magnitude, and duration of groundwater use all can affect the actual
blend ratio.
The baseline augmentation CSSWF wells have a theoretical installed capacity of 12-13 BG over a 151-day
peak season. This assumes 100 % reliability of the well field and disregards interference effects that may
require wells to be cycled on and off. When wells are out of service for routine maintenance (routine
maintenance occurs to the wells throughout the year and typically only one well is out of service at any
given time) or unavailable due to unexpected equipment failures, and well rotation is considered, the
total volume of groundwater available for augmentation is incrementally reduced by the capacity of the
unavailable wells. During the 2021 peak season, two of the bureau’s largest wells are excluded from the
baseline supply to represent potential unplanned equipment failure (PW-13) and to protect the BLA
from further manganese incursion (PW-12). Approximately 10-11 BG of groundwater could be produced
for baseline augmentation after the capacity of these two wells has been subtracted. This is the
maximum that could be achieved if the well field were operated at full capacity for the entire duration of
the season. In practice, the CSSWF is not activated until the season is underway and is operated at lower
production rates early in the season and higher rates late in the season. The maximum volume produced
is also reduced by interference effects that accumulate throughout the pumping operation. After
accounting for operational choices and aquifer response, the likely maximum volume of groundwater
that could be produced in a 151-day season under normal operations is roughly 7 BG 7.
Operation of the CSSWF involves balancing a number of factors including water demand, water quality,
infrastructure capacity, and the cost of electricity required to run the well pumps and the pump station.
The three Blue Lake Aquifer (BLA) wells are the bureau’s shallowest and highest yielding wells, with the
highest specific capacities and the smallest hydraulic lifts. As a result, the BLA wells produce water more
efficiently (i.e., at lower electrical costs) than wells in the deeper Troutdale Sandstone Aquifer (TSA) and
Sand and Gravel Aquifer (SGA). The BLA would be the bureau’s first choice of aquifers because of this
higher efficiency.
The SGA is the bureau’s deepest confined aquifer with the best natural protection from surface
contamination. With 15 installed wells, the SGA is also the aquifer with the greatest total production
capacity. Although SGA pumping costs are higher, the bureau’s wells in this aquifer have good yields and
specific capacities, and are therefore a mainstay of the bureau’s groundwater usage.
7
Operational scenario is 15 idle days, 36 MGD for 30 days, 54 MGD for 30 days, 71 MGD for 30 days, and 73 MGD for 30
days.
Page 11 of 18The TSA is a moderately deep confined aquifer with fairly good protection from surface contamination
and desirable water quality characteristics (e.g., high pH) for blending. However, specific capacities and
yields of the TSA wells are generally lower than either the BLA or SGA wells, and the bureau has the
capability to make pH and other water quality adjustments at the groundwater treatment facility.
Furthermore, maintaining hydraulic pressure in the TSA serves to help protect the underlying SGA from
possible downward migration of contaminants. Therefore, the TSA would be used by the bureau in a
more limited manner than either the BLA or the SGA. The primary reasons for TSA use would be to make
up shortfalls in overall production capacity and for matching well field output with the booster pump
station output.
Since 1985, the bureau has used groundwater for seasonal surface water supply augmentation 16 times.
The cumulative volume of groundwater pumped for seasonal supply augmentation since 1985 is 35.7 BG
and the maximum single seasonal groundwater augmentation volume to date was 5.8 BG in 2015, which
included an extended maintenance run in June and the subsequent augmentation run from July-
November. A history of groundwater use is available on the bureau’s website at:
portland.gov/water/about-portlands-water-system/groundwater-use .
The method used to calculate the theoretical 151-day yield of the well field during typical summer supply
augmentation was revised in 2021 to better match observed reductions in the production rates of the
wells during extended well field use in 2017 and 2018. The CSSWF Groundwater Model was used to
simulate well field usage based on past performance and operational practices. Operational practices
include both well selection and the increase in pumping rate as summer supply augmentation
progresses.
The well field can also be used in an emergency scenario in which the available wells are pumped at
maximum capacity at start-up. Production rates are subsequently reduced by well interference as the
emergency event continues. The method used to calculate the theoretical 151-day yield of the well field
during typical emergency use was revised in 2018 to better match observed reductions in the production
rates of the wells during extended well field use in 2015 and 2017. These temporary reductions result
from groundwater pumping level declines and well interference effects. Wells return to their initial
capacity after extended pumping operations stop and groundwater levels recover. The time-dependent
reduction in CSSWF emergency capacity is calculated in the following way:
• From well field start-up to 30 days of pumping, an average pumping rate was calculated for each
well using the observed yields over the first 30 days of pumping in 2015 and 2017;
• Between 30 and 90 days of pumping, it is assumed that 90 % of the 30-day well capacities are
available; and
• Between 90 and 151 days of pumping, it is assumed that 80 % of the 30-day well capacities are
available.
Actual pumping data from extended groundwater operations in 2003 and 2006 provided the basis for
this approximation of declines in yield over time. Data from more recent operations and hydrologic
model analyses continue to support this magnitude of declines over time.
The bureau prepares an annual CSSWF pumping plan that describes current agreements with the Oregon
Department of Environmental Quality and provides additional details about well field operation.
Page 12 of 18Bull Run Lake Increment #1 (projected fall elevation down to 3,164 feet)
The bureau considers water supply from Bull Run Lake as three distinct increments. Increment #1 is
described here. The other two increments are described in subsequent sections. Bull Run Lake Increment
#1 is defined as the amount of water available above a minimum fall lake surface elevation of 3,164 feet.
This elevation provides a 75% probability of the lake refilling to the full pool elevation of 3,174 feet the
following spring. As an example, if the minimum fall elevation is projected to be 3,168 feet in a given
year, the amount of water available for use would be the increment between 3,168 feet and 3,164 feet,
or approximately 0.6 BG. A portion of this increment is naturally contributed to the Bull Run reservoirs
without releasing the water through the deep-water intake, as water seeps out of the lake and into the
Bull Run River. The lake elevation is a key factor in the ability of cutthroat trout living in the lake to
access tributary habitat for spawning. Until snowmelt and spring rains have played out (usually by early
June), it is uncertain how much supply will be available from Bull Run Lake. As of June 10, 2021, the lake
level was 3172.3 feet elevation, 1.7 feet below full pool elevation. The projected minimum lake level that
will occur without a release is 3162.8 feet. Therefore, no portion of Bull Run Lake Increment #1 is
expected to be available for additional release.
Under the terms of the city’s easement from the U.S. Forest Service for use of Bull Run Lake, mitigation
requirements are triggered if, as a result of releasing water from the lake, the lake does not refill to full
pool the following spring in more than one year of the remaining term of the easement when it would
have refilled naturally.
C. Seasonal Contingency Resources
The categories of contingency resources are presented in Table 3 and described below. Tier 1
contingency resources are simpler and less costly to use than Tier 2 contingency resources, and are thus
assigned a higher priority for use. In an actual situation in which the use of seasonal contingency
resources is required, the bureau will consider operational issues, constraints, and opportunities existing
at the time before selecting the appropriate combination of resources to meet identified needs. The
resources listed within each tier are not shown in priority order. If the need for additional supply
augmentation called for the use of contingency resources, the order of resource use would be decided at
that time. Contingency resources to meet water demands during 2021 will be available if necessary to
manage unexpected circumstances.
Tier 1 Contingency Resources
Tier 1 resources include the simpler and/or less costly contingency resources available for use in summer
supply augmentation.
Elimination of Wholesale Requested Interruptible Water
In the event of an emergency or other condition under which continued supply of interruptible water
jeopardizes the reliability of the water system, the bureau may cease providing interruptible water at
any time on one day’s written or verbal notice to the Purchaser. Under all other circumstances, including
any augmentation to supply, the city may cease providing interruptible water at any time on 21 days
written or verbal notice to the Purchaser.
Page 13 of 18Bull Run Lake Increment #2 (elevation 3,164 down to 3,154 feet)
If available, the bureau can obtain up to 1.4 BG by releasing water from Bull Run Lake Increment #2,
bringing the lake down to a surface elevation of 3,154 feet. Limiting the drawdown to 3,154 feet
provides 90 % chance that the lake will refill to 3,164 feet the following spring but a very low probability
of refilling to 3,174 feet. Based on winter refill, in 2021, approximately 0.3 BG of this increment is
expected to release naturally through the landslide deposits, leaving 1.1 BG to be released as additional
supply.
Portland Water Bureau Operations Curtailment
When Portland’s supply appears likely to be stressed, the first step in curtailment would be a reduction
of water use by the bureau. These reductions could include ceasing refill of the Mt Tabor reservoirs 5
and 6, shutting off free-flowing Benson Bubblers, minimizing flushing activities and reducing hydrant use
permits. It is estimated that this could save approximately 0.75 MGD.
Citywide Operations Curtailment
The City of Portland itself is one of the bureau’s largest users. In particular, the Portland Parks and
Recreation Bureau uses a lot of water in the summer months for irrigation and recreational facilities. The
Portland Water Bureau Efficiency group has established contacts with Portland Parks to be able to
request a reduction in water use during stress seasons. The PWB Efficiency Group is also reaching out to
other City of Portland bureaus for possible water use curtailment strategies. Work with the Bureau of
Transportation, the Bureau of Environmental Services and the Fire Bureau is planned for the fiscal year
2020-2021.
Voluntary Customer Curtailment
In a water supply shortage, it may be necessary and appropriate to ask customers to voluntarily reduce
their water use. Issuing voluntary reduction messages informs customers of a water shortage situation.
The bureau estimates that voluntary curtailment messages can reduce water use by 10%, which is
estimated to be 8 - 12 MGD of water savings; however, the amount of savings would vary depending on
the timing and intensity of the messages. Because media messages are not limited by utility service area
boundaries, it is important to coordinate the delivery of curtailment messages with other Portland area
water providers and stakeholders. The bureau’s Water Management and Conservation Plan, updated
and approved in 2020, outlines implementation measures for voluntary curtailment. In addition, Section
14 of the wholesale water sales agreement, entitled “Water Curtailment and Protection of the Water
System,” provides direction for implementing curtailment actions. In Fall 2018, PWB and its wholesale
providers adopted a Curtailment Plan that includes mitigation measures to support regional water
demands in the event of a water supply shortage.
Wholesale Demand Offloads
The bureau’s water sales agreement states that each wholesale customer can purchase a guaranteed
quantity of water each month. Some of the wholesale customers may be able to “off-load” a portion of
water demand on the Portland system through the use of other resources. The wholesale customers’
alternative sources include a groundwater system developed jointly by Rockwood Water People’s Utility
District (Rockwood) and the City of Gresham (Gresham), and Tualatin Valley Water District’s (TVWD)
partial ownership of the Joint Water Commission (JWC). The baseline forecast for the SSP accounts for
regular usage of these alternative sources by these wholesale customers. The alternative
Page 14 of 18sources may also be able to provide additional offloads during an extreme water supply shortage or an
emergency. Rockwood and Gresham could provide up to 8 MGD from their groundwater system
depending on current pumping volumes. TVWD could provide between 5 and 14 MGD from the JWC
depending on storage and treatment capacity.
Tier 2 Contingency Resources
The group of Tier 2 Contingency Resources also includes a variety of options. Tier 2 resources are
significantly more complex, costly and take more time to use than Tier 1 resources. Yet they provide
critical flexibility to respond to an extreme supply shortage or an emergency.
Mandatory Curtailment
In an extreme water shortage, the City could require water use curtailment under authority of City Code
Chapter 21.32, Water Curtailment Policy. The code authorizes the bureau’s Administrator to establish
curtailment rules as appropriate to the situation. The bureau's Water Management and Conservation
Plan outlines potential measures that would be implemented in the event of an extreme water shortage.
Mandatory curtailment also applies to wholesale customers. The Curtailment Plan with wholesale
customers specifies an allocation methodology on water usage reduction for the wholesale customers.
The bureau estimates that a 20% reduction in water use, or about 12-25 MGD of water savings could be
obtained through mandatory reductions; however, the amount of savings would vary depending on the
timing and intensity of the messages.
The city last imposed mandatory restrictions in the summer of 1992 when the CSSWF was not available
for use. Mandatory curtailment can cause substantial inconvenience for a broad range of customers. For
certain business sectors (e.g., landscape and nursery), mandatory curtailment can also cause significant
economic hardship. For these reasons, mandatory curtailment would be implemented only if absolutely
necessary.
Additional Draft of Bull Run Reservoirs 1 & 2 below 9.9 BG Usable Storage
The bureau could also draw the Bull Run reservoirs down below the Baseline Storage Threshold.
However, because the Bull Run system is not filtered, extensive reservoir drawdown poses an increased
risk of creating water quality related issues.
Emergency Contingency Resources
The group of Emergency Contingency Resources includes a variety of options to respond to an extreme
supply shortage or an emergency. These resources can be used in addition to, or in lieu of other
baseline, tier 1 and tier 2 resources identified above.
Bull Run Lake Increment #3 (elevation 3,154 down to 3,143 feet)
Using Bull Run Lake Increment #3 would involve drawing the lake down to an elevation of 3,143 feet to
provide about 1.4 BG of additional supply. This increment is not readily available in 2021 due to
inoperability of the outlet pump and would require the use of a temporary pump. It would take
considerable agency coordination to obtain approval to use a temporary pump to access increment #3.
Use of the lake to this level could have significant impacts on resident fish, which in turn would trigger
federal permit conditions requiring expensive mitigation measures to restore and protect fish and
wildlife habitat. The lake, if drawn to this level, would also likely take multiple years to refill; thus,
Page 15 of 18limiting its availability as a water supply. (Bull Run reservoirs refill every winter because they are
relatively small impoundments in a large basin. By contrast, Bull Run Lake is a large lake in a small basin).
Emergency Curtailment – Critical Water Shortage
In the event of a critical water shortage the bureau has outlined in its Water Management and
Conservation Plan a curtailment stage that restricts water use to only uses critical for health and safety.
This means a reduction greater than 50% of water use.
CSSWF PW-17 and PW-18
If needed, the bureau expects to be able to bring either of the BLA Production Wells 17 (PW-17) and/or
18 (PW-18) on-line. Wells PW-17 and PW-18 are not operated due to high concentrations of naturally
occurring manganese. PW-17 can provide up to 2.9 MGD. PW-18 can add an additional 7.5 MGD. Prior to
2021, PW17 and PW18 were considered Tier 2 contingency resources, however, due to the likelihood of
their use resulting in discolored water and manganese levels above the Canadian health advisory, it has
been decided that these wells would only be used as an emergency water source.
Vivian Wells
The Vivian Wells (former Powell Valley Road Water District (PVRWD)wells) include two Troutdale Gravel
Aquifer (TGA) wells and two Upper Gravel Aquifer (UGA) wells with a total combined production capacity
of about 6 MGD. These wells are classified as an Emergency Resource because they are not currently
piped into terminal storage at Powell Butte and can only provide supply to the local distribution system.
In 2021, repairs to PVRWD Well 9 were indefinitely postponed due to the costs relative to the benefits of
this incremental emergency supply. The potential combined capacity of the remaining three Vivian wells
(#6, 7, and 8) is approximately 2-3 MGD.
Milwaukie and Clackamas Interties (with portable pump)
Interties exist between Clackamas and the City of Milwaukie’s system and Portland’s system. Utilizing a
portable pump, each intertie could provide about 2.0 MGD.
6. CONCLUSIONS
The Seasonal Supply Plan provides a comprehensive strategy for augmenting the bureau’s baseline water
resources, if needed during the peak demand season. Every year the Portland Water Bureau revisits the
planning process and revises the Seasonal Supply Plan according to current situations and needs. During
the summer of 2021, the bureau expects that sufficient water will be available to meet the range of
potential supply and demand conditions that could occur in the Portland water system.
The bureau continues to refine its approach to supply planning by integrating new tools and utilizing the
increasing wealth of experience gained each supply season. The Supply Planning Group meets regularly
to review the current supply conditions and make decisions about how to utilize supply resources
throughout the season.
Page 16 of 18GLOSSARY OF TERMS
1. Baseline Augmentation Resources – Sources of supply that are readily available for use but not used
on a routine, ongoing basis. In 2021, this consists of the Columbia South Shore wells.
2. Baseline Primary Resources – The basic supply and demand management resources that are used
each year. In 2021, these include Bull Run streamflow, Bull Run reservoirs, groundwater produced in
a maintenance operation, and ongoing water efficiency.
3. Baseline Storage Threshold – The point at which usable baseline storage in the two Bull Run
reservoirs equals zero, even though there will be 6.9 BG left in the reservoirs. The distance of a
plotted line above the Baseline Storage Threshold in Figure 1 indicates the amount of routine usable
storage in the Bull Run reservoirs (9.9 BG when the reservoirs are full). The distance of a plotted line
below the Baseline Storage Threshold represents the amount of water (or demand reduction) that
would be needed to augment the Bull Run supply to meet peak season demand. The bureau could
also draw the Bull Run reservoirs down below the Baseline Storage Threshold. However, water
quality risks increase substantially below this threshold. Because the Bull Run system is not filtered,
extensive reservoir drawdown poses an increased risk of exceeding federal turbidity standards.
Additionally, cold reservoir bottom water reserved for downstream management for endangered
salmon species would be at risk of heating or mixing with warmer layers of water.
4. Bull Run Reservoirs Baseline Storage – The amount of water available above 970 feet elevation for
Reservoir 1 and above 840 feet elevation for Reservoir 2 (9.9 BG when the reservoirs are full).
5. Contingency Resources – Tier 1 and Tier 2 contingency resources of supply and demand management
require some advance planning to implement. Tier 1 contingency resources are simpler and less
costly to use than Tier 2 contingency resources and are thus assigned a higher priority for use.
Emergency contingency resources are more costly and complicated to utilize and pose additional
risks, therefore they are reserved for extreme and/or emergency situations.
6. Critical Fall – A management option for reduced fish flows that can be implemented in certain years
when August and September cumulative inflow is in the lowest 10th percentile of flows since 1940. If
implemented, summer flow for temperature control continues from October 1-15. From October 16-
31, 50% of reservoir inflow with a minimum of 30 cfs (20 MGD) and a maximum of 250 cfs (160 MGD)
is implemented. From November 1-15, 40% of reservoir inflow with a minimum of 30 cfs and a
maximum of 250 cfs is implemented. From November 16-30, 40% of reservoir inflow with a minimum
of 70 cfs and a maximum of 350 cfs (225 MGD) is implemented. Critical fall flows may not be
implemented in more than two consecutive years and also may not be implemented in the fourth
year following a critical fall flow implementation.
7. Critical Spring – A management option for reduced fish flows that can be implemented in any year
that drawdown begins before June 15. If implemented, winter fish flows of 120 cfs are maintained
until at least June 1; after June 1, flow can be decreased to 30 cfs until July 1, at which time summer
flow for temperature control is implemented. There is no limit on recurrence of critical spring flows.
8. Curtailment – Restriction of water use due to emergencies or drought. Voluntary and mandatory
curtailment include similar actions and methods, but mandatory curtailment has an enforcement
component associated with it.
Page 17 of 189. Drawdown – The period of the year when the amount of water stored in the Bull Run reservoirs is
decreasing because demand from the reservoirs (water sent downstream and into conduits) exceeds
inflow to the reservoirs.
10. Flow Releases – Flows of water released from the reservoirs into the lower Bull Run River to meet
flow and temperature targets developed to protect ESA listed fish. The Bull Run Water Supply Habitat
Conservation Plan (HCP) has been approved by regulatory agencies and the flow release
commitments are legally enforceable.
11. Groundwater Maintenance Operation – Production from the CSSWF to maintain equipment and
make repairs. This is typically groundwater production of 20 MGD for 20 days for a total of
approximately 400 MG.
12. Interruptible Water - Water that a wholesale purchaser may purchase over and above its guaranteed
purchase quantities under the terms and conditions in the water sales agreement section 6.
According to the agreement the city may cease to provide interruptible water at any time in the
event of an emergency, under all other circumstances, including any augmentation to supply, the city
may cease providing interruptible water at any time on 21 days written or verbal notice to the
Purchaser.
13. Peak Season – The period of highest water use due to warm weather and/or low incidence of rain. A
122-day period from June to September is considered for demand forecasting purposes.
14. Refill – The period when the streamflow into the reservoirs exceeds demand to town and
downstream flows for fish. Refill begins when drawdown ends.
15. Regional Water Providers Consortium (RWPC) – A group of 22 water providers in the Portland
Metropolitan Area. The Consortium is operated under an intergovernmental agreement and is
staffed by the bureau. The Consortium has been in operation since 1997, and since 2000 has
implemented a cost-effective regional water conservation campaign designed to encourage the
efficient use of the region’s water supply. The Consortium also works together to prepare for,
respond to and recover from emergency events. The Consortium provides a forum for study and
discussion of water supply issues and coordinates the implementation of the Regional Water Supply
Plan. www.regionalh2o.org.
16. Water Efficiency – The reduction of water use through more water efficient technologies, practices,
and behavior changes.
17. Wholesale Demand Offloads – The reduction of demand on Portland’s system when wholesale
providers utilize other sources of water.
Page 18 of 18You can also read