2021 State of the Corporate - Tax Department - THOMSON REUTERS INSTITUTE
←
→
Page content transcription
If your browser does not render page correctly, please read the page content below

THOMSON REUTERS INSTITUTE

2021                 tate of the Corporate
                    S
                    Tax Department
                    Transitioning to a Digital Tax Department
2021 STATE OF THE CORPORATE TAX DEPARTMENT

EXECUTIVE SUMMARY

The results of the 2021 survey reveal that half of corporate tax departments feel under-resourced. Tax
departments are dealing with the impact of the global pandemic at the same time as their usual business
activity, which is under considerable change. Tax reform, specific tax workstreams, acquisitions, and macro-
changes related to politics and the economy are typical examples of demands on tax departments which,
collectively, put a strain on resources.
The most common strategy in place to address the resourcing issue is technology. This, in part, was validated
by the survey finding that those tax departments with more technology-enabled operations (self-classified
as optimized, predictive, or proactive) are more likely to feel comfortable with their resource levels.
Technology, when it is utilized, saves time, which in turn saves cost and increases the speed of turnaround.
Tax departments with successful technology deployments also noted the reduced risk of errors, higher data
accuracy, and improved reporting. Better organized data also provides more control and easier compliance.
Unfortunately, these benefits are all too often not realized because many tax departments lacked the time,
budget, and skills to effectively deploy technology.
Advanced technology skills are the single biggest skills gap within existing tax teams, and tax departments
are struggling to find good tax people, in addition to those with technology skills. It is essential that tax
departments have the resources to adequately train existing team members or turn to specialist tax
technologists if the right skills cannot be found.

© 2021 Thomson Reuters. All rights reserved.                                                                                          2

2021 STATE OF THE CORPORATE TAX DEPARTMENT

For those departments that have responsibility for indirect tax, which included half our sample, 57% were
anticipating major government change, more specifically, digital filing or in some cases real-time reporting.
Most survey respondents feel their departments are going to face significant challenges around technology,
processes, and human capital, in order to comply with emerging rules.
The metrics being used by tax departments focus heavily on compliance, meeting deadlines, and the quality
of data — very few metrics relate to the efficiency of the department. Perhaps if more departments look to
measure the cost of tax operations by tracking the impact of streamlining and automating processes, there
would be more data available that could demonstrate the potential of a more sophisticated approach to
using technology. Indeed, this is something which in turn reinforces the return on investment (ROI) argument
when it comes to securing budget for this technology.
It should not be overlooked that strained people start to become demotivated and can suffer from poor
mental health over time. It was therefore concerning that 29% of departments said they are planning to rely
even more heavily on their existing team to deal with their resource challenges. The report includes some
useful benchmarks for different-sized companies, which may be helpful to see whether your team is in line
with its peers. It is worth noting that the departments that felt right-sized were spending an average of
between 10% and 20% more, relative to their revenue, than those that saw themselves as under-resourced.
The final section of the report focuses on purpose and how tax department leaders describe both their
personal motivations and how their work impacts the broader society. Visiting this topic with team members
can be a great way to understand people’s personal motivations, which can highlight ways to raise
engagement and foster a deeper team spirit.

       “For those departments that have responsibility for
       indirect tax, which included half our sample, 57% were
       anticipating major government change, more specifically,
       digital filing or in some cases real-time reporting.”

© 2021 Thomson Reuters. All rights reserved.                                                                                           3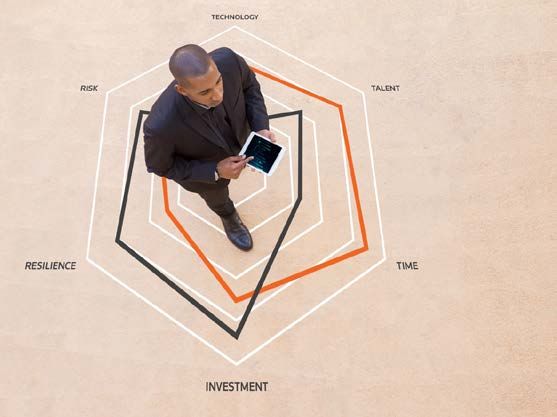
2021 STATE OF THE CORPORATE TAX DEPARTMENT

METHODOLOGY
During February 2021, Thomson Reuters’ researchers spoke to corporate tax department and indirect tax
leaders to understand the goals they were seeking to achieve and the challenges they faced. These in-depth
interviews helped researchers to design a questionnaire that would form the basis of an online survey, which
was distributed in March 2021. The survey received 821 high-quality responses.
This year, the survey responses were intentionally more global in nature, with strong representation across
the U.S., Canada, the U.K., and Mainland Europe, with a small number (24) from the rest of the world.
Within the report, the survey results are shown for the full sample with interesting differences by regions
shown in the charts or highlighted in the commentary. We also look at other subgroups of the data and
highlight where interesting differences apply — for example, different sizes of organizations. For year-on-
year comparisons with the 2020 results, we only include the U.S. results from 2021, to ensure the sample
base in consistent and that trends are genuine trends and are not just caused by sampling differences.

                                                   Organization HQ                          Tax Department HQ
                                                     3%                                         2%            0.4%

                    821
                                                  20%                                          17%

                                                                                          12%
                                                                  58%
                   Web                         14%                                                             63%
                                                                                           6%
                responses                          6%

             WEB SURVEY                            US              Europe                     US                Europe
        conducted in March                         Canada          ROW                        Canada            ROW
                                                   UK                                         UK                No HQ

                                                          6%                                         7%
                 17%                                                                           6%

                                                                                            17%                 41%
                                                 39%              55%

                               83%
                                                                                                   29%

              Corporations                         Male                                       Under 40 years
              Government/Charity                   Female                                     40 to 50 years
                                                   Other/prefer not to answer                 51 to 60 years
                                                                                              Over 60 years
                                                                                              Prefer not to state
ROW = Rest of World

© 2021 Thomson Reuters. All rights reserved.                                                                                         4
2021 STATE OF THE CORPORATE TAX DEPARTMENT

Sector

                      Manufacturing                                      17%
                                         TMT                       13%
                 Retail/Wholesale                             8%
                 Financial services                           8%
                    Energy/Utilities                     6%
                 Business services                     5%
                             Healthcare               4%
                               Transport              4%
                            Automotive               4%
                          Construction               4%
                               Insurance            3%
                           Engineering              3%
                            Real Estate             3%
              Hospitality/Leisure                  3%
                           Pharma/Bio              3%
            Food/Farming/Fish                     2%
                                  Banking        2%
                     Conglomerates               2%
                Gov/Public sector               1%
                             Investment         1%
                Natural resources              1%
                        Not-for-profit         0.4%

TMT = Technology, Media, and Telecommunications

Title of respondent
   Tax Manager/Assistant
             Tax Manager                                                                            30%
  Director/Senior Manager                                                                   26%
  VP/Senior Director of Tax                                                           24%
    Senior Tax Technologist                                        14%
     Junior Tax Technologist                       2%
                            Tax Analyst           2%
                        Other tax role           1%
       Senior Tax Accountant                    1%
                    Tax Accountant             1%

Thomson Reuters would like to thank the Tax Executive Institute for its support in providing respondents for
the early in-depth interviews and allowing us to distribute the web survey to their members, which received
fantastic engagement.

© 2021 Thomson Reuters. All rights reserved.                                                                                         5
2021 STATE OF THE CORPORATE TAX DEPARTMENT
SECTION 1
A year in review: The impact of COVID-19 on corporate tax teams
SPLIT OPINION ON WHETHER THE PANDEMIC HAS IMPACTED COLLABORATION
Although two-thirds of survey respondents feel the quality of collaboration stayed the same between
team members during the pandemic, of the remaining one-third, twice as many feel the quality of
collaboration had improved as thought it had deteriorated. Therefore, on balance, within teams,
collaboration slightly improved.
Unfortunately, when it came to collaborating with the rest of the business, one-fifth of respondents feel
collaboration had deteriorated, the same that had seen improvement. So, overall, no increase is seen.
Figure 1 – Quality of collaboration since the Pandemic
24% 20%
Better
61% Same
67%
Worse
20%
9%
Within team With rest of business
REGULAR, TECHNOLOGY-ENABLED COMMUNICATION IMPROVES COLLABORATION
For those departments that had experienced improved collaboration, there is a clear pattern in the
comments that explain why. Improved communication led to improved collaboration; and one-in-five
respondents note their department was leaning more heavily on technology like Microsoft Teams or
Zoom. Whatever the format, more regular, more personal, and more efficient communication leads to
better collaboration.
When thinking about why there may not have been the same increase in collaboration with the rest of the
business, perhaps the same efforts have not been established as with the more immediate team, or maybe
the structures are not in place for tax departments to maintain closeness to the rest of the business.
Figure 2 – Why collaboration had improved
Tech enabled better communication 20%
Team working closer 18%
More frequent meetings 18%
Communication has had to improve 14%
Improved efficiency 8%
© 2021 Thomson Reuters. All rights reserved. 62021 STATE OF THE CORPORATE TAX DEPARTMENT
TOP TIPS
• R
evisit your communications schedule within your team. Are you building in
sufficient meetings? Are the right people invited? Do you share agendas and
background information in advance? Do you agree on actions during meetings?
Are you allowing for informal relationship-building time or activities? Are you
utilizing video conferencing technologies like Zoom or Teams?
• R
evisit your communications schedule with the rest of the business and
consider all the same questions.
© 2021 Thomson Reuters. All rights reserved. 72021 STATE OF THE CORPORATE TAX DEPARTMENT
SECTION 2
Strategic goals and challenges faced
Tax reform is cited as the most common challenge faced by tax departments in 2021, consistent with
the results in 2020. Many tax departments are monitoring for further change ahead arising from new
administrations across the world, combined with continued impact of the COVID-19 pandemic. Specific tax
workstreams moved up to be the second biggest challenge cited in the survey.
New technology and automation projects, which were the second most common strategic priority in early
2020 and then took a back seat in our pulse survey last April due to the pressures of the pandemic, moved
back into the top three. A reduction in tax liability, came in as the fourth most common goal, moving up
to third for those with indirect tax responsibility and number one for tax departments in Mainland Europe.
Priorities related to cost saving, efficiency, and process improvement round out the top five.
Four new challenges emerged in 2021 which are not mentioned in our pre-pandemic survey last year — all
four pertain to the new and dynamic environments that we now all work within. These include keeping
track of macro-changes (political and economic), generally coping with the impact of the pandemic, staying
abreast of business changes, and enabling effective remote working.
Figure 3 – Global strategic goals and related challenges
Tax reform 25%
Specific tax workstream 23%
New tech / automation 16%
Reduce tax liability 11%
Efficiency / improve process 11%
Acquistions / integration 7%
Macro changes (political / economic) 7%
Cope with impact of COVID 6%
Align/keep up changing business 6%
Effective remote working 5%
New goal /challenge raised in 2021
Figure 4 – Changes since last year
US Strategic goals – 2021
Tax reform 29%
Specific tax workstation 27%
New tech / automation 21%
US Strategic goals – 2020
Tax reform 32%
New tech / automation 30%
Efficiency / improve process 14%
Significantly more common in 2021
© 2021 Thomson Reuters. All rights reserved. 82021 STATE OF THE CORPORATE TAX DEPARTMENT
Figure 5 – Strategic goals by region
US
Tax reform 29%
Specific tax workstream 27%
New tech / automation 21%
Efficiency / improve process 13%
Acquisitions / integration 10%
Canada
Specific tax workstream 31%
New tech / automation 21%
Tax reform 17%
Effective remote working 12%
International tax requirements 10%
Finding / recruiting right talent 10%
UK
Tax reform 17%
Macro changes (political/economic) 17%
Reduce tax liability 16%
Coping with impact of COVID 13%
Timely / accurate filing 9%
Mainland Europe
Reduce tax liability 21%
Specific tax workstream 16%
Tax reform 16%
Coping with impact of COVID 10%
Efficiency / improve process 8%
New goal /challenge raised in 2021
© 2021 Thomson Reuters. All rights reserved. 92021 STATE OF THE CORPORATE TAX DEPARTMENT
SECTION 3
Measuring success: A metrics framework
Virtually all tax departments utilize metrics to help them run their department
successfully. The metrics are generally split into three themes — effectiveness, efficiency,
“The metric that
and talent management. stands out above
PROVIDING AN EFFECTIVE TAX FUNCTION
all others…is
The metric that stands out above all others as most useful to the largest number of tax
departments is meeting deadlines/complying with tax requirements. Closely related is high meeting deadlines/
accuracy or quality of work and completing work/filing returns. In other words, getting the
work done, accurately and on time. complying with tax
The next effectiveness metric relates to how much tax is being paid — for some companies
this is measured by the effective tax rate (ETR), for others by the cash tax paid, and for
requirements.”
others in tax savings. This is most likely to be a metric to minimize, but as scrutiny increases
on large companies paying their fair share of taxes, there is arguably merit having this metric
land in what is seen to be the lower end of a reasonable range.
The final metrics in the effectiveness bucket are penalties incurred or tax risks/exposures.
This is clearly one to minimize as well, and one in which technology can play a key role in
facilitating accurate and timely reporting.
RUNNING AN EFFICIENT TAX OPERATION
In a similar vein to effectiveness metrics, there are many ways to measure efficiency. The most common
is to see whether costs are in line with the budget — this is clearly an important metric to keep on top of,
especially when implementing new technology or processes which may reduce costs and support a wider
business case towards digitalization.
More detailed ways of measuring efficiency cited included tallying the number of hours to get work done and
what proportion of these are normal hours as compared to overtime. This helps departments keep on top
of people efficiency and build a case for the necessary recruitment required to minimize overtime spending
and preserve the well-being of the team. How these hours would change with the introduction of different
technology solutions is also a great way to show return on investment — particularly alongside any data that
highlights accuracy improvements (reducing repeated work and potential penalties) or quicker turnaround
times. It is useful to track how much work is supported by technology and how this measure increases over
time. One last tech metric to consider is how many tax processes are currently being automated and how
much of the tax data is integrated into one tax engine.
A couple of missing metrics perhaps, would be those that measure total spend (internal plus external)
relative to revenue and the split of internal and external spend. If a department is able to access
benchmarks, these two metrics should enable it to see if it’s in a sensible range for its size and whether the
typical balance of internal/external resources is in an optimal range. The survey suggests just 2% of tax
departments report measuring external tax spend as a core key performance indicator (KPI), which is lower
than expected.
© 2021 Thomson Reuters. All rights reserved. 102021 STATE OF THE CORPORATE TAX DEPARTMENT
ENGAGING AND RETAINING TALENT
The survey shows that simply finding quality people was the biggest recruitment challenge, so it pays to look
after existing team members well and help them maximize their potential within the organization. Only a
small number of tax departments look to talent metrics to help their department be successful — and this is
a missed opportunity.
Measuring investments in training and the development of new skills is the most cited talent metric, but by
very few departments. This is closely followed by well-being/morale and individuals’ performance against
goals. Another metric to consider in this vein is the extent to which automation is freeing up key team
members to focus on more strategic work, which both adds value to the department’s outputs and generates
improved career opportunities.
Overall, there are many metrics to consider, and those shown in the chart below are cited as the most
important by survey respondents. Actual adoption of these metrics is likely to be higher.
Figure 6 – Measuring performance – most important metrics
Effective = Compliant, accurate, Efficient = Minimize costs of Engaged team =
timely, minimize taxes, penalties running department, Leverage Skills development,
and exposures technology, external spend wellbeing, clear goals
Deadlines met / Costs relative Training /
compliance 32% to budget 6% development 4%
Quality / Accuracy Wellbeing /
of work 11% Efficiency 5% morale 3%
Work completed / Staff hours / Individuals
retrurns filed 9% overtime 5% hitting goals 2%
ETR (effective tax Technology /
rate) 9% automation 3%
Cash tax paid 8% External spend 2%
Tax savings 6%
Penalties incurred 4%
Tax risks /
exposures 3%
USING BENCHMARKS TO PROVIDE GUIDANCE AND CONTEXT
Benchmarks are useful in five ways:
1 T o provide evidence for budget requests
2 T o measure progress over time
3 T o compare your performance to peers
4 T o compare performance between business units
5 T o measure return on investment for specific initiatives
© 2021 Thomson Reuters. All rights reserved. 112021 STATE OF THE CORPORATE TAX DEPARTMENT
That said, it is worth noting that benchmarks can be misleading — particularly when measuring costs.
Different organizational demographics can change the level of resources required; for example, larger
organizations access significant economies of scale. There is not a linear relationship between the size of
the organization and the tax budget required. Different challenges like extensive tax reform or real-time
reporting requirements put a heavier demand on resources. The more sophisticated tax departments, which
have integrated, streamlined tax engines, spend significantly more than their chaotic, reactive counterparts.
Therefore, benchmarks must be considered carefully, but they are an extremely useful tool. And it is critical
for departments to optimize their value.
BENCHMARKS FOR DIFFERENT TYPES OF TAX DEPARTMENTS
In the table below, we offer benchmarks from our data to provide some context to your own efficiency
metrics. It is worth noting that tax departments that consider themselves right-sized, spend between 10%
and 20% more on internal and external tax work as a proportion of their revenue. Therefore, when reading
the benchmarks for the different-sized organizations and the two industry groups, you should add a
premium of 10% to 20% if you desire a right-sized, rather than average, benchmark.
Financial institutions spend nearly three-times as much as other industries, and a similar pattern is observed
in legal spend.
The proportion of revenue allocated to the tax department decreases exponentially as the size of company
rises, revealing the huge economies of scale.
A typical organization has 0.5 tax professionals for every $100 million in revenue globally, although
smaller organizations have more, relative to their size. More than half (56%) of organizations also have at
least one analyst or tech support role in their tax department, and a similar proportion have one or more
administration or general support roles. Departments which did include one or more of these support roles
are typically spending twice as much as those without.
All departments are spending a similar proportion of their internal budget on technology at around 15%.
Bear in mind, that for right-sized departments, that means 10% to 20% more in value of spend than for the
average department.
Proportion of Headcount – Tax
Total spend as Proportion of Proportion of internal spend professionals
a proportion of total spend that total spend that that is on per $100m
revenue is exernal is internal technology revenue globally
Median Mean Mean Mean Median
Overall 0.12% 44% 56% 15% 0.50
Right-sized* 0.14% 39% 61% 15% 0.60
Financial institutions 0.30% 48% 52% 16% 1.20
Industry
Other industries 0.11% 44% 56% 15% 0.472021 STATE OF THE CORPORATE TAX DEPARTMENT
SPEND ON TAX TECHNOLOGY
The typical department is spending $100,000 per year on tax technology. However, the range in spend was
vast, with the highest being nearly $4 million and typically increasing in line with the size of the company.
The chart below shows the majority of the range but excludes seven outliers.
Tax departments that described themselves as optimized or predictive departments spend an average of
20% of their internal budget on technology, almost twice the level of chaotic departments.
Figure 7 – Spend on technology by tax department
$2,500,000
$100k
Median spend
on technology $2,000,000
Spend on technology
$1,500,000
$1,000,000
$500,000
$0
0 50 100 150 200 250
TOP TIPS
• P
repare or review a list of your functional goals and strategic priorities for the
year ahead. For each goal, try to assign a metric which covers effectiveness
(including risk prevention), efficiency, or talent management. Some goals may
satisfy all three. Try to focus on metrics that deliver closely to the organization’s
goals and try not to have too many! It is useful to include some metrics that
give you some meaningful benchmarks.
• O
nce the metrics are set, cascade these down to individual team members’
objectives.
• U
tilize the benchmarks within this report to check whether your department
budget and team size is comparable to peers. Select the row that is most
relevant to your size of company, and add 10-20% for a ‘right-sized’
benchmark.
© 2021 Thomson Reuters. All rights reserved. 132021 STATE OF THE CORPORATE TAX DEPARTMENT
SECTION 4
Trends in resourcing
TAX DEPARTMENTS HAVE STRAINED RESOURCES
Nearly half of corporate tax departments report being strained from a resourcing perspective. The situation
is worst in the U.S., where 56% of departments feel under-resourced, up 4 percentage points compared to
the first quarter of 2020. U.K. tax departments are in better shape from a resourcing perspective, whereas
those in Mainland Europe show a more mixed result.
Figure 8 – Perceptions of current resource levels
Global Regional
4% 25%
37%
46%
56%
49% 47%
73% 50%
52%
43%
13%
1% 2% 2%
U.S. Canada U.K. Mainland
Europe
Under-resourced About right Over-resourced
The analysis showed that under-resourced companies spend approximately 14% less, on average, than
sufficiently resourced companies. The potential risks from a compliance, work quality, and talent retention
perspective should be warning enough for departments to address this shortage, but a rightly resourced
team may also be able to find further tax savings.
“Nearly half of corporate tax departments report
being strained from a resourcing perspective.”
© 2021 Thomson Reuters. All rights reserved. 142021 STATE OF THE CORPORATE TAX DEPARTMENT
TAX DEPARTMENTS LOOKING AT MULTIPLE STRATEGIES TO ADDRESS RESOURCE GAPS
Throughout 2020, corporate tax departments said they employed multi-faceted strategies to address
resourcing shortages. The most common strategy cited by respondents in every region is introducing more
technology and automation. This strategy offers two immediate benefits: it enables existing team members
to focus on higher value tasks; and it reduces human error, which is likely to increase when people are
overworked. Survey respondents cited streamlining processes to create more efficiency next most often used
strategy, which itself often goes hand-in-hand with new technology implementations.
From a recruitment perspective, nearly one-third of departments said they are looking to hire more qualified
tax professionals, whereas only 13% are looking to hire more analysts or tech support. Interestingly to the
latter point, the report notes that the biggest skills gap in tax departments relates to technology.
Just under one-third of respondents say they are going to rely more heavily on their existing team members
and just less than one-quarter say they will look to external advisors to address gaps in either skills or capacity.
Figure 9 – Strategies to address resource gaps
Introduce technology /
automation 45%
Introduce efficiencies 41%
Recruit qualified tax
professionals 31%
Rely more heavily on
existing team 29%
Rely more on third
party resource 24%
Recuit analyst / tech
support 13%
Don't anticipate any
changes 13%
Recruit admin
headcount 10%
“The most common strategy cited by respondents
in every region is introducing more technology
and automation.”
© 2021 Thomson Reuters. All rights reserved. 152021 STATE OF THE CORPORATE TAX DEPARTMENT
TECHNOLOGY SKILLS GAPS IN EXISTING TEAMS
When it comes to skills gaps, departments say that advanced technology tops the list for their existing
teams. This calls into question the fact that more departments say they are looking to hire tax professionals
who have technology skills, compared to those departments that are looking to embed pure technologists
or analysts.
For new hires, the general quality of candidates on the market is insufficient, according to nearly one-fifth
of departments. Further, 14% of departments say they can’t find candidates with sufficient tax experience
and 7% can’t find candidates with advanced technology skills.
There were fewer skills gaps mentioned overall for external advisors, although 11% feel their advisors lack
an understanding of their business, and 9% note a lack of cost and budgeting skills among their external
advisors. Both of these frustrations came through when respondents were asked about weaknesses in
external advisors last year as well.
Figure 10 – Technology skills gaps
Existing team
Advanced technology 21%
Tax experience 12%
International tax 9%
Tax technical 7%
Indirect tax 4%
Data analytics / Analyst 4%
Tax reform / compliance 3%
New hires
Finding good people 19%
Tax experience 14%
Advanced technology 7%
Tax technical skills 5%
International tax 3%
Accounting skills 2%
Indirect tax 2%
Advisors
Understand our business 11%
Cost / budgeting 9%
Tax experience 5%
Finding good people 4%
Advanced technology 3%
Communication 3%
Industry expertise 3%
© 2021 Thomson Reuters. All rights reserved. 162021 STATE OF THE CORPORATE TAX DEPARTMENT
GETTING THE BEST OUT OF EXTERNAL ADVISORS
Forty percent of in-house tax professionals said they felt able to call out an individual tax advisor that they
considered to stand out from the rest. These exceptional advisors had an array of different qualities.
Stand-out tax advisors offer top-quality work and often have a distinct, deep specialism. They also are often
praised for being approachable and friendly. Their human approach, being able to empathize with clients
and form a more personal relationship, elevates these professionals into a trusted advisor status.
Service qualities were also important, including responsiveness, effective communication, and quick
turnaround times.
Stand-out tax advisors also develop a good understanding of the client’s business, so that they can put their
advice in context. Closely related qualities include being practical and pragmatic and providing solutions
that work for the company.
Expertise
Service Integrated
Stand-out tax
advisor
qualities
Business Style
savvy
40% identified a
stand-out advisor from
the external tax firms
they’d worked with
© 2021 Thomson Reuters. All rights reserved. 172021 STATE OF THE CORPORATE TAX DEPARTMENT
Figure 11 – Top individual qualities from the external tax firms they’d worked with
Quality of work 32%
Specialist knowledge 21%
Aproachable /
friendly 17%
Responsive 16%
Knows our business 13%
Communication 9%
Practical / pragmatic 9%
Thorough / attention
to detail 8%
Finds solutions /
solves problems 7%
Intelligent /
competent 6%
Quick turnaround /
meets dealines 6%
TOP TIPS
• H
elp your external advisors deliver exceptional service by providing them with
information about your business and how you would like to be serviced. Spend
time together, to see if more personal relationships can be formed.
• M
easure your advisor’s performance on these qualities and share the results
with the advisor, providing examples of where improvements could be made.
This will enable advisors to step up their game, and if they don’t, departments
could then consider a new provider and use these qualities to assess which
ones will do the best job.
• A
lthough these qualities are related to external advisors, the list also
represents qualities that your in-house team should be demonstrating to your
internal business colleagues. Are you supporting your in-house team with the
right knowledge and tools to achieve this objective?
© 2021 Thomson Reuters. All rights reserved. 182021 STATE OF THE CORPORATE TAX DEPARTMENT
SECTION 5
Special topic: Indirect tax and digital filing
Around one-half the representatives from tax departments who completed the survey had responsibility
for indirect tax. These respondents were asked a series of questions relating to indirect tax resourcing and
movement towards digital filing requirements.
MAJORITY RESOURCE INDIRECT IN-HOUSE
Seven-in-ten corporate tax departments say they resource their indirect tax work either ‘predominantly’ or
‘completely’ in-house. A similar pattern applies in each region, with very few Canadian tax departments
outsourcing this work at all.
Figure 12 – Approach to resourcing indirect tax
Global Regional
4%
10% 37% 38%
45%
64%
17% 43%
19% 35% 36%
26%
18% 24%
16%
20%
14% 8% 9% 4% 2%
4% 4% 3%
U.S. Canada U.K. Mainland
Europe
All in-house Majority in-house Both in-house and Majority outsourced All outsourced
outsourced equally
DIGITIZED TAX FILING AND REAL-TIME REMITTANCE EXPECTED WITHIN NEXT 2 YEARS
Looking ahead one to two years, more than one-half of tax departments say they anticipate significant
change to government requirements for indirect tax — more specifically, they expect increased digitized tax
filing and real-time remittance requirements. The expectation for change is highest in Europe, with 64% of
Mainland Europe-headquartered companies and 62% of U.K. companies expecting significant change, some
of which is already underway.
© 2021 Thomson Reuters. All rights reserved. 192021 STATE OF THE CORPORATE TAX DEPARTMENT
Figure 13 – Expectation of significant change to government requirements in the next 1-2 years
Global Regional
52% 56% 62% 64%
43%
57%
48% 44% 38% 36%
U.S. Canada U.K. Mainland
Europe
Expecting significant change* Not expecting significant change
*Increasing digitized indirect tax filing and/or real-time remittance requirements
MAJORITY FORESEE CHALLENGE IN GETTING READY FOR NEW REQUIREMENTS
Most tax departments (80%) say that these expected changes in requirements pose a challenge, most
significantly in relation to technology and process. Yet, nearly 70% say they also see talent challenges as well.
For tax departments of companies headquartered in Mainland Europe, where change is already underway in
many jurisdictions, the sentiment intensifies, particularly around the people challenges. However, most tax
departments surveyed operate across multiple jurisdictions so dealing with many different sets of changes
at different times. Clearly, there is significant work to do to comply with new government requirements for
most tax departments.
Figure 14 – Level of challenge in people, process,and technology to get ready for the changes
Global Mainland Europe
21% 27% 29% 34% 28% 34%
46%
57% 51% 42% 59% 50%
33%
20% 23%
16% 13% 16%
People Process Technology People Process Technology
Significant challenge Medium challenge Low challenge
© 2021 Thomson Reuters. All rights reserved. 202021 STATE OF THE CORPORATE TAX DEPARTMENT
PACE OF CHANGE AND LEVEL OF CHALLENGE DIFFERS BY JURISDICTION
Eighty percent of tax departments note they have responsibility for tax in multiple countries, typically
five countries (median) but an average of 17 countries (mean). Even those operating in just one country,
such as the U.S., say they will be dealing with different requirements across different jurisdictions. These
departments with multi-jurisdictional coverage can compare and contrast the different government
approaches in the markets in which they are active. In this way, departments learn as they adapt to the most
digitally progressive jurisdictions, which then helps to get them ready in advance for the jurisdictions that
follow.
Jurisdictions mentioned as challenging included:
• U.S. (especially California)
• U.K.
• Canada
• India
• Germany (and Europe more broadly)
• Mexico
• Brazil
Departments’ strategies for adapting to changing requirements varied, but the most commonly cited ones
included a mix of additional resources, specialized skillsets, and technology implementation. Specific
strategies mentioned, in ranking order, include:
• Hiring external consultants
• Automation
• Streamlining processes
• Keeping up with legislation
• Hiring more people
As example of these strategies in practice, survey respondents cite:
“Automated the tax workflow and outsourced indirect tax filings”
“Solidify sales/use tax process around manufacturing”
“Daily updates, forecast modeling, building out technology and automation”
“Documenting digital sales processes — taxability, legal entity issues”
“Analyzing data better to ensure we are correctly reporting non-physical location sales.”
TOP TIP
• Check out the free resources available on the web sites of external tax advisors
and law firms which have specialized tax teams.
Visit https://tax.thomsonreuters.co.uk/webinars/discovering-the-
opportunities-of-embracing-global-tax-digitalisation/ to access the recording
of a recent webinar focused on the digitalization of tax.
See also https://tax.thomsonreuters.com/en/corporation-solutions and
https://tax.thomsonreuters.com/blog for more free resources.
© 2021 Thomson Reuters. All rights reserved. 212021 STATE OF THE CORPORATE TAX DEPARTMENT
SECTION 6
Sophisticated tax departments: Leveraging technology to
improve operations
Throughout the survey, technology is consistently mentioned as a priority for tax departments. Implementing
new technology was a top three goal for corporate tax departments this year. Advanced technology skills
show up as the major skills gap, which is most likely to be lacking in existing team members; yet just about
13% of departments say they are looking to hire tax technologists or analysts in the year ahead.
CURRENT ADOPTION LEVELS
In the survey, we wanted to get a picture of current adoption levels, so we asked which technologies tax
departments were using and which were highest impact, compared to which were most under-utilized. The
most adopted technologies were direct tax compliance and tax provision and these two were considered to
have the most positive impact, relative to adoption. Indirect tax compliance and indirect tax determination
were the next most implemented technologies. Indirect tax determination is the third technology with the
most positive impact, relative to adoption.
Three technologies stood out as being under-utilized — tax data management, tax workflow management,
and tax analytics and KPIs.
Figure 15 – Current technology implemented and perceived impact
Technology Currently Implemented Most positive impact* Most under-utilized*
Direct tax compliance 56% 2 41% 13%
Tax provision 55% 1 48% 16%
Indirect tax compliance
solution
32% 25% 17%
Indirect tax
determination engine
26% 3 34% 9%
Country by country
reporting
22% 10% 15%
Tax workflow
management
22% 23% 2 26%
Tax data management 21% 26% 1 29%
Transfer pricing
documentation
20% 8% 16%
Tax analytics and KPIs 11% 17% 3 25%
Digital tax reporting 10% 28% 15%
FATCA / CRS / AEOI 5% 7% 21%
*Those calling out as most positive or most under-utilized as a proportion of those with technology currently implemented
© 2021 Thomson Reuters. All rights reserved. 222021 STATE OF THE CORPORATE TAX DEPARTMENT
Adoption varied significantly by market. U.S. and Canada departments are more focused on a couple of
core technologies with high adoption — direct tax compliance and tax provision. Overall, U.S. departments
are using 2.7 of the technologies listed, and Canadian departments are using just 2.2. Mainland Europe tax
departments adopt a broader spread of technologies — 2.9 on average — with higher adoption on tax data
management, tax analytics, and digital tax reporting technologies. U.K. tax departments are using the most
technologies of all — 3.2 on average — and are more likely to be adopting indirect tax compliance, indirect
tax determination, and tax workflow management technologies.
Two core technologies — direct tax compliance and tax provision — were among the top three favorites,
relative to adoption, for U.S., Canadian, and Mainland European departments; but U.K. departments found
the most impact from indirect tax compliance, tax workflow management (along with Canada), and indirect
tax determination (with the U.S.). In Mainland Europe, tax data management and digital tax reporting were
also found to be most impactful.
Figure 16 – Technology currently implemented in each region
Technology U.S. Canada U.K. Mainland Europe
Direct tax compliance 62% 51% 51% 44%
Tax provision 64% 49% 41% 38%
Indirect tax
compliance solution
33% 20% 44% 29%
Indirect tax
determination engine
29% 13% 31% 20%
Country by country
reporting
20% 20% 21% 29%
Tax workflow
management
19% 11% 30% 27%
Tax data management 16% 9% 28% 33%
Transfer pricing
documentation
19% 20% 17% 24%
Tax analytics and KPIs 5% 9% 27% 21%
Digital tax reporting 3% 4% 26% 22%
FATCA / CRS / AEOI 3% 9% 6% 9%
Significantly higher than global Most impactful, relative to adoption
Significantly lower than global
© 2021 Thomson Reuters. All rights reserved. 232021 STATE OF THE CORPORATE TAX DEPARTMENT
DRIVERS OF SUCCESS OR FAILURE IN ADOPTING TECHNOLOGIES
Technologies that make the most positive impact are those that create efficiencies and improve data quality,
the survey shows. This might be saving time and therefore cost, turning work around quicker, and reducing
errors; others see the impact as improving reporting or enabling better control. There are many benefits seen
to having more organized and well-managed tax data as well.
The top reasons why technologies are most under-utilized are because of the resources involved in
implementing the technology. There also may be a lack of budget or a lack of skills. This is compounded
by the seeming complexity of certain tools or a lack of training. Sometimes people are simply resistant to
change and stick to using simpler technology with which they are already familiar.
Figure 17 – Reasons why technology has most positive impact
Speed / time saving 27%
Creates efficiencies 19%
Reduce risk of errors 12%
Improved quality of data / reporting 8%
Use the most / depend on it 6%
Cost-saving 6%
Enables compliance / control 4%
Manages / organizes data 3%
Figure 18 – Reasons why technology is under-utilized
Lack of time / resource 28%
Cost / budget 12%
Lack of people skilled to use 11%
Early stage of adoption 6%
More / better training needed 6%
Rely on other technologies 4%
Unrealized applications 4%
Too complex / difficult to use 3%
© 2021 Thomson Reuters. All rights reserved. 242021 STATE OF THE CORPORATE TAX DEPARTMENT
TOP TIP
• W
hen making investments in technology, ensure you provide sufficient budget
to successfully embed the technology, in terms of changing processes and
training existing team members. Bring in specialist talent to help drive success.
© 2021 Thomson Reuters. All rights reserved. 252021 STATE OF THE CORPORATE TAX DEPARTMENT
MAPPING OUT A JOURNEY TO BECOMING MORE SOPHISTICATED
As part of the survey, we created a useful framework that groups departments on the basis of their
approach to using technology and associated processes. We asked respondents to categorize themselves
into whichever grouping they thought most closely represented their approach. More than one-half of
departments place themselves in the two least-sophisticated categories — chaotic and reactive. Just less
than 20% consider themselves to be in the top categories, optimized or predictive.
Figure 19 – Thomson Reuters’ Technology Sophistication model
Chaotic Reactive Proactive Optimized Predictive
21% 32% 23% 10% 8%
Using email, Utilizing tax Integrated with Analytics driven Leveraging rule-
spreadsheets, department enterprise data decision making, based technology and
system reports, and databases, some and leveraging reporting available embedded enterprise data
manual processes to 3rd party software, tax automation as needed, and for automated workflows,
collect, review, and with some software for file-ready tax workflows alerts, pre-audit analysis,
prepare compliance automated feeds, compliance, storage are completely and reporting across the
and respond to but not connected of documents and automated across enterprise; proactively
audits; individual tax to enterprise data or data; formalized the enterprise managing risk and
departments work departments across coordination and regularly advising key
independently the company processes with other decision makers with
departments analysis
6% felt their departments did not fit any of these categories
“More than one-half of departments place themselves
in the two least-sophisticated categories — chaotic
and reactive.”
© 2021 Thomson Reuters. All rights reserved. 262021 STATE OF THE CORPORATE TAX DEPARTMENT
Tax departments in Mainland Europe are more likely to be optimized than any other region; while U.S. departments are lagging the field
with the highest proportion saying they are reactive.
Figure 20 – Thomson Reuters’ Technology Sophistication model by region
US Chaotic Reactive Proactive Optimized Predictive
24% 39% 21% 5% 6%
Canada Chaotic Reactive Proactive Optimized Predictive
29% 27% 20% 13% 9%
UK Chaotic Reactive Proactive Optimized Predictive
12% 27% 29% 12% 12%
Mainland Chaotic Reactive Proactive Optimized Predictive
Europe 12% 21% 26% 23% 12%
One of the upsides of being a more sophisticated department is the higher likelihood of being right-sized
in terms of resources. Almost twice as many chaotic and reactive departments feel under-resourced, when
compared to optimized and predictive departments.
Figure 21 – Perception of current resource levels by sophistication of department
35% 31%
55%
65%
60% 64%
42%
32%
3% 3% 5% 5%
Chaotic Reactive Proactive Optimized/
Predictive
Under-resourced About right Over-resourced
© 2021 Thomson Reuters. All rights reserved. 272021 STATE OF THE CORPORATE TAX DEPARTMENT
One of the downsides of being more sophisticated is the higher operational costs involved. Effective
technology and streamlining processes take significant investment, as do advanced technology skills. We
found that optimized and predictive departments were spending three times as much per dollar of revenue
on the tax department budget, when compared to chaotic and reactive departments.
SECURING BUDGET FOR TECHNOLOGY
Most departments hold the budget for tax technology within the finance and accounting department. In the
U.K. and Europe, however, budgets were much more commonly held by the IT department (in around 25% of
cases, compared to in fewer than 10% of North American companies).
Two-thirds of VPs of Tax and Senior Managers surveyed were decision-makers when it came to selecting
technology and securing budget. Almost everybody we surveyed had an influential role.
Budgets are tight coming into 2021, and this has created challenges in securing resources for new
technology implementations. Some departments struggled to quantify the benefit or the return on
investment (this challenge was much more common in North America than in Europe). And it’s not just the
cost of the technology itself, resources need to be made available for training and implementation as well.
Figure 22 – Where tech budget comes from Figure 23 – Who is responsible for making business case
2%
8%
14% 67% of Tax VPs/
Senior Directors have
ultimate responsibility for
76% making a business case
for new technology
Accounting & tax Other department The majority of senior tax professionals play an influential role
department budget budget
IT department budget It depends
Figure 24 – Challenges in securing a budget
Tight company budgets 28%
Quantifying benefit / ROI 18%
Attitudes / buy-in 9%
Price / cost 7%
Implementation resources 6%
No challenges 21%
© 2021 Thomson Reuters. All rights reserved. 282021 STATE OF THE CORPORATE TAX DEPARTMENT
When it comes to making the business case, direct cost saving most often was cited as the most important
argument. But more departments in total would put forward the impact on quality, accuracy, and
standardization as a desirable outcome. Risk reduction came next followed by speed of processing and
general efficiency. Given the strained resources in nearly one-half of tax departments, it is not surprising
that freeing up the team to conduct higher value work was also a top three argument for more than one-
third of departments. Just 12% called out ease of use; yet, given the common outcome of technologies
being under-utilized once implemented, we would recommend that departments see this as an important
selection criterion.
Figure 25 – Making the business case
Direct cost savings 36% 9% 9%
Quality / accuracy /
standardization
19% 24% 19%
Risk reduction 15% 17% 14%
Speed of processing /
turnaround
13% 16% 8%
Efficiency 8% 15% 18%
Free up team for
higher value work 7% 11% 17%
Ease of use / likely
2% 3% 7%
usage
First rank Second rank Third rank
“When it comes to making the business case,
direct cost saving most often was cited as the
most important argument.”
© 2021 Thomson Reuters. All rights reserved. 292021 STATE OF THE CORPORATE TAX DEPARTMENT
SECTION 7
Finding a greater purpose for the corporate tax department
Words and acronyms such as purpose, CSR, and ESG are increasingly talked about as priorities for
corporations. However, these efforts can often feel removed from individual employees working within an
organization. Yet, the pandemic has provided an opportunity for many people to reflect on their lives and
their role in the world. As part of the survey, we wanted to hear how those leading and running corporate
tax departments feel their roles impact on broader society and to understand what they believe their
professional purpose to be.
Personal professional purpose Broader impact on society
Taxes paid Mentor
Run a Help the Company/I Enable job
Reach my enable others
successful company directly and wealth
potential government in the
department succeed help society creation
services profession
PERSONAL MOTIVATIONS
More than one-half of respondents say they feel their personal purpose at work is about their own job
performance — continuing to develop in the role and performing at a high standard to gain job satisfaction
and just reward. Many sought a better work-life balance, which became an increasingly common desire in
wake of the pandemic.
For others it was more at a department level — running an efficient operation with high standards and
developing the talent on the team for members to reach their potential. As one department leader said:
“I would like to achieve efficiency across our organization. That includes learning about new
technologies and retaining existing employees, hiring new ones, so that new technologies
are implemented and used to achieve the highest level of efficiency and cost savings.”
Still, for others the purpose was at a broader organizational level — equipping organization leaders to make
the right decisions and create value for the company.
TAX DEPARTMENTS IMPACT BROADER SOCIETY
The products and services offered by certain companies, for example, those in the healthcare or educational
field, directly help society. Thus, the tax departments at these organizations feel pride in helping the
company to succeed. For other companies, the products themselves may not directly help society, but the
tax department itself may help the company to save money and redirect those resources to good causes.
Further, 11% of respondents also mention volunteering and charitable work.
For others, the indirect impact of helping to run a successful company means local communities benefited
by way of job and wealth creation. Others cite the taxes paid, making sure they were fair and noting how this
enables government services to run.
Just less than 10% talk about giving back to the tax industry through mentorship, empowering others, or
simply being an active role model, particularly for those from diverse backgrounds.
© 2021 Thomson Reuters. All rights reserved. 302021 STATE OF THE CORPORATE TAX DEPARTMENT
TOP TIPS
• G
ather the team together to share individual perspectives on purpose. Consider
enabling people to develop their own goals as well as a team-based goal.
• Create metrics to track impact and raise engagement.
CONCLUSIONS
This year’s report reveals that tax departments are at various stages in the transition to becoming more
technology-enabled. The most sophisticated departments, which remain the minority, are reaping the
benefits of investments in streamlining and automating processes. Leaders there feel in better shape to
achieve their departments’ strategic goals and address the challenges they face.
Chaotic and reactive departments, on the other hand, are feeling strained and are more likely to be in the
unfortunate position of having to take on new technology projects at the same time as they strive to simply
get through the day-to-day.
In any case, gathering the data to prove the business case for investing in technology projects is the first step
to starting the process of change.
© 2021 Thomson Reuters. All rights reserved. 31STELLAR PERFORMANCE:
2021 STATE OFATHE
SURVEY OF STAND-OUT
CORPORATE TALENT
TAX DEPARTMENT
Thomson Reuters is a leading provider of business information services. Our products include
highly specialized information-enabled software and tools for legal, tax, accounting, and compliance
professionals combined with the world’s most global news service – Reuters.
For more information on Thomson Reuters, visit tr.com and for the latest world news, reuters.com.
THOMSON REUTERS INSTITUTE
The Thomson Reuters Institute brings together people from across the legal, corporate, tax & accounting,
and government communities to ignite conversation and debate, make sense of the latest events and trends,
and provide essential guidance on the opportunities and challenges facing their world today. As the dedicated
thought leadership arm of Thomson Reuters, our content spans blog commentaries, industry-leading data
sets, informed analyses, interviews with industry leaders, videos, podcasts, and world-class events that deliver
keen insight into a dynamic business landscape.
Visit thomsonreuters.com/institute for more details.
© 2021 Thomson Reuters. All rights reserved.You can also read