2021 Weather,
Climate and
Catastrophe Insight
←
→
Page content transcription
If your browser does not render page correctly, please read the page content below
2021 Weather, Climate and Catastrophe Insight

2021 Weather, Climate and Catastrophe Insight
Table of Executive Summary 4 Historical Database Reanalysis
& Loss Development 34
Appendix A: 2021 Global Disasters
United States 80
80
Contents Opening Remarks: What Can We
Do Today to Plan For Tomorrow? 6 2021 Global Catastrophe Review 36
Remainder of North America (Non-U.S.) 82
South America 84
United States 38 Europe
85
How This Report Can Help Build Americas (Non-U.S.) 40 Middle East 86
and Promote Resilience 7
EMEA (Europe, Middle East & Africa) 42 Africa
87
APAC (Asia & Pacific) 44
2021 Natural Disaster Events & Asia
87
Loss Trends 8 2021 Natural Peril Review 46
Oceania
90
Global Economic Losses: Seventh Costliest Year Focus Topic: Tropical Cyclone 48 Appendix B: Long-term Natural
on Record 8
Focus Topic: Severe Convective Storms 54 Disaster Trends 91
Global Insured Losses Surpass $100B for the
Fourth Time in Five Years 12 Focus Topic: Flooding 57
Better Forecasting and Preparation Leads to Focus Topic: Wildfire 60 Appendix C: Historical Natural
Continued Decline in Fatalities 16 Focus Topic: Drought and Extreme Heat 62 Disaster Events 93
Natural Disasters Defined: Stable Number of Focus Topic: Winter Weather 65
Events as Costs Rise 17
Focus Topic: Additional Perils 67
Appendix D: Global Tropical
Cyclone Activity 97
Seasons of Change 20
2021 Climate Review 68
2 Climatological Normals 20
IPCC’s Sixth Assessment Report Highlights
Appendix E: United States Severe
Need for Climate Urgency 70 Weather Data 98
Real-Time Impact of Climate 2021 Marks the Sixth-Warmest Year on Record
Change 22 Dating to 1880 71 Appendix F: Global Earthquakes 100
Physical Risk: Building for an Evolving Climate 24 Greenhouse Gas Emissions Hit New Highs as
Beyond Physical: Recognizing Transition Risk
Accelerated Increase Persists 72 Appendix G: United States
and Regulatory Requirements 25 Twin Episodes of La Niña Affect Global Weather Wildfire Data 101
Patterns in 2021 73
Climate Impact on Health 26
Supply Chain: Managing Connected Extremes 27
Arctic & Antarctica: Melting Sea Ice Impact Forecasting Model
Elevating Risk Management to Enhance
Threatens Ecosystems 74
Coverage Map 102
Global Ocean Heat Content Sets Record High
Disaster Responses 30
in 2021 76
Climate Displacement 31
Annual Climate Extremes 77
2021 Weather, Climate and Catastrophe Insight

                                                Executive   Economic Loss

                                                            $343
                                                                                       Insured Loss

                                                                                       $130
                                                                                                                                                                                                  Germany, Belgium
                                                                                                                     401                                                                          Austria, Luxembourg,
                                                Summary     billion
                                                            27% above the
                                                                                       billion
                                                                                       76% above the
                                                                                                                     number of notable disaster events
                                                                                                                                                                                                  and China
                                                            21st Century average       21st Century average                                                                                       recorded the costliest insurance industry events on record

                                                                                                                     $36 billion
                                                                                                                     insured loss from Ida, 4th costliest hurricane
                                                                                                                     on record for insurers                                                       2,248
                                                                                                                                                                                                  number of fatalities from Haiti Earthquake,

                                                            62%                        71%                                                                                                        deadliest event of 2021

                                                            Global Protection Gap      of global insured

                                                                                                                     $17 billion
                                                                                       losses were recorded
                                                                                       in the United States

                                                                                                                     insured loss from winter weather; costliest
                                                                                                                                                                                                  0.84°C (1.51°F)
                                                            50                         20
                                                                                                                     year on record for this peril
                                                                                                                                                                                                  Above the 20th Century Average (NOAA): World’s sixth-warmest
                                                                                                                                                                                                  year on record for land and ocean temperatures dating to 1880
                                                            billion-dollar economic    billion-dollar insured

                                                                                                                                                                                                  54.4°C (130.0°F)
                                                            loss events (4th highest   loss events (4th highest
                                                            on record)                 on record)
           4
                                                                                                                     $13 billion                                                                  Temperature on July 9, 2021 in Death Valley, California (USA);
                                                                                                                     insured loss from European floods in July, the                               unofficially the hottest temperature ever reliably measured on Earth
                                                                                                                     costliest disaster on record for the continent

                                                                                                                  Numbers presented throughout this document have been rounded and in some cases may not add up precisely to the totals provided.
2021 Weather, Climate and Catastrophe Insight
Opening Remarks: What Can We How This Report Can Help Build
Do Today to Plan For Tomorrow? and Promote Resilience
Over the past year, the world has counted the costs equivalent to a Category 5 hurricane, struck This report highlights 2021 global natural hazards and helps quantify and qualify how topics such as climate
of another round of major, expensive and disruptive the Philippines in December and record-setting change, socioeconomics, and other emerging issues are driving new and emerging types of risk. The data,
natural disasters. These kinds of catastrophes are heatwaves led to drought and wildfires in North statistics, and analytics are meant to aid interests in sectors such as insurance, government, academia, real
increasing in frequency and severity — impacting and South America, Europe and Asia. Significant estate, emergency management, and banking.
livelihoods, communities, and businesses across the tornadoes and hail affected Australia, Western and
globe. And many of them can be exacerbated by the Central Europe and Canada while earthquakes struck
effects of climate change. in Haiti and Japan. Identify ●
Explore global and regional catastrophe hazard and loss drivers
Trends
●
Determine which areas are seeing higher annual or decadal losses
As the world wakes up to the effects of a changing Recovery efforts and the delivery of critical
climate, what can organizations do to build for the humanitarian aid were further complicated again this ●
Detect climate change influence on individual event behavior and impacts
long-term while tackling the immediate challenges of year due to the ever-evolving COVID-19 pandemic.
a volatile world?
U.S. sees the costliest events
Unique opportunity
Promote ●
Better establish risk mitigation efforts in the public and private sectors –
with initial focus in the most vulnerable areas of the world – for enhanced
Extreme weather events, some of which were
Organizations, governments and communities are
beginning to realize that our interconnected world is
Risk disaster response and business continuity
enhanced by climate change, were particularly
notable in the United States. Hurricane Ida, which
becoming more directly — and indirectly — affected by
the environment around us.
Mitigation ●
Modernize building codes and mandate enforcement
●
Improve risk communication and explanation of uncertainty
made landfall in August, resulted in one of the highest The public and private sector now has a unique ●
Academic collaborations in climate research will aid in the development
individual losses ever recorded for public and private opportunity to discover and implement new of new tools and solutions to push forward new ideas to lower risk and
insurers ($36 billion). Ida was one of eight tropical strategies. One example of this new spirit of promote future mitigation and adaptation practices
cyclones that made landfall in the U.S. in another cooperation can be seen in the 26th United Nations
above-average Atlantic Hurricane Season.
Climate Change Conference (COP26), which
The country also saw the costliest winter weather
event ever recorded following a disruption of Polar
demonstrated how national governments, financial
institutions, emergency managers and academics
Seize the ●
Explore traditional and alternative insurance to protect people and assets
opportunities
●
Grow the volume of assets dedicated to sustainable investment to
Vortex that engulfed much of the country. A high can collaborate to advance new plans to cut carbon accelerate green initiatives that will meet net-zero emissions goals
number of severe convective storms, which included emissions and put the world on a sustainable path to
●
Develop strong ESG strategies to reduce risk and strengthen the
a December tornado outbreak and derecho, resulted minimize the effects of climate change.
organizations’ access to capital, talent and investors.
in the third-costliest year on record for the insurance
industry in the United States, record heat and drought ●
Build and enable an agile and resilient workforce able to respond to climate
conditions set the stage for wildfires which led to a The path forward and other challenges.
multi-billion-dollar annual loss. This included major The impact of climate change has numerous knock-
fire events in California and Colorado. on effects beyond the immediate damage to property
6
and infrastructure. Issues such as the global supply Build resilience through public-private collaborations
Global records
chain, healthcare, transition risk within an evolving
regulatory environment, emergency management and to close the protection gap, protecting and enriching
In other parts of the world, historic rainfall and
flooding set records for the costliest individual
climate displacement are all affected by the problems
associated with climate change. It is therefore critical
lives around the world.
natural disaster events for the insurance industries that the public and private sectors work together to
in Germany and China. Meanwhile, a typhoon, find a more equitable way to limit future risk.
Key learning: Don’t forget the non-physical risk
●
Costs of climate change extend beyond physical damage
●
Larger-scale events can amplify humanitarian aid needs
●
Investment in infrastructure or other adaptation methods can reduce long-term costs
●
Data and analytics will aid increasingly mandated climate-related regulatory disclosures
Along with this report, we welcome readers to access current and historical natural catastrophe data and event
analysis at catastropheinsight.aon.com
2021 Weather, Climate and Catastrophe Insight
2021 Natural Disaster
Events & Loss Trends
Global Economic Losses: Seventh Costliest Year on Record Direct economic losses and physical damage resulting the frequency of large-scale and highly impactful
from natural disasters were estimated at $343 billion events. Four individual events topped the $20 billion
Exhibit 1: Top 10 Global Economic Loss Events in 2021. This marked the seventh-costliest year economic loss threshold: Hurricane Ida, July Flooding
Date(s) Event Location Deaths Economic Loss Insured Loss on record after adjusting actual incurred damage in Europe (Bernd), Summer Seasonal Flooding in
(USD billion) (USD billion) to today’s dollars using the U.S. Consumer Price China and the February Polar Vortex in North America
08/27 – 09/02 Hurricane Ida U.S., Caribbean 96 75.3 36.0 Index. While not a record-breaking year – far below (U.S. / Mexico). This was just the second time on
the peak loss years seen in 2011 ($615 billion) and record in which four $20+ billion events had been
07/12 – 07/18 Flooding Western & Central Europe 227 45.6 13.0
2017 ($532 billion) – it was above the average ($271 registered in a calendar year, but the first time that
06/01 – 09/30 Seasonal Floods China 545 30.0 2.1 billion) and median ($265 billion) of the 21st Century. four events were weather / climate related. In 2004,
02/12 – 02/20 Winter Weather (Freeze) U.S., Mexico 235 25.0 15.0 When compared to the last decade (2011-2020), there were two hurricanes (Charley and Ivan) and two
01/01 – 12/31 Drought United States - 9.0 4.3 the economic losses were four percent higher than earthquakes (October 23 Japan Earthquake and the
average and 15 percent higher than the median. Note December 26 Indian Ocean Earthquake and Tsunami).
02/13 – 02/13 Fukushima Earthquake Japan 1 8.0 2.5
than median analysis helps smooth any potential data
The reasoning behind the increased frequency of
04/05 – 04/08 Winter Weather Western & Central Europe - 5.6 0.4 bias from anomalous years.
large-scale weather events in 2021 is complex. The
12/10 – 12/12 Severe Weather United States 93 5.1 4.0 The economic cost solely resulting from weather and influence of climate change is notably evident in
06/17 – 06/25 Severe Weather Western & Central Europe 7 4.9 3.5 climate-related events, which is defined as events the case of tropical cyclone and extreme rainfall /
01/01 – 12/31 Drought Brazil - 4.3 0.1 caused by atmospheric-driven phenomena, totaled temperature behavior, which aligns with scientific
$329 billion. This was the third-highest loss on record research that storms will become more intense,
All other events ~9,500 ~130 billion ~49 billion
after adjusting for inflation, only behind 2017 and individual events will bring heavier rainfall amounts,
TOTALS ~10,500 343 billion 130 billion 2005. The total was 45 percent higher than the 21st and temperatures will reach new heights (lows).
Century average and 52 percent higher than the How that translates to financial loss is slightly more
median. Weather / climate-only analysis serves as a nuanced since the most vulnerable and urbanized
Exhibit 2: Significant 2021 Economic Loss Events above $1.0 billion starting point when identifying any emerging trends areas incurred the most damage. As climate change
related to the influence of climate change on natural influenced hazard behavior grows more volatile and
hazard behavior. The most notable takeaway from severe, the expansion of population footprints will
the economic costs of natural disasters in 2021 was additionally grow the risk of costlier disasters.
Exhibit 3: Global Economic Losses
Europe Floods
$46 billion All natural disasters (2021 USD billion) Weather-related disasters (2021 USD billion)
China Floods 615
Polar Vortex Event Hurricane Ida $30 billion
$25 billion $75 billion 532
519
8
Flooding
397
Tropical Cyclone 380
Winter Weather 343
318 329
308 310
Severe Weather 297 297 291 295 295 286
270 265 260
Drought 249
242
Earthquake 216
186 194 196 191 185 177
Wildfire 164 169
Other
Data: Aon (Catastrophe Insight)
2008 2010 2012 2014 2016 2018 2020 2008 2010 2012 2014 2016 2018 2020
Data: Aon (Catastrophe Insight)
2021 Weather, Climate and Catastrophe Insight
At $105 billion, flooding was the costliest peril of 2021 on an economic loss basis. This was largely driven by the There were 50 individual billion-dollar natural disaster events in 2021, which was well above the average of 38
flooding events in Europe and China. These two events alone accounted for more than $75 billion in economic events dating to 2000. All but three were weather or climate-related events. The 50 events were lower than the
losses. The Tropical Cyclone peril came second, despite Hurricane Ida incurring at least $75 billion in damage and 55 in 2020, which was the third-highest year on record. Please note that U.S. wildfires are treated as individual
becoming the sixth costliest global tropical cyclone ever recorded. Other perils with above-median losses included events; there were three such events in 2021. The U.S. had a total of 23 billion-dollar events, the second year in
Severe Weather, Winter Weather, Wildfire and Other, the latter driven by notable volcanic eruptions. a row with at least 20 such occurrences and only the third time on record (2017, 2020, 2021). For some years
in the graphic below, tropical cyclone events in the Atlantic Basin resulted in billion-dollar losses in the U.S. and
elsewhere in the Americas. Such occurrences are only tabulated once.
Exhibit 4: Global Economic Losses by Peril
Flooding 105 71% 97%
Exhibit 6: Global Billion-Dollar Economic Loss Events
Tropical Cyclone 92 19% 111%
Severe Weather 58 81% 70% 60
58
Winter Weather 38 300% 361% 55
13 10 50
Drought 21 -35% -32% 49 49 6
45 46 5
Wildfire 13 47% 131% 7 44
39 5
16
Earthquake 12 -72% -11% 37 36 35 15
20 22 16
33 33 19
EU Windstorm 2 -56% -34% 12
5 21 18
6 6
Other 2 148% 402%
13 16 7
17 6
12 16 12
Economic Loss (2021 USD billion) Anomaly from Average Anomaly from Median 9 8
14 5
17
6
Data: Aon (Catastrophe Insight) 11 7
6 27
8 22 23
7 17 17 17 17
14
When viewing economic losses on an aggregate basis since the start of the 21 Century, Tropical Cyclone is the
st
8 10 11 10 11 12
6
costliest global peril. Like the Earthquake peril, it was largely driven by extreme loss years and single catastrophic
events, as opposed to Severe Weather losses, which are driven by an increasing frequency of events. It is worth 2007 2008 2009 2010 2011 2012 2013 2014 2015 2016 2017 2018 2019 2020 2021
noting that 41 percent of tropical cyclone losses in this century occurred within the last five years (2017-2021). Americas APAC EMEA United States
Data: Aon (Catastrophe Insight)
Exhibit 5: Cumulative Economic Losses by Peril
Economic Losses (2021 USD billion) Count of billion-dollar events Exhibit 7: 2021 Economic Losses Compared to Historical Benchmarks (2021 USD billion)
1,717 201
Tropical Cyclone 2021 Anomaly from Medians
Flooding Americas APAC EMEA United States
182
175
Earthquake 1,401 1980 - 2020 34% 10% 153% 262%
Severe Weather
10
Drought 2000 - 2020 -4% -24% 109% 230%
Winter Weather
2011 - 2020 -17% -30% 95% 87%
Wildfire
114
EU Windstorm 910
Other 724 2021 Anomaly from Averages
715 Americas APAC EMEA United States
59 1980 - 2020 -9% -10% 118% 160%
46
41 2000 - 2020 -32% -31% 92% 95%
239
198
17 2011 - 2020 -44% -46% 89% 59%
104
15 3
Data: Aon (Catastrophe Insight)
2000 2005 2010 2015 2020 2000 2005 2010 2015 2020
Data: Aon (Catastrophe Insight)
2021 Weather, Climate and Catastrophe Insight
Global Insured Losses Surpass $100B for the Fourth Time in Five Years Insured losses from natural disasters reached $130 the influence of more substantial catastrophe events
billion in 2021. This total was well above the 21st – especially by perils not previously identified as
Exhibit 8: Top 10 Global Insured Loss Events Century average ($74 billion) and median ($66 billion) expected to have a major impact on an insurance
Date(s) Event Location Deaths Economic Loss Insured Loss and 18 percent higher than in 2020. It was also the portfolio – has resulted in more claims being filed
(USD billion) (USD billion) fourth-costliest year on record for public and private and processed.
08/27 – 09/02 Hurricane Ida U.S., Caribbean 96 75.3 36.0 insurance entities; only behind 2017, 2011, and 2005. “Secondary” perils, including severe convective
02/12 – 02/20 Winter Weather (Freeze) U.S., Mexico 235 25.0 15.0 Roughly 38 percent of global economic losses were storms, wildfires, flooding, winter weather or drought,
covered by insurance, which translates to a protection are more frequently driving annual loss years. Years
07/12 – 07/18 Flooding Western & Central Europe 227 45.6 13.0
gap of 62 percent, the second lowest on record dominated by “primary” perils (tropical cyclone and
01/01 – 12/31 Drought United States - 9.0 4.3
behind 2005 (60 percent). The global protection earthquake) are occurring with less regularity, though
12/10 – 12/12 Severe Weather United States 93 5.1 4.0 gap is the difference between total economic losses it does not minimize the potential risk. Such a trend
06/17 – 06/25 Severe Weather Western & Central Europe 7 4.9 3.5 and what is covered by insurers. This remains a suggests that the terms “primary” and “secondary”
critical reference point for the insurance industry, are increasingly out of step since many of the largest
04/27 – 05/02 Severe Weather United States - 3.4 2.6
financial markets and governments as it highlights the individual “secondary” peril events in the last decade
02/13 – 02/13 Fukushima Earthquake Japan 1 8.0 2.5 vulnerability of communities and the opportunity for have approached or exceeded $10 billion for insurers.
06/01 – 09/30 Seasonal Floods China 545 30.0 2.1 new solutions. The United States, which boasts the most robust
12/30-12/31 Marshall Fire United States - 3.3 2.0 Weather- and climate-related disasters accounted insurance industry in the world, accounted for 71
All other events ~9,500 133 billion 45 billion for $127 billion, or 98 percent of natural disaster percent of the global insured losses. It was the
losses. It was another largely manageable year for the second year in a row that it topped 70 percent. The
TOTALS ~10,500 343 billion 130 billion
industry with the earthquake peril. combined U.S. insured loss in 2020 and 2021 was
$176 billion; the highest two-year total on record,
Global insured losses have steadily increased in
surpassing 2004/2005 ($174 billion).
Exhibit 9: Significant 2021 Insured Loss Events above $1.0 billion recent decades. Much of this growth can be tied to
continued improvement in expanding the number of To read more regarding available re/insurance
people with active insurance policies, especially in industry capital and the health of the overall market,
parts of the world where insurance availability has please refer to Aon’s Reinsurance Market Outlook.
only recently become more widely available. However,
Europe Floods Exhibit 10: Global Insured Losses
$13 billion
All natural disasters (2021 USD billion) Weather-related disasters (2021 USD billion)
Polar Vortex Event 170
$15 billion 168 168
Hurricane Ida
$36 billion
12
130
127
Tropical Cyclone
109 109 107 108
Severe Weather
99
Flooding 92 90
Winter Weather 81 80
72 75
Drought 71
64 66 63
Earthquake 55
53 54 52
Wildfire 48 47
43 42 43 41
Data: Aon (Catastrophe Insight)
2008 2010 2012 2014 2016 2018 2020 2008 2010 2012 2014 2016 2018 2020
Data: Aon (Catastrophe Insight)
2021 Weather, Climate and Catastrophe Insight
The costliest peril for the insurance industry in 2021 was Tropical Cyclone at $39 billion. At least $36 billion of There were at least 20 individual billion-dollar events for the insurance industry in 2021, well above the 21st
that total came from Hurricane Ida alone. Another very active year for severe weather (severe convective storms) Century average of 12 and the fourth-highest total on record behind 2020, 2018, and 2011. The U.S. accounted
saw insured losses top $30 billion. Winter Weather was a substantial 436 percent higher than average following for 14 of the 20 events. Of the 14 U.S. events, nine were related to severe convective storms. Please note that
a historic U.S. event in February. The only peril that was well below its 21st-Century median was European U.S. wildfires are treated as individual events. In the case of a tropical cyclone event resulting in billion-dollar
Windstorm. payouts in both the United States and the rest of the Americas, the event is bucketed in the region with the higher
insurance loss in the graphic below.
Exhibit 11: Global Insured Losses by Peril
Exhibit 13: Global Billion-Dollar Insured Loss Events
Tropical Cyclone 39 62% 501%
Severe Weather 37 85% 81%
29
Flooding 22 120% 144%
Winter Weather 17 436% 535% 5
Drought 6 28% 69% 21 21
20
Wildfire 5 34% 309%
4
6 17
Earthquake 3 -51% 184% 16 16
15 15
3 3
EU Windstorm 2 -49% -35% 2 3
3
11 4 11 11 11
Other 0 51% 207% 22
9
6
7
Insured Loss (2021 USD billion) Anomaly from Average Anomaly from Median 5 14 14
13 12
Data: Aon (Catastrophe Insight) 10 10 10
3 8 8
6 6 7
5
3
Aggregated costs for insurers have been largely dominated by the Tropical Cyclone and Severe Weather perils
this century. The two perils combined for more than $1 trillion, or 60 percent of the total cumulative industry 2007 2008 2009 2010 2011 2012 2013 2014 2015 2016 2017 2018 2019 2020 2021
losses, of which roughly 74 percent was incurred in the United States. The Severe Convective Storm peril has also
Americas APAC EMEA United States
increasingly separated itself as accounting for the highest number of billion-dollar events.
Data: Aon (Catastrophe Insight)
Exhibit 12: Cumulative Insured Losses by Peril Exhibit 14: 2021 Insured Losses Compared to Historical Benchmarks (2021 USD billion)
Insured Losses (2021 USD billion) Count of billion-dollar events 2021 Anomaly from Median
549 114 Americas APAC EMEA United States
Tropical Cyclone
Flooding 1980 - 2020 68% 124% 253% 389%
Earthquake 455
Severe Weather 2000 - 2020 7% 30% 171% 227%
14
Drought
2011 - 2020 -8% -23% 133% 85%
Winter Weather
Wildfire
EU Windstorm 2021 Anomaly from Average
Other Americas APAC EMEA United States
228 49
1980 - 2020 -6% 12% 200% 214%
29 2000 - 2020 -38% -31% 137% 108%
123 28
96
20 2011 - 2020 -57% -57% 117% 69%
85
80 13
65 12
9 Data: Aon (Catastrophe Insight)
2
2000 2005 2010 2015 2020 2000 2005 2010 2015 2020
Data: Aon (Catastrophe Insight)
2021 Weather, Climate and Catastrophe Insight
Better Forecasting and Preparation Leads to Continued Decline in Fatalities Natural Disasters Defined: Stable Number of Events as Costs Rise
Exhibit 15: Top 10 Human Fatality Events An event must meet at least one of the following criteria to be classified as a natural disaster in the Aon’s
Date(s) Event Location Deaths Economic Loss Catastrophe Insight Database:
(USD billion) ●
Economic Loss: $50 million
08/14 Earthquake Haiti 2,248 1.6 ●
Insured Loss: $25 million
06/01 – 10/31 Seasonal Floods India 1,282 3.1 ●
Fatalities: 10
06/26 – 06/30 Heatwave Western North America 1,029 -
●
Injured: 50
06/01 – 09/30 Seasonal Floods China 545 30.0
●
Homes and Structures Damaged or Filed Claims: 2,000
12/16 – 12/18 Typhoon Rai Philippines, Vietnam 410 1.0
Based on the noted criteria above, there were at least 401 individual natural disasters in 2021, which was near
04/03 – 04/12 Cyclone Seroja Indonesia, Timor-Leste, Australia 276 0.9
both the average (393) and median (396) since 2000. Please note that further 2021 events might be added later
02/12 – 02/20 Polar Vortex Event United States 235 25.0 due to further research and data updates. As typically anticipated given the highest frequency of SCS, flood and
07/12 – 07/18 Flooding Western & Central Europe 227 45.6 tropical cyclones, the highest number of disaster events occurred during the second (101) and third (134) quarters.
The United States recorded 96 disaster events, as per this report’s criteria, which tied with the record set in 2020.
10/25 – 11/30 Flooding India, Sri Lanka 217 2.5
02/07 – 02/08 Flooding India 205 0.2
All other events ~4,000 ~231 billion Exhibit 17: Total Natural Disaster Events
TOTALS ~10,500 343 billion
437 429 431 433 440 430
407 398 400 401
383 391 388 58 70
373 72 62
111 96 362
Approximately 10,500 people lost their lives due December left 409 people dead in the Philippines and 86 85 66 76
65 87 64 80
65
to global natural catastrophe events in 2021. More another casualty in Vietnam. 160 147 133
164
than 80 percent of the fatalities occurred in Asia- 147 151 169 128
The number of annual human casualties has shown a 144 141 146
135
159
151 157
Pacific (48 percent) and the Americas (34 percent) notable decline in recent decades. The improvements
as a significant earthquake in Haiti (2,248 deaths), 139 141
in forecasting, evacuation planning / strategies, 116 138 101
118 122 129 92 116 95
seasonal flooding in India (1,282 deaths) and a 111 98
113 95
increased public awareness and better building
prolonged heatwave in North America (1,029 deaths) 94 96
practices have all played a key role. Asia, Africa, and 56 57 52 53 59 58 51 57 61 70 79 77 84
all topped the 1,000 mark. Flooding throughout Asia
South America show the greatest improvements
was the primary driver of disaster-related fatalities 2007 2008 2009 2010 2011 2012 2013 2014 2015 2016 2017 2018 2019 2020 2021
with reduced fatalities. Please note that confirmed
during the year. Super Typhoon Rai marked the
fatalities and missing people presumed dead are Americas APAC EMEA United States
deadliest tropic cyclone of the year. Its landfall in late included in the above totals. Data: Aon (Catastrophe Insight)
16
Exhibit 16: Global Human Fatalities (thousands)
Exhibit 18: Total Natural Disaster Events by Peril
All natural disasters Weather-related disasters
2021 Events Average (2000-2020)
240 236 Severe Weather 135 143
Flooding 133 94
Tropical Cyclone 37 38
152
Winter Weather 25 26
Earthquake 24 52
71 Wildfire 19 13
51 EU Windstorm 11 8
23 25 32
20 14 12 13 18 11 20 12 Drought 10 12
10 9 10 11 8 10 11 9 11 7 6 10 8 7
Other 7 7
2008 2010 2012 2014 2016 2018 2020 2008 2010 2012 2014 2016 2018 2020
Data: Aon (Catastrophe Insight) Data: Aon (Catastrophe Insight)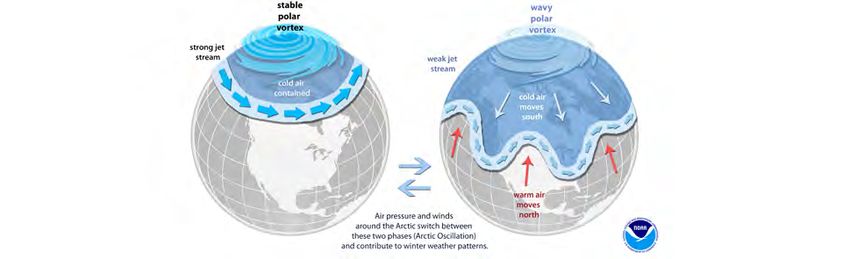
2021 Weather, Climate and Catastrophe Insight

                                                Behind the Scenes of Weather and                                                                                Challenges in Weather Forecasting                     Looking Ahead

                                                Climate Forecasting
                                                                                                                                                                One of the greatest challenges faced by NOAA          In 2022, NOAA is focused on improving fire
                                                                                                                                                                is the need to improve precipitation forecasts        weather forecasting as wildfires are influenced by
                                                                                                                                                                across timescales. As we shift from ‘day-to-day’      the weather and climate, and equally the weather
                                                Greg Carbin is Branch Chief of Forecast Operations at NOAA’s Weather Prediction Center.                         weather to longer-term climate patterns, there        and climate are influenced by wildfires. NOAA will
                                                For more than 50 years, the National Oceanic and Atmospheric Administration (NOAA) has
                                                                                                                                                                is a critical need for improved projections of how    work to improve short-term forecasts to better
                                                leveraged diverse authorities for climate, weather, fisheries, coasts, and the ocean to create
                                                huge stores of environmental data and observations.                                                             the climate will change on more granular, regional    predict fire behavior and the longer-term modeling
                                                                                                                                                                scales and over the next several decades. More        of interactions between climate variability, climate
                                                                                                                                                                accurate climate projections will work to better      change, and the likelihood of hazardous wildfire
                                                On the front line of daily weather forecasting,           for impending weather hazards. From extreme           inform regional and local adaptation and resiliency   conditions.
                                                National Oceanic and Atmospheric                          rainfall and tornadoes, to high winds and extreme     planning for infrastructure, natural resource         The ultimate goal? To provide science and service
                                                Administration’s (NOAA) National Weather                  temperatures, meteorologists remain alert to          management, food production, finance, national        in the form of actionable data and information
                                                Service Forecast Offices, and National Centers            these hazards 7-days a week, 24-hours a day,          security and other sectors.                           needed to help solve the climate crisis.
                                                for Environmental Prediction, evaluate the                and 365 days a year. This information is critical
                                                latest observational and numerical data to                to resilience-building, national security, economic
                                                disseminate outlooks, watches and warnings                vitality, and the protection of life and property.

   18
2021 Weather, Climate and Catastrophe Insight
Seasons of Change
How “normal” continues to evolve with climatological averages, and the real-world implications of these climate Decadal changes to climate normals vary by in how the jet stream behaves can and has led to
change-influenced shifts on various business practice topics geographical region, season, and timeframe. Though instances of more extreme precipitation events.
as already mentioned, some of the more recent trends However, this has also led to more rapid shifts
Climatological Normals in normals indicate an accelerated rate of change in from extreme rain / flooding to extreme drought.
the warming of average temperatures. A NOAA study There are increasing examples of areas recording
An important method of identifying changes in era climate change assessments. The one challenge of the global climate in 2020 found that combined excessive precipitation in short duration, but that
global, regional, or local weather / climate patterns using the 1961-1990 baseline for climate change is land and ocean temperatures have increased at an rainfall accounts for most of the monthly or annual
are found in what are known as “climatological that it does not account for changes to temperature average rate of 0.08°C (0.13°F) per decade since total. This pattern often means that extreme drought
normals”. Put simply, “normals” are an average that and precipitation since the start of the Industrial 1880. However, this rate of increase has more than conditions are quick to follow. Regardless, more
is computed based on 30 years of daily weather Revolution (1850 to 1900). Using the 1850-1900 doubled to 0.18°C (0.32°F) since 1981. frequent extreme rain events are occurring, and this
readings. They serve as a point of reference to the baseline provides a more robust view of how the is linked to a warmer and moister atmosphere. As a
global climate has accelerated rates of change since While extreme heat continues to set new maximum
climatology of a specific location and are used as a reminder, precipitation trends vary geographically and
carbon dioxide emissions from human activity have temperature records in recent years, it may come
benchmark against present day weather. The World seasonally.
dramatically increased. as a surprise to realize that the biggest driver in
Meteorological Organization (WMO) defines the
global warming has resulted from a significant shift Please note that relatively small absolute changes
climatological standard normal as the most recent Looking at changes between the two most recent in minimum temperatures. This means temperatures appear as large percentage changes in regions with
30-year period that is updated with the conclusion of baselines (1981-2010 and 1991-2020) provides useful are not cooling as much overnight as they did in dry baseline conditions. The Sahara region and the
every decade. guidance of how quickly the climate is evolving. It the past. This is particularly concerning during the Arabian Peninsula are two areas with the highest
The most recent WMO 30-year baseline – 1991 to helps identify areas showing climate change effects warm season, as it inhibits the ability of people and observed relative change between climate normals.
2020 – was enacted in 2021. Governmental agencies at a faster or slower pace. In many locations, the rates “stuff” to cool down overnight: putting vulnerable Exhibits 19 and 20 both show climate change impacts
are requested by the WMO to implement and use of change are notably increasing with each passing populations at a greater risk for heat-related stress that are in relatively good agreement with the long-
the current baseline to affirm consistent points of decade. This highlights the urgency of passing and illness. term climate projections released in the IPCC’s Sixth
comparison around the world. Note that for modern meaningful legislation and developing investment Assessment Report (AR6).
strategic planning to slow down climate change and The changes in precipitation normals are less obvious
historical reference periods, the WMO retains the
improve mitigation / adaptation practices. and require more discussion. Pattern adjustments
1961-1990 period as a standard reference for modern
Exhibit 19: Difference between the 1991-2020 and 1981-2010 normals of average annual temperature Exhibit 20: Difference between the 1991-2020 and 1981-2010 normals of average annual precipitation
20
Difference (%)
< -20
Difference (°C) -20 to -10
+20
Data: ERA5 / Copernicus / ECMWF. Graphic: Aon (Catastrophe Insight) Data: ERA5 / Copernicus / ECMWF. Graphic: Aon (Catastrophe Insight)Real-Time Impact of Climate Change
2021 Weather, Climate and Catastrophe Insight
Physical Risk: Building for an Evolving Climate Beyond Physical: Recognizing Transition Risk and Regulatory Requirements
The behavioral changes seen in individual weather challenge is addressing vulnerabilities in regions with The effects of climate change are much bigger than The most prominent of these organizations is the
events become more evident in individual events the least financial means. Such locations – including a singular tunnel-visioned view on physical assets. Task Force on Climate-Related Disclosures (TCFD).
(acute) and longer-term trends (chronic). The parts of Africa, Latin America, Asia, and the South The financial sector has seen some of the fastest The group helps companies gain a clearer sense of
subsequent impacts to property in both developed Pacific Islands – account for the lowest insurance growing focus on climate change in recent years what shifts in regulatory requirements, technological
and emerging countries is a point of focus across take-up and highest dependencies on international driven by an evolving global regulatory environment. advances, and consumer behavior patterns are likely
academia, governmental bodies, international aid in the world while among the highest at-risk for As the financial markets are increasingly required to come as financial markets accelerate the need
aid organizations and the private sector. It is well future climate change effects. to conduct various stress tests to ensure solvency to quantify the costs of a more climate-focused
chronicled within peer reviewed science that these The need for collaboration between public and private given the expectation of accelerating climate change- economy. TCFD has seen a significant increase in the
more intense events are directly tied to greater entities has never been greater than today. To limit related losses, the goal is to achieve stability in a number of organizations adapting to their framework.
physical risk to such assets as residential and physical risk in both developed and emerging markets, highly volatile fiscal environment – especially in the In 2018, there were 513 “supporters” of the group
commercial properties or infrastructure. However, a strategic investment is needed in identifying best face of the ongoing challenges posed by COVID-19. (287 were financial institutions). By 2021, that
when discussing physical risk within the context of practice and cost-efficient ways to improve how and These climate disclosures are an important step in number had grown 410 percent to 2,616, including
climate change, it is essential to not overlook non- where we build in the face of growing climate-related an organization’s journey in transitioning towards a 1,069 financial institutions. These companies totaled
weather natural disaster perils (earthquake, tsunami, impacts. The insurance industry has already taken greener investment portfolio. a combined market capitalization of more than $25
volcano, etc.) that also require robust planning and initial steps by investing in the testing of material Transition risk is a growing opportunity (or concern) trillion and asset representation of $194 trillion. That
focus. building performance. Some examples of companies for companies as they account for the evolving represented a 99 percent increase from 2020 alone.
How we adapt to these growing physical risks is conducting this research include the Insurance regulatory environment. A seismic change during an The geographic distribution of TCFD “supporters” is
essential to limiting damage potential and protecting Institute for Home and Business Safety (IBHS) in the investment portfolio transition can lead to notable truly global with representation from every continent
assets in the future. Even in the most developed parts United States or the Institute for Catastrophic Loss shifts in the value of assets and/or lead to higher (excluding Antarctica). This explosive growth in
of the world there remains a critical need to retrofit Reduction (ICLR) in Canada. day-to-day operational costs. As companies develop acceptance of the TCFD framework highlights the
properties that reside in known high-risk locations. Bottom Line: Most of the world’s homes, businesses, their own framework to account for these regulatory momentum felt within the financial markets as
Wealthier nations provide significant opportunities to and infrastructure were built to meet the needs for a requirements or prepare for rating agencies beginning companies seek to be forward-thinking and not suffer
create, enforce and mandate stringent building code 20th Century climate. As the effects of climate change to “score” how well an institution is handling climate from a reputational hit due to climate inaction.
requirements in addition to further growing insurance or environmental, social, and governance (ESG)
accelerate, the need to prepare for the more intense Bottom Line: Regulatory requirements mandating
take-up where gaps exist. While most focus tends topics, there are groups dedicated to developing a
events of tomorrow becomes more urgent with each climate-related disclosures are growing. European
to be on world’s wealthiest nations, the greatest forward-looking map.
passing day. markets have long been dominant for such filings, but
the United States and Asia are increasingly bringing
such mandates to the table. The trend is here to stay.
Exhibit 21: Fossil fuel emissions and population by income group
Fossil Fuel Emissions per capita (tons) Total Fossil Fuel Emissions (gigatons) Population (billion)
16 20 4
Exhibit 22: Continued Growth in Support for the TCFD
24 Number of TCFD Supporters Total Assets (Financial Institutions) Combined Market Capitalization (all)
12 15 3 2,616
Financial Insitutions $194 tn $25 tn
Other Supporters
8 10 2 $150 tn
1,069
1,512 $118 tn
4 5 1
$100 tn $13 tn
700
1,547 $9 tn
785 $8 tn
1960 1980 2000 2020 1960 1980 2000 2020 1960 1980 2000 2020
513 374 812
High Income Upper Middle Income Lower Middle Income Low Income 287
411
Data: World Bank / Global Carbon Project / Aon. Graphic: Aon (Catastrophe Insight)
2017 2018 2019 2020 2021 2022 2017 2018 2019 2020 2021 2022 2017 2018 2019 2020 2021 2022
Data: Task Force on Climate-related Financial Disclosures: 2021 Status Report. Graphic: Aon (Catastophe Insight)2021 Weather, Climate and Catastrophe Insight
Climate Impact on Health Supply Chain: Managing Connected Extremes
The effects of climate change pose a significant threat A clearer implication to health risk surrounds the An emerging topic in the discussion of climate One important variable previously mentioned for
to personal health, health care and subsequent worker direct and indirect impacts from individual events. change is the concept of compounded or connected supply chain and/or commercial risk is on the
productivity than can have downstream effects on Examples include heat stress (cardiovascular stress extremes. Much has been written on the concerns individual worker. This is especially true for industries
global supply chains. While these impacts may seem to humans with prolonged outdoor exposure) and around multiple large-scale disasters happening heavily based on agriculture or construction. These
less obvious than the physical damage seen in the wildfires (smoke can notably decrease air quality concurrently that puts major strain on governmental professions heavily rely on a workforce that works
aftermath of an individual disaster event, the effects thousands of miles (kilometers) away from the fire agencies, emergency managers, and the insurance outdoors. A 2019 study by the International Labor
are growing and are often felt most by populations location). The impact to mental health following a industry in responding to these events in real-time. Office noted that further global warming will lead to
that face the greatest vulnerabilities. Peer reviewed large-scale disaster is the most underappreciated and What has become more prevalent are the secondary a 2 percent global reduction in total working hours
academic research shows that the people whose long-lasting concern. or tertiary effects seen across the commercial sector. by 2030 because of lost work or reduced rate of
health is being harmed the most (and first) are those work. In parts of Southern Asia or Western Africa,
Organizations can address these concerns by The most obvious effects to the commercial sector
who contribute the least to carbon emissions and that productivity reduction could reach 5 percent.
instituting leader and manager training on ways to due to climate change come via the global supply
subsequent atmospheric and oceanic warming. This Heat stress will be a major challenge in less affluent
support employees in the wake of such large-scale chain. Many of these effects have already been
means people in low-income countries – especially in countries where more vulnerable populations handle
disasters. Providing resources to help employees and observed and are likely to occur with increased
Africa, Latin America, Asia, and the Middle East - are more dangerous jobs. The UN cites that accumulated
their families who are suffering from stress, anxiety frequency if strategic planning is not done to
more likely to be affected in the future. direct and indirect losses due to heat stress could
and depression - such as an Employee Assistance limit disruptions in the future. There are multiple
reach $2.4 trillion by 2030 if nothing is done to
Quantifying the direct consequences of climate Plan - can help address a variety of challenges components to how supply chain can be disrupted by
mitigate climate change risk.
change on human health is challenging, and there exacerbated by climate change. climate change:
are new signs of how the broader implications of Bottom Line: As large-scale disasters happen with
Bottom Line: The most vulnerable populations from 1. More intense events damage critical infrastructure
climate change can be attributed to many diseases, more regularity, the downstream effects on the
climate change are typically in areas with the least to minimize shipping avenues;
even death. The disruption of food systems, the commercial sector is only going to become more
means to prepare or protect against the growing 2. Direct damage to manufacturing facilities or
spread of food, vector, and water-borne diseases, the noticeable. Recent years in 2021, 2020, 2017, and
effects posed to human health. The good news is equipment;
degradation of social conditions, effects on mental 2011 highlighted the types of prolonged supply
that fatalities from individual weather disasters has
health, and influence from air pollution are all risks 3. Reduction in employee productivity; chain and economic disruptions that can occur. As
declined in recent years. But there remains a moral
with legitimate health repercussions. A 2021 World more expensive and impactful disaster events occur
obligation to ensure a more equitable way of investing 4. Increased market prices for labor, energy, and
Health Organization analysis cited that 12.7 percent in quick succession, this type of complex risk on
and limiting risk by the wealthiest and highest logistics (such as transport).
of the world’s population (940 million people) spends commercial business has the potential to become the
emitting nations of the world.
at least 10 percent of their household budget on new normal.
healthcare. These costs are projected to grow.
Exhibit 24: Components of Supply Chain Disruption
Exhibit 23: Projected Number of days per year with deadly climatic conditions in 2091-2100 under RCP4.5 Scenario
26
Critical Infrastructure Manufacturing
Damage Facility Disruption
Components
of Supply
Number of Days
50 - 99
100 - 149
Chain Disruption
150 - 199
200 - 249
250 - 299
300+
Data: Mora et al. Global risk of deadly heat. Nature Climate Change 7, 501-507 (2017); ESRI's Applications Prototype Lab. Graphic: Aon (Catastrophe Insight)
Employee Increased
Productivity Market Costs2021 Weather, Climate and Catastrophe Insight
Building a resilient and sustainable supply As companies deal with physical changes and a
transition to a more sustainable business, they
chain in the face of climate change need to align the impacts of climate change to
balance sheet solutions that can reduce volatility.
Richard Waterer, Aon’s Global Risk Consulting Leader Climate change requires a forward-looking
approach and the assessment of the ‘more
intangible’ transition risks.
“
Interruptions to supply chains are regular and The need for innovation
costly occurrences – demonstrated with the
Supply chains were already fragile as companies
blocking of the Suez Canal, the Texas cold snap Organizations should think about climate
sought to drive efficiencies and margins through
and a drought in Taiwan. Against the backdrop change on two fronts, one is managing
sourcing of materials, ingredients and components
of a pandemic, such events are estimated to the balance sheet impacts. The other
as well as the distribution of their end products.
have created supply chain challenges, costs and is developing the organization’s stance
Liquidity strategies based on the use of reduced
losses for over two thirds of the global business on climate change and deciding how to
inventories and ‘just-in-time’ (JIT) fulfilment
community. report that to stakeholders. Though even
processes have increased exposure to disruption.
with the same fundamentals, climate
Coupled with the risk of disruption caused by Though effective at reducing flow times and
risk approaches will differ depending on
catastrophes and the evolving climate, it has never costs within production and distribution systems,
company and industry dynamics.
been harder to balance the need for flexible, cost- these inventory and manufacturing workflows are
effective supply chains. susceptible to supply and demand shocks. When Corey Green, Head of Strategy & Execution,
global supply chains are disrupted – as we’ve Global Risk Consulting
seen with the pandemic, the Suez blockage and
Aon’s Chief Broking Officer community unpredictable weather events as recent examples 5 ways to strengthen your supply chain resilience
rated Supply Chain Risk and Climate – JIT production can fail. Leaving companies to
Change as the two biggest challenges from
●
Assess and align your macro exposures to
pay fines for missing deadlines, empty shelves for
a risk transfer perspective. specific industry sector events including extreme
consumers and extensive delays for components
weather conditions, environmental and climate
Source: Aon’s Global Risk Management of larger products (chips for electronic goods, as
forecasting as well as political unrest to protect
Survey (GRMS) another recent example) – all of which can have
the assets from sea-level rises, wildfires,
serious repercussions on a retailer’s reputation,
earthquakes etc.
As climate change makes extreme weather more cash flow and revenue.
●
Identify and mitigate a range of reputational
frequent and severe, it raises the probability of Simultaneously, climate change is evolving
issues culminating from supply chains including
events that are more intense than manufacturing so quickly that quantifying risk is increasingly
diversity and inclusion, modern slavery, child or
facilities are constructed to withstand. Companies important and insuring risk is increasingly more
28 forced labour and human trafficking.
and consumers alike are already seeing the impact difficult. Companies are hard-pressed to remain
of climate change on production costs, reduced agile in today’s increasingly volatile landscape but ●
Where there is a concentration of exposure,
delivery times and the quality of goods delivered to need to understand both the current and possible consider de-risking the supply chain by re-
the end user. future risk exposure, including the influence of engineering where possible, managing risk and
our changing climate. Beyond limiting loss and assessing the role of contracts and agreements,
disruption, visibility into risk exposures has far- as a tool for risk management.
Expected losses from supply chain reaching implications on a company’s growth. ●
Explore how you can improve existing supply
disruptions equal 42 percent of one year’s Board Members must be seen as aware of risk chain processes and procurement operations
EBITDA (earnings before interest, taxes, exposures and how they’re being handling in with insurance, risk management and finance
depreciation and amortization) on average answering to shareholders and conducting due teams
over the course of a decade. diligence around M&A deals. With a data-driven
●
Discover how you can match insurer capital
Source: S&P and Capital IQ; McKinsey approach to understanding its position, a company
to current and emerging exposures through
Global Institute analysis is better equipped to proactively mitigate risk and
improved risk insights across key suppliers and
optimize its risk financing strategy.
third-parties. This could include captive insurance
companies or index-linked, parametric solutions.2021 Weather, Climate and Catastrophe Insight
Elevating Risk Management to Enhance Disaster Responses Climate Displacement
Among the most important aspects of climate change As risk managers grapple with the complexities of The humanitarian risks posed by climate change are practices are forced to share diminishing resources
is how to effectively prepare and/or respond to the future climate risk and how to prepare for future consequential and require a detailed view through and enflame tensions in areas that have a dearth of
societal challenges posed by the various physical response, there are some basic categories to follow: a moral and/or ethical lens. One of the areas of strong governance. The lack of structured and well-
and non-physical risks. Such challenges require 1. Mitigation: Identify best practice ways to growing concern surrounds climate displacement. functioning governance increases the difficulty to
comprehensive assessments via risk management, reduce the volume of carbon emissions and This represents people who are forced from their adapt or make the critical social, structural,
including disaster relief and emergency management, stabilize greenhouse gases which trap heat in homes due to an individual weather or climate- or economic changes needed to improve
to respond to the more impactful events of tomorrow. the atmosphere. related disaster, or the compounded effects of humanitarian sustainability. When combined with
Complicating preparation efforts is that the likely climate change that can enhance issues such as accelerated temperature warmth and intensifying
effects of climate change will be different for every 2. Adaptation: Plan for future life in a changing food insecurity. droughts, this can amplify environmental degradation.
peril and region. This reality means there will be a climate environment by investing to minimize While there is no direct correlation between climate
human and physical vulnerabilities, such as Food insecurity is a real and growing challenge,
greater need for more detailed planning will down to a change and regional conflict, there is little doubt
investing in infrastructure projects, building especially in countries or regions most vulnerable
localized level. that the indirect effects are leading to increasing
more storm-resistant structures, improving to the effects of climate change. Poor agricultural
Before discussing what can be done to lower climate practices or changing land use has accelerated food geopolitical concerns.
risk communication, or shifting human
change-related risks, we must define the differences lifestyle behaviors. scarcity in many parts of the underdeveloped world. A A 2019 study by the University of Notre Dame’s Global
between disaster relief and emergency management. 2020 United Nations study indicated that one-third of Adaptation Index (ND-GAIN) project found that 60
Emergency Management involves the identification of 3. Education: Expand the basic knowledge of the world’s cropland had been abandoned in the past percent of the top 20 counties most at-risk to
a smaller-scale event and determining which specific the climate system and recognize that there 40 years due to erosion. The agency further cited climate change were in countries at high risk
group(s) will handle various short-term aspects of is still time to make a meaningful impact to that another 20 million hectares (49 million acres) of of armed conflict. The factors used to measure
shelter, clean-up, or any request for local or state- reverse anthropogenic-driven damage to the agricultural land every year becomes too poor for crop climate risk include: Food, Water Access, Health,
level financial assistance. Disaster Relief involves a earth’s environment. production or lost due to urban sprawl. A separate Ecosystem Services, Human Habitat, Infrastructure,
much larger-scale incident that requires substantial Bottom Line: The underlying challenge is that there 2020 UN study noted that more than 50 percent Economic Readiness, Governance Readiness, and
coordination between various federal agencies needs to be a fundamental change in how risk of the world’s population was likely to be living in a Social Readiness.
and humanitarian groups for short and long-term management professionals prepare for the disasters “water-stressed region” by 2050. These issues can
Bottom Line: As increasingly vulnerable populations in
assistance around housing, food, medical, and of today and tomorrow. The need for increased quickly compound and lead to serious instances of
lower income countries are faced with food insecurity
financial aid. funding and planning from the federal level down to acute malnutrition – especially in children.
or a limited number of employment opportunities,
the local level is obvious, but how these agencies Places facing the highest risk of food insecurity this will lead to these residents leaving their homes
work together to address the problem and ensure a are also the ones dealing with the greatest wealth to find a new place to live. Ensuring safe access
level playing field for all communities, rich and poor, inequalities and threats of regional conflict. As people to food, medical aid, and shelter is essential in
is the most urgent first step. It can and will literally move due to a lack of food availability, this can often underdeveloped nations.
save lives. result in rising conflict as farmers or other agricultural
30 Exhibit 25: Emergency Management and Disaster Relief
Exhibit 26: Notre Dame Global Adaptation Index
Overall Preparedness Ranking Vulnerability and Readiness
↑ Higher Vulnerability
Emergency Disaster Income Group
Increasing
Upper
Management (EM) Relief (DR) Upper middle
Norway (76.8) Niger
Funding,
Lower middle
●
Smaller scale events ●
Large scale events
Low
Short-term shelter & clean-
Planning, and Long-term assistance for
● ● Central African R.
up response shelter, food, medical aid,
●
Fewer number of Coordination financial aid Chad (28.3)
Down to the
Singapore
organizations involved in ●
Substantial coordination
local or state-level financial between local, state,
assistance Local Level and federal agencies & Norway
humanitarian groups Higher Readiness →
Data: University of Notre Dame (ND-GAIN). Graphic: Aon (Catastrophe Insight)You can also read