2022 USC Norris Cancer Hospital Community Health Needs Assessment
←
→
Page content transcription
If your browser does not render page correctly, please read the page content below

USC Norris Cancer Hospital
Community Health Needs Assessment
              2022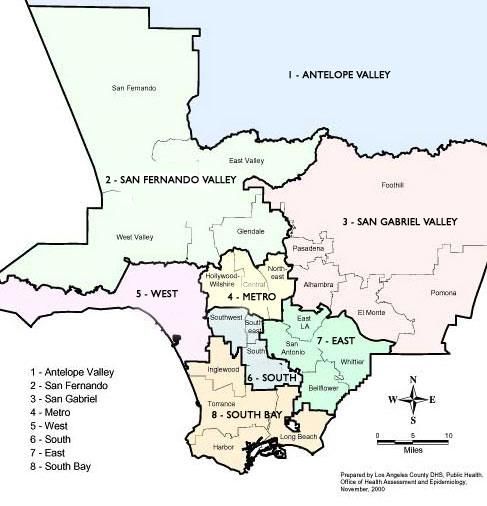
Contents
 Executive Summary ........................................................................................................ 5
 Introduction ..................................................................................................................... 8
    Background and Purpose ............................................................................................ 8
    Service Area ................................................................................................................ 8
    Project Oversight ......................................................................................................... 9
    Consultants................................................................................................................ 10
    CHNA Approval ......................................................................................................... 10
 Data Collection Methodology ........................................................................................ 11
    Secondary Data Collection ........................................................................................ 11
    Significant Community Needs .................................................................................... 11
    Primary Data Collection ............................................................................................. 11
    Public Comment ........................................................................................................ 12
 Prioritization of Significant Needs .................................................................................. 13
    Resources to Address Significant Needs................................................................... 14
    Review of Progress.................................................................................................... 14
 Demographic Profile ...................................................................................................... 15
    Population .................................................................................................................. 15
    Race/Ethnicity ............................................................................................................ 15
    Citizenship ................................................................................................................. 15
    Language ................................................................................................................... 16
    Limited English-Speaking Households ...................................................................... 16
    Family Size ................................................................................................................ 16
    Veteran Status ........................................................................................................... 17
 Social Determinants of Health ....................................................................................... 18
    Social and Economic Factors Ranking ...................................................................... 18
    Poverty ...................................................................................................................... 18
    Seniors Living Alone .................................................................................................. 19
    People with a Disability Living in Poverty................................................................... 19
    Public Program Participation ..................................................................................... 19
    Free and Reduced-Price Meals ................................................................................. 19
    Unemployment........................................................................................................... 20

USC Norris Cancer Hospital 2022 Community Health Needs Assessment                                                                       1
Median Household Income ........................................................................................ 20
Community Input – Economic Insecurity.................................................................... 20
Food Environment Index............................................................................................ 21
Food Insecurity .......................................................................................................... 21
Community Input – Food Insecurity ........................................................................... 21
Housing Units ............................................................................................................ 22
Housing Affordability .................................................................................................. 22
Housing Supply.......................................................................................................... 23
Homelessness ........................................................................................................... 23
Community Input – Housing and Homelessness ....................................................... 24
Education ................................................................................................................... 25
Transportation............................................................................................................ 25
Parks, Playgrounds and Open Spaces ...................................................................... 26
Crime and Violence ................................................................................................... 26
Substantiated Child Maltreatment Cases................................................................... 27
Community Input – Violence and Injury ..................................................................... 27
Air Quality .................................................................................................................. 27
Access to Health Care................................................................................................... 29
Health Insurance Coverage ....................................................................................... 29
Sources of Care ......................................................................................................... 30
Difficulties Accessing Care ........................................................................................ 31
Lack of Care Due to Cost .......................................................................................... 32
Delayed Care ............................................................................................................. 32
Dental Care ............................................................................................................... 32
Community Input – Access to Care ........................................................................... 33
Leading Causes of Death .............................................................................................. 34
Mortality Rates ........................................................................................................... 34
Leading Causes of Death .......................................................................................... 34
Heart Disease and Stroke .......................................................................................... 35
Cancer ....................................................................................................................... 35
Leading Causes of Cancer Death .............................................................................. 39
Chronic Lower Respiratory Disease .......................................................................... 39
Alzheimer’s Disease .................................................................................................. 39
USC Norris Cancer Hospital 2022 Community Health Needs Assessment 2Diabetes .................................................................................................................... 39
Unintentional Injury .................................................................................................... 40
Pneumonia and Influenza .......................................................................................... 40
Liver Disease ............................................................................................................. 40
Kidney Disease .......................................................................................................... 40
Suicide ....................................................................................................................... 41
Homicide.................................................................................................................... 41
HIV............................................................................................................................. 41
Drug Overdoses......................................................................................................... 41
Disease and Disability ................................................................................................... 43
Health Status ............................................................................................................. 43
Cancer Incidence ....................................................................................................... 43
Community Input – Cancer ........................................................................................ 44
Diabetes .................................................................................................................... 45
Heart Disease ............................................................................................................ 46
High Blood Pressure .................................................................................................. 46
Asthma ...................................................................................................................... 47
Tuberculosis .............................................................................................................. 47
HIV/AIDS ................................................................................................................... 48
Sexually Transmitted Infections ................................................................................. 48
Community Input – Sexually Transmitted Infections and HIV/AIDS ........................... 48
Disability .................................................................................................................... 49
Community Input – Chronic Disease ......................................................................... 49
COVID-19...................................................................................................................... 51
Community Input – COVID-19 ................................................................................... 52
Health Behaviors ........................................................................................................... 53
Overweight and Obesity ............................................................................................ 53
Sedentary Children .................................................................................................... 54
Adequate Fruit and Vegetable Consumption ............................................................. 54
Community Input – Overweight and Obesity ............................................................. 55
Mental Health ................................................................................................................ 57
Mental Health Indicators ............................................................................................ 57
Community Input – Mental Health.............................................................................. 58
USC Norris Cancer Hospital 2022 Community Health Needs Assessment 3Substance Use and Misuse........................................................................................... 60
Cigarette Smoking ..................................................................................................... 60
Opioid Use ................................................................................................................. 60
Alcohol Use ............................................................................................................... 60
Community Input – Substance Use ........................................................................... 61
Preventive Practices...................................................................................................... 62
Flu and Pneumonia Vaccines .................................................................................... 62
Immunization of Children ........................................................................................... 62
Mammograms and Pap Smears ................................................................................ 62
Human Papillomavirus (HPV) Vaccination ................................................................. 63
Community Input – Preventive Practices ................................................................... 63
Attachment 1: Local Community Snapshot ................................................................... 64
Attachment 2: Community Stakeholder Interviewees .................................................... 67
Attachment 3: Community Stakeholder Interview Responses ....................................... 68
Attachment 4: Resources to Address Community Needs .............................................. 73
Attachment 5: Report of Progress ................................................................................. 77
USC Norris Cancer Hospital 2022 Community Health Needs Assessment 4Executive Summary Keck Medicine of USC, the University of Southern California’s medical enterprise, operates USC Norris Cancer Hospital. USC Norris Cancer Hospital has been at the forefront of the fight against cancer for more than 40 years. The 60-bed hospital is one of the eight original comprehensive cancer centers designated by the National Cancer Institute and has a mission to translate scientific discoveries into innovative therapies for its patients. As a member of the USC family, it is a teaching hospital, training residents and fellows in graduate medical education. Community Health Needs Assessment USC Norris Cancer Hospital (USC Norris) has undertaken a Community Health Needs Assessment (CHNA). California Senate Bill 697 and the Patient Protection and Affordable Care Act through IRS section 501(r)(3) regulations direct nonprofit hospitals to conduct a CHNA every three years and develop a three-year Implementation Strategy Plan that responds to community needs. This CHNA was conducted in partnership with Keck Hospital of USC. Service Area USC Norris is located east of downtown Los Angeles on the USC Health Sciences Campus at 1441 Eastlake Avenue, Los Angeles, California 90033. The hospital is located in the Boyle Heights neighborhood of Los Angeles in LA County Service Planning Area (SPA) 4. The hospital draws primarily adult patients regionally from Southern California, with a primary service area of Los Angeles County, California. Methodology Secondary Data Secondary data were collected from a variety of county and state sources to present community demographics, social determinants of health, access to health care, leading causes of death, disease and disability, COVID-19, health behaviors, mental health, substance use and preventive practices. These data are presented in the context of Los Angeles County and California. Analysis of secondary data includes an examination and reporting of health disparities for some health indicators. The report includes benchmark comparison data that measure the data findings as compared to Healthy People 2030 objectives, where appropriate. Healthy People objectives are a national initiative to improve the public’s health by providing measurable objectives that are applicable at national, state, and local levels. USC Norris Cancer Hospital 2022 Community Health Needs Assessment 5
Primary Data
 Thirteen (13) phone interviews were conducted during January 2022 and February
 2022. Community stakeholders identified by the hospital were contacted and asked to
 participate in the needs assessment interviews. Interview participants included a broad
 range of stakeholders concerned with health and wellbeing in Los Angeles County, who
 spoke to issues and needs in the communities served by the hospital.

 Significant Community Needs
 Significant needs were identified through a review of the secondary health data and
 validation through stakeholder interviews. The identified significant needs included:
     • Access to health care
     • Cancer (screening, early detection, and treatment)
     • Chronic diseases
     • COVID-19
     • Economic insecurity
     • Food insecurity
     • Housing and homelessness
     • Mental health
     • Overweight and obesity
     • Preventive practices
     • Sexually transmitted infections and HIV/AIDS
     • Substance use
     • Violence and injury

 COVID-19
 COVID-19 continues to have an unprecedented impact on the health and well-being of
 the community. This CHNA identified an increase in economic insecurity, food
 insecurity, housing and homelessness, mental health conditions and substance use as
 a direct or indirect result of the pandemic. Additionally, access to routine care,
 preventive screenings, disease maintenance, healthy eating and physical activity
 declined. Community stakeholder comments on the effect of COVID in the community
 are included in the CHNA.

 Prioritization of Health Needs
 The identified significant community needs were prioritized with input from the
 community. Interviews with community stakeholders were used to gather input on the
 significant needs. Access to care, mental health, cancer, overweight and obesity and
 COVID-19 were ranked as the top five priority needs in the service area.

 Report Adoption, Availability and Comments
 This CHNA report was adopted by the Keck Medical Center of USC Board of Directors

USC Norris Cancer Hospital 2022 Community Health Needs Assessment                          6
on April 28, 2022. This report is widely available to the public on the hospital’s web site, https://www.keckmedicine.org/community-benefit/. Written comments on this report can be submitted to BenefitandOutreach@med.usc.edu. USC Norris Cancer Hospital 2022 Community Health Needs Assessment 7
Introduction

 Background and Purpose
 Keck Medicine of USC is the University of Southern California’s medical enterprise.
 Encompassing academic excellence, world-class research and state-of-the-art clinical
 care, we attract internationally renowned experts who teach and practice at the Keck
 School of Medicine of USC, the region’s first medical school.

 We operate the Keck Medical Center of USC, which includes two acute care hospitals:
 Keck Hospital of USC and USC Norris Cancer Hospital. The enterprise also owns the
 community hospital USC Verdugo Hills Hospital, and it includes more than 40 outpatient
 facilities, some at affiliated hospitals, in Los Angeles, Orange, Kern, Tulare and Ventura
 counties. In addition, we operate USC Care Medical Group, a medical faculty practice.

 USC Norris has been at the forefront of the fight against cancer for more than 40 years.
 The 60-bed hospital is one of the eight original comprehensive cancer centers
 designated by the National Cancer Institute and has a mission to translate scientific
 discoveries into innovative therapies for its patients.

 USC Norris focuses on 13 key areas of cancer treatment: breast cancer, gastrointestinal
 cancer, genetic counseling, gynecological cancers, health and neck cancers,
 hematology, lung cancer, melanoma, neuro-oncology, radiation oncology, sarcoma, skin
 cancer and urologic oncology. As an integral part of a university-based medical center,
 USC Norris offers access to hundreds of innovative clinical trials and extensive patient
 education, empowering patients to take an active role in their health care.

 The passage of the Patient Protection and Affordable Care Act (2010) requires tax-
 exempt hospitals to conduct Community Health Needs Assessments (CHNA) every
 three years and adopt an Implementation Strategy to meet the priority health needs
 identified through the assessment. A CHNA identifies unmet health needs in the service
 area, provides information to select priorities for action and target geographical areas,
 and serves as the basis for community benefit programs. This assessment incorporates
 components of primary data collection and secondary data analysis that focus on the
 health and social needs of the service area.

 Service Area
 USC Norris is located east of downtown Los Angeles on the USC Health Sciences
 Campus at 1441 Eastlake Avenue, Los Angeles, California 90033. Norris is located in
 the Boyle Heights neighborhood of Los Angeles in LA County Service Planning Area
 (SPA) 4. The hospital draws primarily adult patients regionally from Southern California,

USC Norris Cancer Hospital 2022 Community Health Needs Assessment                             8
with a primary service area of Los Angeles County, California. Attachment 1 presents
 ZIP Code level data specific to the community surrounding the hospital campus

                Map of Los Angeles County by Service Planning Areas 1-8

 Project Oversight
 The Community Health Needs Assessment process was overseen by:
 Paul Craig
 Chief Administrative Officer
 Keck Medicine of USC

 Lusine Davtyan, MHA
 Project Manager
 Community Benefit & Outreach
 Keck Medicine of USC

USC Norris Cancer Hospital 2022 Community Health Needs Assessment                       9
Consultants Biel Consulting, Inc. conducted the CHNA. Dr. Melissa Biel was joined by Melissa A. King, PhD, MPA and JuHyun Y. Šakota, MPA of People’s Health Solutions to complete the data collection. Biel Consulting, Inc. is an independent consulting firm that works with hospitals, clinics and community-based nonprofit organizations. Biel Consulting, Inc. has over 25 years of experience conducting CHNAs and working with hospitals on developing, implementing, and evaluating community benefit programs. www.bielconsulting.com + www.peopleshealthsolutions.com CHNA Approval This CHNA report was adopted by the Keck Medical Center of USC Board of Directors on April 28, 2022. USC Norris Cancer Hospital 2022 Community Health Needs Assessment 10
Data Collection Methodology

 Secondary Data Collection
 Secondary data were collected from a variety of county and state sources to present
 community demographics, social determinants of health, access to health care, leading
 causes of death, disease and disability, COVID-19, health behaviors, mental health,
 substance use and preventive practices. These data are presented in the context of Los
 Angeles County and California.

 Secondary data for the service area were collected and documented in data tables with
 narrative explanation. The data tables present the data indicator, the geographic area
 represented, the data measurement (e.g., rate, number, or percent), and state
 comparisons, the data source, data year and an electronic link to the data source.

 Analysis of secondary data includes an examination and reporting of health disparities
 for some health indicators. The report includes benchmark comparison data that
 measure the data findings as compared to Healthy People 2030 objectives, where
 appropriate. Healthy People objectives are a national initiative to improve the public’s
 health by providing measurable objectives that are applicable at national, state, and
 county levels.

 Significant Community Needs
 Initially, significant health needs were identified through a review of the secondary
 health data collected. The identified significant needs included:
      • Access to health care
      • Cancer (screening, early detection, and treatment)
      • Chronic diseases
      • COVID-19
      • Economic insecurity
      • Food insecurity
      • Housing and homelessness
      • Mental health
      • Overweight and obesity
      • Preventive practices
      • Sexually transmitted infections and HIV/AIDS
      • Substance use
      • Violence and injury

 Primary Data Collection
 USC Norris conducted interviews with community stakeholders to obtain input on

USC Norris Cancer Hospital 2022 Community Health Needs Assessment                           11
significant community needs, barriers to care and resources available to address the identified health needs. Thirteen (13) phone interviews were conducted during January and February 2022. Community stakeholders identified by the hospital were contacted and asked to participate in the needs assessment interviews. Interview participants included a broad range of stakeholders concerned with health and wellbeing in Los Angeles County, who spoke to issues and needs in the communities served by the hospital. The identified stakeholders were invited by email to participate in the phone interview. Appointments for the interviews were made on dates and times convenient to the stakeholders. At the beginning of each interview, the purpose of the interview in the context of the assessment was explained, the stakeholders were assured their responses would remain confidential, and consent to proceed was given. During the interviews, participants were asked to share their perspectives on the issues, challenges and barriers relative to the identified health needs (i.e.; what makes each health need a significant issue in the community? What are the challenges people face in addressing these needs?), along with identifying known resources to address these health needs, such as services, programs and/or community efforts. Attachment 2 lists the stakeholder interview respondents, their titles and organizations. Attachment 3 provides stakeholder responses to the interview overview questions. Public Comment In compliance with IRS regulations 501(r) for charitable hospitals, a hospital CHNA and Implementation Strategy are to be made widely available to the public and public comment is to be solicited. The previous CHNA and Implementation Strategy were made widely available to the public on the website and can be accessed at https://www.keckmedicine.org/community-benefit/. To date, no comments have been received. USC Norris Cancer Hospital 2022 Community Health Needs Assessment 12
Prioritization of Significant Needs

 The identified significant community needs were prioritized with input from the
 community. Interviews with community stakeholders were used to gather input on the
 significant needs. The following criteria were used to prioritize the significant needs:
    • The perceived severity of a health or community issue as it affects the health and
         lives of those in the community.
    • Improving or worsening of an issue in the community.
    • Availability of resources to address the need.
    • The level of importance the hospital should place on addressing the issue.

 Each of the stakeholder interviewees was sent a link to an electronic survey (Survey
 Monkey) in advance of the interview. The stakeholders were asked to rank each
 identified need. The percentage of responses were noted as those that identified the
 need as having severe or very severe impact on the community, had worsened over
 time, and had a shortage or absence of resources available in the community. Not all
 survey respondents answered every question, therefore, the response percentages
 were calculated based on respondents only and not on the entire sample size. COVID-
 19, economic insecurity and mental health had the highest scores for severe and very
 severe impact on the community. Mental health, housing and homelessness, substance
 use and violence and injury were the top needs that had worsened over time. Housing
 and homelessness, violence and injury, access to care, economic insecurity and mental
 health had the highest scores for insufficient resources available to address the need.

                              Severe and Very
                                                                      Insufficient or Absent
   Significant Health Needs   Severe Impact on   Worsened Over Time
                                                                            Resources
                               the Community
  Access to care                     90%               33.3%                  77.8%
  Cancer                             70%                 0%                   37.5%
  Chronic diseases                   80%               12.5%                  62.5%
  COVID-19                          100%               22.2%                  55.6%
  Economic insecurity               100%               66.7%                  77.8%
  Food insecurity                    90%                50%                    75%
  Housing and homelessness           90%               77.8%                  88.9%
  Mental health                     100%               88.9%                  77.8%
  Overweight and obesity             70%                50%                   62.5%
  Preventive practices               50%                 0%                   22.2%
  Sexually transmitted
                                    30%                12.5%                  25%
  infections
  Substance use                     90%                 75%                    75%
  Violence and injury              88.9%                75%                   87.5%

USC Norris Cancer Hospital 2022 Community Health Needs Assessment                              13
The interviewees were also asked to prioritize the health needs according to highest
level of importance in the community. The total score for each significant need (possible
score of 4) was divided by the total number of responses for which data were provided,
resulting in an overall score for each significant need. Access to care, mental health,
cancer, overweight and obesity and COVID-19 were ranked as the top five priority
needs in the service area. Calculations resulted in the following prioritization of the
significant needs:
Priority Ranking
Significant Needs
(Total Possible Score of 4)
Access to care 4.00
Mental health 4.00
Cancer 3.90
Overweight and obesity 3.90
COVID-19 3.80
Chronic diseases 3.70
Preventive practices 3.70
Substance use 3.70
Sexually transmitted infections 3.50
Violence and injury 3.40
Economic insecurity 3.22
Food insecurity 3.10
Housing and homelessness 3.10
Community input on these health needs is detailed throughout the CHNA report.
Resources to Address Significant Needs
Community stakeholders identified community resources potentially available to
address the significant community needs. The identified community resources are
presented in Attachment 4.
Review of Progress
In 2019, USC Norris conducted the previous CHNA. Significant needs were identified
from issues supported by primary and secondary data sources gathered for the CHNA.
The hospital’s Implementation Strategy associated with the 2019 CHNA addressed
cancer care and treatment, overweight and obesity, and preventive practices through a
commitment of community benefit programs and resources. The impact of the actions
that the hospital used to address these significant needs can be found in Attachment 5.
USC Norris Cancer Hospital 2022 Community Health Needs Assessment 14Demographic Profile
Population
The population of Los Angeles County is 10,087,570. Children and youth, ages 0-17,
make up 22% of the population, 39.5% of the population are 18-44 years of age, 25.3%
are ages 45-64, and 13.3% of the population are ages 65 and older. The county has a
higher percentage of adults, ages 18-44, (39.5%) than found in the state (38.1%).
Population, by Age
Los Angeles County California
Number Percent Number Percent
Age 0-4 611,485 6.1% 2,451,528 6.2%
Age 5-17 1,603,275 15.9% 6,570,618 16.7%
Age 18-44 3,982,975 39.5% 14,963,559 38.1%
Age 45-64 2,547,857 25.3% 9,811,751 25.0%
Age 65+ 1,335,978 13.3% 5,486,041 14.0%
Source: U.S. Census Bureau, American Community Survey, 2015-2019, DP05. https://data.census.gov
Race/Ethnicity
In LA County, 48.5% of the population is Hispanic or Latino. Whites make up 26.2% of
the population. Asians comprise 14.4% of the population, and African Americans are
7.8% of the population. Native Americans, Hawaiians, and other races combined total
3.0% of the population. When compared to the state, the county has a larger
percentage of Latinos, Asians and African Americans.
Population, by Race and Ethnicity
Los Angeles County California
Hispanic or Latino 48.5% 39.0%
White 26.2% 37.2%
Asian 14.4% 14.3%
Black/African American 7.8% 5.5%
Multiracial 2.3% 3.0%
Native HI/Pacific Islander 0.2% 0.4%
Some other race 0.3% 0.3%
American Indian/AK Native 0.2% 0.4%
Source: U.S. Census Bureau, American Community Survey, 2015-2019, DP05. https://data.census.gov
Citizenship
In the service area, 34% of the population is foreign-born, which is higher than the state
rate (26.8%). Of the foreign-born, 47.7% are not citizens. It is important to note that not
being a U.S. citizen does not indicate an illegal resident status within the U.S.
USC Norris Cancer Hospital 2022 Community Health Needs Assessment 15Foreign Population and Citizenship Status
Los Angeles County California
Foreign Population 34.0% 26.8%
Of foreign born, not U.S. citizen 47.7% 48.3%
Source: U.S. Census Bureau, American Community Survey, 2015-2019, DP02. https://data.census.gov
Language
In LA County, 43.4% of the residents, ages five and older, speak English only in the
home, 39.2% of residents speak Spanish, 10.9% speak an Asian language, and 5.3%
speak an Indo-European language in the home.
Language Spoken at Home for the Population, Ages 5 and Older
English Indo-
Spanish Asian Other
Only European
Los Angeles County 43.4% 39.2% 10.9% 5.3% 1.1%
California 55.8% 28.7% 10.0% 4.5% 1.0%
Source: U.S. Census Bureau, American Community Survey, 2015-2019, S1601. https://data.census.gov
Limited English-Speaking Households
According to the U.S. Census Bureau, “Limited English-speaking households” are
households in which no one, ages 14 and over, speaks English only or speaks a
language other than English at home and speaks English “very well.” In LA County
households, 12.7% of households are Limited English speakers. This is higher than the
state rate (8.9%).
Limited English-Speaking Households
Percent
Los Angeles County 12.7%
California 8.9%
Source: U.S. Census Bureau, American Community Survey, 2015-2019, S1602. https://data.census.gov U.S. Census Bureau,
American Community Survey and Puerto Rico Community Survey 2019 Subject Definitions. https://www2.census.gov/programs-
surveys/acs/tech_docs/subject_definitions/2019_ACSSubjectDefinitions.pdf
Family Size
The average family size in the county is 3.66 persons, which is larger than the statewide
average family size (3.53 persons).
Average Family Size
Family Size/Persons
Los Angeles County 3.66
California 3.53
Source: U.S. Census Bureau, American Community Survey, 2015-2019, DP02. https://data.census.gov
USC Norris Cancer Hospital 2022 Community Health Needs Assessment 16Veteran Status
In the county, 3.3% of the population, 18 years and older, are veterans. This is lower
than the percentage of veterans in the state (5.2%).
Veterans
Los Angeles County California
Veteran status 3.3% 5.2%
Source: U.S. Census Bureau, American Community Survey, 2015-2019, DP02. https://data.census.gov
USC Norris Cancer Hospital 2022 Community Health Needs Assessment 17Social Determinants of Health
Social and Economic Factors Ranking
The County Health Rankings ranks counties according to health factors data. This
ranking examines: high school graduation rates, unemployment, children in poverty,
social support, and others. Social and economic indicators are examined as a
contributor to the health of a county’s residents. California’s 58 counties are ranked
according to social and economic factors with 1 being the county with the best factors
(healthiest) to 58 for that county with the poorest factors (least healthy). Los Angeles
County is ranked 34 among counties in California, a decrease from a ranking of 30 in
2020 according to social and economic factors, placing it in the bottom half of the state’s
counties.
Social and Economic Factors Ranking
County Ranking (out of 58)
Los Angeles County 34
Source: County Health Rankings, 2021 http://www.countyhealthrankings.org
Poverty
Poverty thresholds are used for calculating official poverty population statistics. They
are updated each year by the Census Bureau. For 2019, the federal poverty level (FPL)
for one person was $13,011 and for a family of four $25,926. In LA County, 14.9% of
the population live in poverty and 34.8% are considered low-income, living below 200%
of poverty. These rates are higher than the state rates of poverty.
Ratio of Income to Poverty
Below 100% Poverty Below 200% Poverty
Los Angeles County 14.9% 34.8%
California 13.4% 31.0%
Source: U.S. Census Bureau, American Community Survey, 2015-2019, S1701. http://data.census.gov/
In LA County, children suffer with higher rates of poverty than the general population.
20.8% of children, under age 18, are living in poverty. Among families where there is a
female head of household and children under 18 years old, 33.3% live in poverty. This
is slightly higher than the state rate of 33.1%. Among seniors, 13.2% in LA County live
in poverty, which is higher than the state rate (10.2%).
Poverty, Children under 18, Seniors, Female Head of Household with Children under 18
Female HoH with
Children under 18 Seniors
Children under 18
Los Angeles County 20.8% 13.2% 33.3%
California 18.1% 10.2% 33.1%
Source: U.S. Census Bureau, American Community Survey, 2015-2019, S1701, S1702. http://data.census.gov/
USC Norris Cancer Hospital 2022 Community Health Needs Assessment 18Seniors Living Alone
22.5% of seniors in the county live alone. Many older people who live alone are
vulnerable due to social isolation, poverty, disabilities, lack of access to care, or
inadequate housing.
Seniors, Ages 65 and Older, Living Alone
Percent
Los Angeles County 22.5%
California 23.1%
Source: U.S. Census Bureau, American Community Survey, 2015-2019, B09020. http://data.census.gov/
People with a Disability Living in Poverty
Persons with a disability are more likely to live in poverty as compared to the rest of the
population. In the county, 25% of people, ages 20 to 64, with a disability are living below
the poverty level.
People with a Disability, Living in Poverty
Percent
Los Angeles County 25.0%
California 23.9%
Source: U.S. Census Bureau, American Community Survey, 2015-2019, B23024. http://data.census.gov/
Public Program Participation
In LA County, 38.3% of residents are not able to afford food and 27.1% receive food
stamps. This indicates a considerable percentage of residents who may qualify for food
stamps but do not access this resource. WIC benefits are more readily accessed in the
county. Among qualified children, 40.5% access WIC. 10.2% of county residents are
TANF/CalWORKs recipients.
Public Program Participation
Los Angeles County California
Not able to afford food (Free and Reduced-Price Meals Eligibility
Percent of Eligible Students
Los Angeles Unified School District (LAUSD) 80.3%
Los Angeles County 68.9%
California 59.3%
Source: California Department of Education, 2019-2020. http://data1.cde.ca.gov/dataquest/
Unemployment
In 2020, LA County had an unemployment rate of 12.8%. This high rate may be
attributed to the COVID-19 pandemic.
Unemployment Rates, Annual Average, 2018-2020
2018 2019 2020
Los Angeles County 4.7% 4.6% 12.8%
California 4.3% 4.2% 10.1%
Source: California Employment Development Department, Labor Market Information;
http://www.labormarketinfo.edd.ca.gov/data/unemployment-and-labor-force.html - HIST
Median Household Income
The median household income in the county is $72,797, which is lower than the
statewide average of $80,440.
Median Household Income
Median Household Income
Los Angeles County $72,797
California $80,440
Source: U.S. Census Bureau, American Community Survey, 2019, B19013. http://data.census.gov/
Community Input – Economic Insecurity
Stakeholder interviews identified the following issues, challenges and barriers related to
economic insecurity. Following are their comments edited for clarity:
● There are systems in place that can either facilitate or make it more difficult for
people to break the cycle of poverty, attain economic security, and access the health
services they need.
● Government policies and programs that bolster the public safety net are needed,
and existing programs that research has shown to be effective in providing funds for
healthy foods and reducing economic insecurity could be scaled up to reach more
eligible people
● There is a need for programs outside of workforce or life skills development that
involve institutions using their power to help shift structural inequalities in meaningful
ways and build relationships and social capital within communities.
● Individual and neighborhood socioeconomic status have a profound influence on
access to healthy foods and housing, particularly given inflation and the high cost of
groceries and rent.
USC Norris Cancer Hospital 2022 Community Health Needs Assessment 20● A lack of a living wage and incomes below the federal poverty level make it difficult
for many families to access health care on a regular basis. It is common for people
to discontinue health care because they cannot afford transportation or the cost of
continuing with their preferred provider. There is a need for financial assistance to
help with medical bills or to facilitate completing episodes of care.
● Many social service organizations and health care systems use telephone calls as a
mode of communication with clients/patients. However, many people cannot afford
phones or other forms of technology. Some programs exist that provide individuals
with low incomes with cell phones. However, individuals without documentation
cannot benefit from those programs.
Food Environment Index
The food environment index combines two measures of food access: the percentage of
the population that is low-income and has low access to a grocery store, and the
percentage of the population that did not have access to a reliable source of food during
the past year (food insecurity). The index ranges from 0 (worst) to 10 (best). In LA
County, the Index is 8.4, which is lower than the state index of 8.8.
Food Environment Index
Los Angeles County California
Food Index (0 to 10) 8.4 8.8
Source: County Health Rankings, 2021. https://www.countyhealthrankings.org/
Food Insecurity
Food insecurity is “a lack of consistent access to enough food for every person in a
household to live an active, healthy life.” (Feeding America, 2021) The percentage of people
experiencing food insecurity in LA County is 10.7%, which is higher than the state rate
(10.2%). Feeding America projects that the overall food insecurity rate for LA County
has increased by 51% in 2020 due to COVID.
Food Insecurity
Los Angeles County California
Overall food insecurity rate 10.7% 10.2%
Child food insecurity rate 14.5% 13.7%
Source: Feeding America, State-by-State Resource: The Impact of Coronavirus on Food Insecurity, 2019,
https://feedingamericaaction.org/resources/state-by-state-resource-the-impact-of-coronavirus-on-food-insecurity/.
Community Input – Food Insecurity
Stakeholder interviews identified the following issues, challenges and barriers related to
food insecurity. Following are their comments edited for clarity:
● One quarter of census tracts in Los Angeles County qualify as food deserts,
meaning there is limited access to affordable or healthy foods.
● Economically disadvantaged communities in Los Angeles that are located in food
USC Norris Cancer Hospital 2022 Community Health Needs Assessment 21deserts do not have access to grocery stores or affordable healthy food options.
Often when there is a small market nearby, the store does not have as many fresh
fruits and vegetables compared to larger grocery stores.
● In low-income neighborhoods, there are more corner stores vs. supermarkets, where
produce is more expensive and of lower quality. Communities in these areas also
have less access to food delivery services due to income barriers or being located in
a more rural/remote area. Lack of cars and public transportation, and fewer food
pantries, also make it harder for people to obtain food.
● Some residents must drive or take a bus to go to a grocery store outside of the
community to find healthy food options.
● Students in particular face hunger, and some grade school teachers stock their
classrooms with food for students to eat at school or bring home with them.
● Churches and community gardens are hosting free food events such as pop-up
drive-through food pantries that students and their families can benefit from.
● When the pandemic began, schools became grab-n-go centers to distribute meals
for families. Students have received free lunches from the Los Angeles Unified
School District.
● Food pantries in Antelope Valley have had their clientele double or triple since the
start of the pandemic. Many people have never visited a pantry before, are unsure
how to navigate the system, and feel embarrassed asking for help.
● Lack of transportation is a barrier to food security. Many people do not have a car,
making it difficult to travel to a grocery store. Public transportation is also not an
option for many people, in particular women and older adults, who may not feel safe.
● In some communities, grocery stores are too spread out, which is a particular
challenge for people with a disability that affects mobility.
● Mental health is a commonly-overlooked barrier to behavior changes such as
families starting and keeping healthy diets and eating patterns.
Housing Units
There are almost 3.5 million housing units in LA County. 45.8% of the occupied housing
units are owner occupied and 54.2% are renter occupied. The percentage of renter-
occupied housing exceeds the state rate (45.2%).
Housing Units, Owners and Renters
Total Housing Units Owner Occupied Renter Occupied
Los Angeles County 3,328,398 45.8% 54.2%
California 13,157,873 54.8% 45.2%
Source: U.S. Census Bureau, American Community Survey, 2015-2019, B25003. http://data.census.gov/
Housing Affordability
According to the US Department of Housing and Urban Development, those who spend
30% or more of their income on housing are said to be “cost burdened.” 57.6% of LA
USC Norris Cancer Hospital 2022 Community Health Needs Assessment 22County renters are housing cost burdened, spending 30% or more of their income on
rent.
Renters Spending 30% or More of Household Income on Rent
Los Angeles County California
Renters spending >30% of income on rent 57.6% 54.8%
Source: U.S. Census Bureau, American Community Survey, 2015-2019, DP02. http://data.census.gov/
Housing Supply
32.4% of households in LA County experience severe housing problems including
overcrowding, severely high housing costs, lack of complete kitchen facilities, or lack of
plumbing facilities.
Severe Housing Problems
Los Angeles County California
Households with severe housing problems 32.4% 26.2%
Source: U.S. Department of Housing and Urban Development, Comprehensive Housing Affordability Strategy (CHAS) Data, 2014-
2018. https://www.huduser.gov/portal/datasets/cp.htm
Homelessness
Los Angeles Homeless Services Authority (LAHSA) conducts the annual Greater Los
Angeles Homeless Count as a snapshot to determine how many people are homeless
on a given day. Data from this survey show an increase in homelessness between 2019
and 2020. For the 2020 homeless count, the county had estimated there were 63,706
persons experiencing homelessness. 72.3% of people experiencing homelessness
were unsheltered and 75.6% were individual adults, ages 25 and older.
People Experiencing Homelessness, LA County, 2019-2020
Los Angeles County
2019 2020
Total homeless 56,257 63,706
Sheltered 24.5% 27.7%
Unsheltered 75.5% 72.3%
Individual adults (ages 25 and older) 79.9% 75.6%
Family members 15.0% 19.5%
Unaccompanied minors (Homeless Subpopulations*
Los Angeles County
2019 2020
Chronically homeless 27.6% 38.4%
Substance abuse 12.9% 23.9%
Severe Mental Illness 22.9% 22.2%
Veterans 6.3% 5.8%
Domestic violence experience 36.0% 28.8%
Physical disability 16.4% 17.0%
Persons with HIV/AIDS 2.2% 1.8%
Source: Los Angeles Homeless Service Authority, 2019 & 2020 Greater Los Angeles Homeless Count.
www.lahsa.org/homelesscount_results *These data represent the homeless counts from the LA Continuum of Care, which does not
include Glendale, Long Beach and Pasadena homeless counts.
In the 2020-2021, the Los Angeles County School District had 1.2% of students enrolled
in charter and non-charter public schools who were identified as homeless in the service
area.
Homeless Students, by School District
Number Percent
Los Angeles Unified School District 6,677 1.2%
Los Angeles County 40,301 2.9%
California 183,312 3.1%
Source: California Department of Education, Enrollment Data - 2020-2021, Statewide Enrollment by Subgroup for Charter and Non-
Charter Schools. https://data1.cde.ca.gov/dataquest/
Community Input – Housing and Homelessness
Stakeholder interviews identified the following issues, challenges and barriers related to
housing and homelessness. Following are their comments edited for clarity:
● Many people experiencing homelessness have grown up in the area and have family
members who care about them but don’t know how to help them because they are
using substances or are violent due to an untreated serious mental health condition).
● Specific neighborhoods that have many residents facing housing instability include:
Huntington Drive at the Poplar intersection and Monterey Road near Occidental in
Northeast LA, where there was described as being a high density of apartments and
people.
● There is a housing crisis that has resulted in many residents with low incomes, and
in particular immigrant populations, to live in crowded housing due to high housing
costs.
● When people do not have stable housing, it makes it more difficult for them to make
follow-up health care appointments.
● Homelessness cannot be addressed with a “one size fits all” approach. It is
important to consider that every unhoused individual has their own set of needs.
This is especially true when engaging individuals in mental or behavioral health
services.
USC Norris Cancer Hospital 2022 Community Health Needs Assessment 24Education
In the county, 20.2% of adults, ages 25 and older, have not obtained a high school
diploma. This is higher than the state rate of 16%. 79.8% of the adult population has a
high school diploma or higher degree.
Educational Attainment
Los Angeles County California
Population, ages 25 and over 6,961,614 26,937,872
Less than 9th grade 11.8% 8.7%
9th to 12th grade, no diploma 8.4% 7.3%
High school graduate 20.7% 20.6%
Some college, no degree 18.5% 20.6%
Associate degree 6.9% 7.9%
Bachelor's degree 22.3% 21.9%
Graduate or professional degree 11.5% 13.1%
High school graduation or higher 79.8% 84.0%
Source: U.S. Census Bureau, American Community Survey, 2019, S1501. http://factfinder.census.gov
High school graduation rates are determined by dividing the number of graduates for
the school year by the number of freshmen enrolled four years earlier. The Healthy
People 2030 high school graduation objective is 90.7%. The Los Angeles Unified
School District high school graduation rate was 80.1% and did not meet the Healthy
People 2030 objective for high school graduation.
High School Graduation Rates, 2019-2020
High School Graduation Rate
Los Angeles Unified School District 80.1%
Los Angeles County 86.5%
California 87.6%
Source: California Department of Education, 2020. https://data1.cde.ca.gov/dataquest/
Transportation
In LA County, 70.3% of workers, ages 16 and older, drove alone to work. 5.6% of
workers worked from home, 2.7% walked to work, and 2.4% used other means to get to
work. The average service area commute time was 31.8 minutes.
Transportation for Workers, Ages 16 and Older
Los Angeles County California
Drove alone to work 74.0% 73.7%
Carpooled to work 9.5% 10.1%
Commuted by public transportation 5.8% 5.1%
Walked 2.7% 2.6%
Other means 2.4% 2.6%
Worked from home 5.6% 5.9%
Mean travel time to work (minutes) 31.8 29.8
Source: U.S. Census Bureau, 2015-2019 American Community Survey 5-Year Estimates, DP03. https://data.census.gov/cedsci/
USC Norris Cancer Hospital 2022 Community Health Needs Assessment 25Parks, Playgrounds and Open Spaces
Children and teens who live in close proximity to safe parks, playgrounds, and open
spaces tend to be more physically active than those who do not live near those facilities.
Among youth, 92.3% lived within walking distance to a playground or open space and
74.2% visited a park, playground, or open space within the past month.
Access to Open Spaces, Children and Teens, Ages One Year and Older
Los Angeles County California
Walking distance to park, playground or open 92.3%* 89.2%
Visited a park/playground/open space 74.2% 81.4%
Source: California Health Interview Survey, 2018. *Statistically unstable due to sample size. http://ask.chis.ucla.edu/
Among LA County families, 86.5% with children and 82.5% with teens agreed/strongly
agreed parks and playgrounds closest to where they lived were safe during the day.
Parks and Playgrounds Perceived as Safe During the Day
Los Angeles County California
Children, ages 1-11 86.5% 89.2%
Teens, ages 12-17 82.5% 85.7%
Source: California Health Interview Survey, 2019. *Statistically unstable due to sample size. http://ask.chis.ucla.edu/
Crime and Violence
Property crimes include burglary, motor vehicle theft, and larceny. LA County’s rate of
property crime is 2,130.8 per 100,000 persons. This is higher than the state rate of
property crime (2,127.5 per 100,000 persons). Violent crimes include homicide, rape,
robbery, and aggravated assault. LA County has a rate of 545.2 violent crimes per
100,000 persons, which is higher than the state rate of 439.7 per 100,000 persons.
Violent Crime and Property Crime Rates, per 100,000 Persons
Property Crime Violent Crime
Los Angeles County 2130.8 545.2
California 2127.5 439.7
Source: California Department of Justice, Office of the Attorney General, 2020. https://openjustice.doj.ca.gov/exploration/crime-
statistics/crimes-clearances. Accessed on October 19, 2021. Population data U.S. Census Bureau, 2020 P1 Redistricting Data.
There were 354.5 domestic violence calls per 100,000 persons in LA County, which is
higher than the state rate (279.8 per 100,000 persons).
Domestic Violence Calls and Rate, per 100,000 Persons
Total Calls Rate
Los Angeles County 35,498 354.5
California 160,646 279.8
Source: California Department of Justice, Office of the Attorney General, 2021. https://openjustice.doj.ca.gov/exploration/crime-
statistics/domestic-violence-related-calls-assistance. Accessed on October 19, 2021. Population data U.S. Census Bureau, 2020 P1
Redistricting Data.
USC Norris Cancer Hospital 2022 Community Health Needs Assessment 26Substantiated Child Maltreatment Cases
Child maltreatment includes neglect, physical, sexual, and emotional abuse. In LA
County, there were 8.6 substantiated maltreatment cases per 1,000 children under age
18. The rates of child abuse cases are higher in LA County than the state.
Substantiated Child Maltreatment Cases, per 1,000 Children, Under Age 18
Los Angeles County California
Substantiated child maltreatment cases 8.6 6.8
Source: University of California at Berkeley, California Child Welfare Indicators Project (CCWIP), 2020. Accessed on October 19,
2021. https://ccwip.berkeley.edu
Community Input – Violence and Injury
Stakeholder interviews identified the following issues, challenges and barriers related to
violence and injury. Following are their comments edited for clarity:
● Pedestrian safety and bike safety are important issues, due to reckless driving and
distracted driving.
● Safety issues contribute to residents being less likely to actively commute.
● Unsheltered individuals may cause harm to street vendors or the general public. In
some cases, this is due to complex trauma and a lack of access to treatment and
emergency intervention among people with severe mental health conditions.
● Responding to intimate partner violence has become more difficult since the onset of
the COVID-19 pandemic. For example, it can be more difficult for survivors to
access domestic violence education programs that are virtual/online, since they may
be sharing a living space with their abuser and conversations, if overheard, could
trigger additional violence.
● Many survivors of intimate partner violence have been unable to escape their
abusers, as a result of isolation or economic insecurity, since the start of the COVID-
19 pandemic. This has resulted in additional trauma and need for health and mental
health services.
● Crime, interpersonal violence, and gang involvement have increased since the start
of the pandemic. We face the challenge of interrupting cycles of violence in a
sustainable way.
● There is a need for law enforcement diversion programs and collaborations to
support healing and sustainable change.
● Gangs are constantly recruiting.
● Many families, especially in Northeast and South Los Angeles, live under great
stress generated by gang involvement or living in fear of gang violence. These
stressors cause depression, ACES (adverse childhood experiences), and trauma
among everyone in the community.
Air Quality
Los Angeles air quality averages a US AQI or air quality index rating of “moderate.”
USC Norris Cancer Hospital 2022 Community Health Needs Assessment 27You can also read