4.3.6 GEOLOGIC - Mercer County
←
→
Page content transcription
If your browser does not render page correctly, please read the page content below
SECTION 4.3.6 - GEOLOGIC
4.3.6 GEOLOGIC
The following section provides the hazard profile (hazard description, location, extent, previous occurrences and
losses, probability of future occurrences, and impact of climate change) and vulnerability assessment for the
geological hazards in Mercer County.
2021 HMP UPDATE CHANGES
Previous occurrences were updated with events that occurred between 2015 and 2021.
Slopes greater than 15% were utilized to evaluate the potential for landslide. This provided a higher
resolution analysis compared to the Radbruch et al. Landslide Incidence and Susceptibility GIS layer from
the National Atlas used in the 2016 HMP.
Profile
Hazard Description
Landslides
According to the U.S. Geological Survey (USGS), the term landslide includes a wide range of ground movement,
such as rock falls, deep failure of slopes, and shallow debris flows. Although gravity acting on an over steepened
slope is the primary reason for a landslide, there are other contributing factors (NJGWS 2013). Among the
contributing factors are: (1) erosion by rivers, glaciers, or ocean waves which create over-steepened slopes; (2)
rock and soil slopes weakened through saturation by snowmelt or heavy rains; (3) earthquakes which create
stresses making weak slopes fail; and (4) excess weight from rain/snow accumulation, rock/ore stockpiling,
waste piles, or man-made structures. Scientists from the USGS also monitor stream flow, noting changes in
sediment load in rivers and streams that may result from landslides. All of these types of landslides are considered
aggregately in USGS landslide mapping.
In New Jersey, there are four main types of landslides: slumps, debris flows, rockfalls, and rockslides. Slumps
are coherent masses that move downslope by rotational slip-on surfaces that underlie and penetrate the landslide
deposit (Briggs et al 2001). A debris flow, also known as a mudslide, is a form of rapid mass movement in
which loose soil, rock, organic matter, air, and water mobilize as slurry that flows downslope. Debris flows are
often caused by intense surface water from heavy precipitation or rapid snow melt. This precipitation loosens
surface matter, thus triggering the slide. Rockfalls are common on roadway cuts and steep cliffs. These
landslides are abrupt movements of geological material such as rocks and boulders. Rockfalls happen when
these materials become detached. Rockslides are the movement of newly detached segments of bedrock sliding
on bedrock, joint, or fault surfaces (Delano and Wilshusen 2001).
Landslides can cause several types of secondary effects, such as blocking access to roads, which can isolate
residents and businesses and delay commercial, public, and private transportation. This could result in economic
losses for businesses. Other potential problems resulting from landslides are power and communication failures.
Vegetation or poles on slopes can be knocked over, resulting in possible losses to power and communication
lines. Landslides also have the potential of destabilizing the foundation of structures, which may result in
monetary loss for residents. They also can damage rivers or streams, potentially harming water quality, fisheries,
and spawning habitat.
DMA 2000 Hazard Mitigation Plan Update – Mercer County, New Jersey 4.3.6-1
MONTH 2021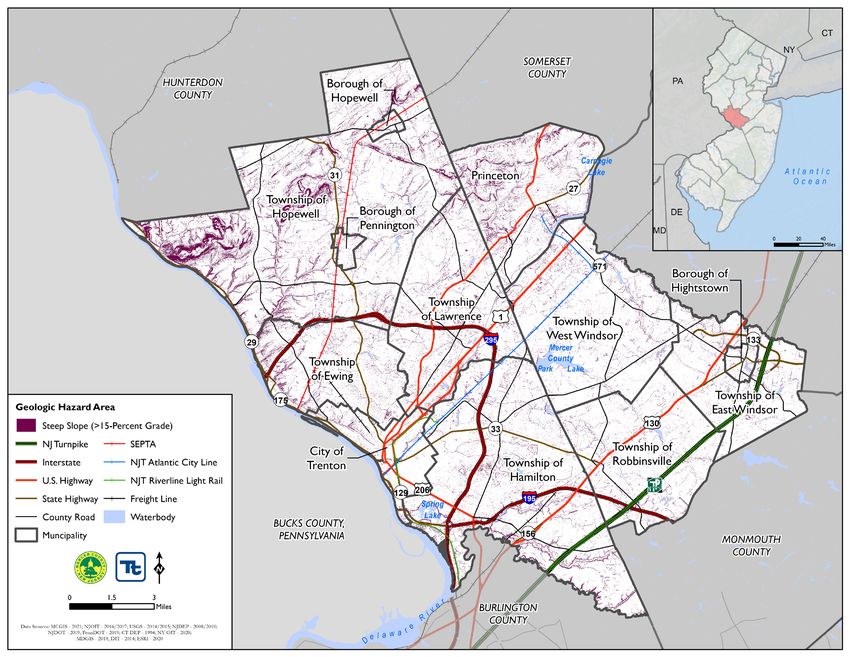
SECTION 4.3.6 - GEOLOGIC
Subsidence/Sinkholes
Land subsidence can be defined as the sudden sinking or gradual downward settling of the earth’s surface with
little or no horizontal motion, owing to the subsurface movement of earth materials (USGS 2000). Subsidence
often occurs through the loss of subsurface support in karst terrain, which may result from a number of natural-
and human-caused occurrences. Karst describes a distinctive topography that indicates dissolution of underlying
carbonate rocks (limestone and dolomite) by surface water or groundwater over time. The dissolution process
causes surface depressions and the development of sinkholes, sinking stream, enlarged bedrock fractures, caves,
and underground streams (NJOEM 2019).
Sinkholes, the type of subsidence most frequently seen in New Jersey, are a natural and common geologic feature
in areas with underlying limestone, carbonate rock, salt beds, or other rocks that are soluble in water. Over
periods of time, measured in thousands of years, the carbonate bedrock can be dissolved through acidic rain
water moving in fractures or cracks in the bedrock. This creates larger openings in the rock through which water
and overlying soil materials will travel. Over time the voids will enlarge until the roof over the void is unable
to support the land above at which time it will collapse, forming a sinkhole. In this example the sinkhole occurs
naturally, but in other cases the root causes of a sinkhole are anthropogenic. These anthropogenic causes can
include changes to the water balance of an area such as: over-withdrawal of groundwater; diverting surface water
from a large area and concentrating it in a single point; artificially creating ponds of surface water; and drilling
new water wells. These actions can accelerate the natural processes of creation of soil voids, which can have a
direct impact on sinkhole creation (NJOEM 2019).
The State’s susceptibility to subsidence is also due in part to the number of abandoned mines throughout New
Jersey. The mining industry in New Jersey dates back to the early 1600s when cooper was first mined by Dutch
settlers along the Delaware River in Warren County. While there are approximately 588 abandoned mines in
New Jersey, Mercer County is not home to any mines (NJGWS 2006).
Both natural and man-made sinkholes can occur without warning. Slumping or falling fence posts, trees, or
foundations, sudden formation of small ponds, wilting vegetation, discolored well water, and/or structural cracks
in walls and floors, are all specific signs that a sinkhole is forming. Sinkholes can range in form from steep-
walled holes, to bowl, or cone-shaped depressions. When sinkholes occur in developed areas they can cause
severe property damage, disruption of utilities, damage to roadways, injury, and loss of life (NJOEM 2019).
Location
Landslides
Expansion of urban and recreational developments into hillside areas exposes more people to the threat of
landslides each year. According to the USGS, Mercer County has low landslide potential. For a figure
displaying the landslide potential of the conterminous United States, please refer to
http://pubs.usgs.gov/fs/2005/3156/2005-3156.pdf (USGS 2005). Mercer County primarily has a low landslide
potential except along parts of its north/northwestern border, where there is a greater occurrence of steep slopes
(greater than 15-percent grade) as seen in Figure 4.3.6-1.
Although the data from USGS provides a starting place for the County to investigate where its land is more
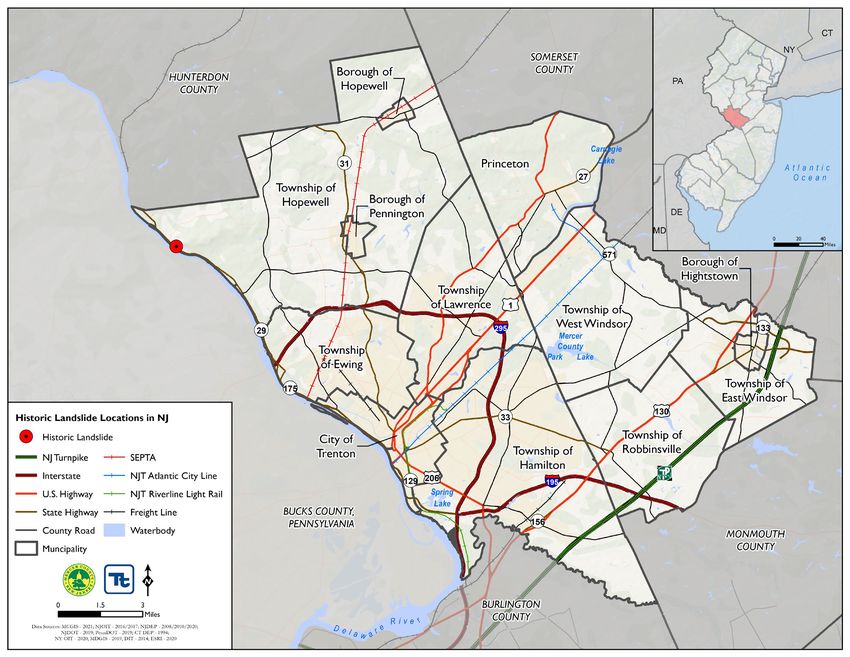
vulnerable to landslides, historic landslide locations also indicate potential risk areas. Figure 4.3.6-2 illustrates
the historic landslide locations in Mercer County. According to the figure, only one landslide event was recorded
to occur in Hopewell Township in 1948.
DMA 2000 Hazard Mitigation Plan Update – Mercer County, New Jersey 4.3.6-2
MONTH 2021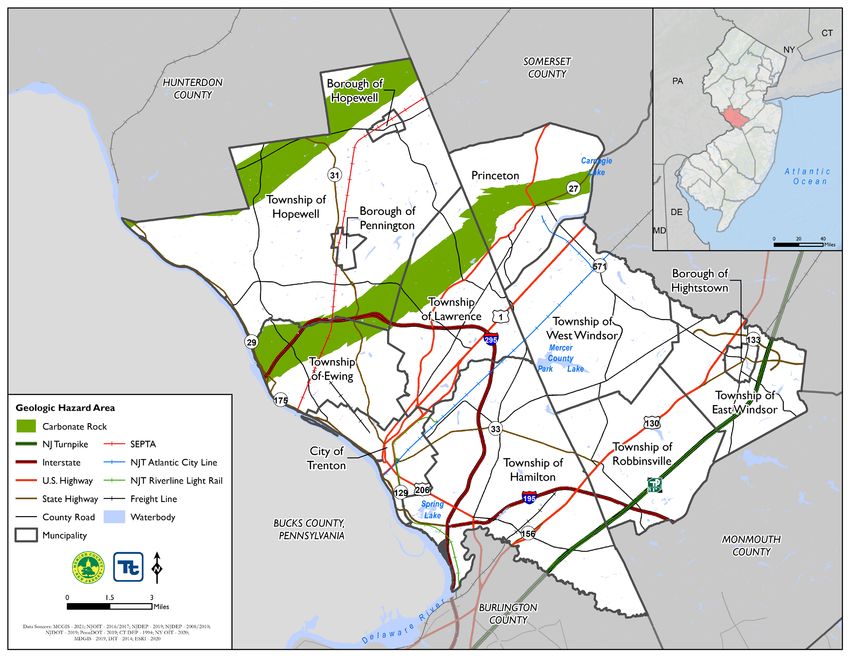
SECTION 4.3.6 - GEOLOGIC

Figure 4.3.6-1. Areas of Steep Slopes (Greater Than 15-Percent Grade) in Mercer County

       DMA 2000 Hazard Mitigation Plan Update – Mercer County, New Jersey                                  4.3.6-3
       MONTH 2021
SECTION 4.3.6 - GEOLOGIC
Figure 4.3.6-2. Historic Landslide Locations in Mercer County, 1869 to 2021
DMA 2000 Hazard Mitigation Plan Update – Mercer County, New Jersey 4.3.6-4
MONTH 2021SECTION 4.3.6 - GEOLOGIC
Subsidence/Sinkholes
New Jersey is susceptible to the effects of subsidence and sinkholes, primarily in the northwestern section of the
State, which includes parts of Mercer County borders. Land subsidence and sinkholes have been known to occur
as a result of natural geologic phenomenon or as a result of human alteration of surface and underground geology
(New Jersey State HMP 2019).
Naturally occurring subsidence and sinkholes in New Jersey occur within bands of carbonate bedrock. Mercer
County has two major bands of carbonate rock running through the County; refer to Figure 4.3.6-3. One band
runs along the border with Hunterdon County. Another band runs southwest to northeast from the Township of
Ewing to Princeton. Overall, approximately 12-percent (17,212 acres) of the County has carbonate rock
formation (NJDEP 2019; Godt 2001).
As previously stated, abandoned mines are a source for sinkholes and subsidence in New Jersey. While NJ is
home to many abandoned mines, data from NJGWS indicate that Mercer County does not have any abandoned
mines (NJGWS 2006).
DMA 2000 Hazard Mitigation Plan Update – Mercer County, New Jersey 4.3.6-5
MONTH 2021SECTION 4.3.6 - GEOLOGIC
Figure 4.3.6-3. Carbonate Rock in Mercer County
DMA 2000 Hazard Mitigation Plan Update – Mercer County, New Jersey 6
MONTH 2021SECTION 4.3.6 - GEOLOGIC
Extent
Landslide
To determine the extent of a landslide hazard, the affected areas need to be identified and the probability of the
landslide occurring within some time period needs to be assessed. Natural variables that contribute to the overall
extent of potential landslide activity in any particular area include soil properties, topographic position and slope,
and historical incidence. Predicting a landslide is difficult, even under ideal conditions and with reliable
information. As a result, the landslide hazard is often represented by landslide incidence and/or susceptibility,
as defined below:
Landslide incidence is the number of landslides that have occurred in a given geographic area. High
incidence means greater than 15-percent of a given area has been involved in landsliding; medium incidence
means that 1.5- to 15-percent of an area has been involved; and low incidence means that less than 1.5-
percent of an area has been involved.
Landslide susceptibility is defined as the probable degree of response of geologic formations to natural or
artificial cutting, to loading of slopes, or to unusually high precipitation. It can be assumed that unusually
high precipitation or changes in existing conditions can initiate landslide movement in areas where rocks
and soils have experienced numerous landslides in the past. Landslide susceptibility depends on slope angle
and the geologic material underlying the slope. Landslide susceptibility only identifies areas potentially
affected and does not imply a time frame when a landslide might occur. High, medium, and low
susceptibility are delimited by the same percentages used for classifying the incidence of landsliding
(NJOEM 2019).
Subsidence/Sinkhole
Landslide subsidence occurs slowly and continuously over time or abruptly for various reasons. Subsidence and
sinkholes can occur due to either natural processes (karst sinkholes in areas underlain by soluble bedrock) or as
a result of human activities. Subsidence in the U.S. has directly affected more than 17,000 square miles in 45
states, and associated annual costs are estimated to be approximately $125 million. The principal causes of
subsidence are aquifer-system compaction, drainage of organic soils, underground mining, hydrocompaction,
natural compaction, sinkholes, and thawing permafrost (USGS 2000). There are several methods used to
measure land subsidence. Global Positioning System (GPS) is a method used to monitor subsidence on a
regional scale. Benchmarks (geodetic stations) are commonly spaced around four miles apart (State of California
2015).
Another method which is becoming increasingly popular is Interferometric Synthetic Aperture Radar (InSAR).
InSAR is a remote sensing technique that uses radar signals to interpolate land surface elevation changes. It is
a cost-effective solution for measuring land surface deformation for a region while offering a high degree of
spatial detail and resolution (State of California 2015).
Previous Occurrences and Losses
FEMA Major Disasters and Emergency Declarations
Between 1954 and 2021, FEMA has not issued a disaster (DR) or emergency for any geological hazard-related
event (FEMA 2020). However, Mercer County was included in the FEMA disaster declaration for the remnants
of Tropical Storm Lee in 2011. Although this disaster is due to severe storms and flooding, it resulted in
secondary geological hazard impacts such as flood-induced landslides in certain locations in the State.
DMA 2000 Hazard Mitigation Plan Update – Mercer County, New Jersey 4.3.6-7
MONTH 2021SECTION 4.3.6 - GEOLOGIC
Table 4.3.6-1. FEMA DR and EM Declarations for Geologic Events in Mercer County
Declaration Event Date Declaration Date Event Description
September 8, 2011 -
DR-4039 October 14, 2011 New Jersey Remnants of Tropical Storm Lee
October 6, 2011
Source: FEMA 2021
U.S. Department of Agriculture Disaster Declarations
The Secretary of Agriculture from the USDA is authorized to designate counties as disaster areas to make
emergency loans to producers suffering losses in those counties and in counties that are contiguous to a
designated county. Between 2015 and 2021, Mercer County was not included in geologic related agricultural
disaster declarations (USDA 2021).
Geologic Events
For this 2021 HMP update, geologic events that have impacted Mercer County between 2015 and 2021 were
researched. Table 4.3.6-2 summarizes these events. Please see Section 9 (Jurisdictional Annexes) for detailed
information regarding impacts and losses to each municipality.
Table 4.3.6-2. Geologic Events in Mercer County, 2015 to 2021
FEMA
Declaration Mercer
Date(s) of Number County
Event Event Type (if applicable) Designated? Location Description
A sinkhole occurred at Washington
Township of
October 2, 2020 Sinkhole N/A N/A Road in the Township of West Windsor
West Windsor
leading to an emergency road closure.
Source: FEMA 2021; NOAA-NCEI 2021; NWS 2021; SPC 2021; NJOEM 2019
DR Disaster Declaration (FEMA)
FEMA Federal Emergency Management Agency
Mph miles per hour
N/A Not Applicable
DMA 2000 Hazard Mitigation Plan Update – Mercer County, New Jersey 4.3.6-8
MONTH 2021SECTION 4.3.6 - GEOLOGIC
Probability of Future Occurrences
Based upon risk factors for the County and past occurrences, it is likely that geological hazards will continue to
occur in Mercer County. Landslide probabilities are largely a function of surface geology but are also influenced
by both weather and human activities. There are presumably small landslides and sinkholes that have occurred
that have been not been reported to the NJGWS and are not included in the calculations below.
The probability of future landslides and sinkholes having a significant impact on life and property in Mercer
County is relatively low. The County will continue to experience the direct and indirect impacts of geological
hazards and its impacts on occasion, with the secondary effects causing potential disruption or damage to
communities. The table below shows the probability of future geologic events impacting the County based on
the historic record.
Table 4.3.6-3. Probability of Future Occurrence of Geologic Events
Probability of
Number of Recurrence event Percent Chance of
Occurrences Between Rate of Interval Occurring in Occurring in Any
Hazard Type 1948 and 2021 Occurrence (in years) Any Given Year Given Year
Landslide 1 0.01 74.00 0.01 1.4
Sinkhole 2 0.03 37.00 0.03 2.7
Total 3 0.04 24.67 0.04 4.1
Source: NJDEP 2012; NOAA-NCEI 2020; NJ.Com 2015; NJ State HMP 2019
Climate Change Impacts
New Jersey has become wetter over the past century. Annual precipitation in New Jersey has been 8-percent
above average during the last 10 years; and has experienced an upward trend of 4.1 inches in precipitation in
100-years (NJDEP 2019). Future climate change may impact storm patterns, increasing the probability of more
frequent and intense storms with varying duration. All of these factors could increase the probability for landslide
and subsidence/sinkhole occurrences.
Warming temperatures may increase the occurrence and duration of droughts, which would increase the
probability of wildfire, reducing the vegetation that helps to support steep slopes. As discussed throughout this
profile, one of the triggers for subsidence and sinkholes is an abundance of moisture which has the potential to
permeate the bedrock causing an event. Climatologists expect an increase in annual precipitation amounts. This
increase will coincide with an increased risk in subsidence and sinkholes in vulnerable areas.
More recently, sinkholes have been correlated to land use practices, especially from groundwater pumping and
from construction and development practices. Sinkholes may also form when the land surface is changed, such
as when industrial and runoff-storage ponds are created. The substantial weight of the new material can trigger
an underground collapse of supporting material, thus causing a sinkhole. Additionally, the overburden sediments
that cover buried cavities in the aquifer systems are delicately balanced by groundwater fluid pressure.
Groundwater is helping keep the surface soil in place. Pumping groundwater for urban water supply and for
irrigation can produce new sinkholes in sinkhole-prone areas. If pumping results in a lowering of groundwater
levels, then underground structural failure, sinkholes may occur as well (USGS 2020).
DMA 2000 Hazard Mitigation Plan Update – Mercer County, New Jersey 4.3.6-9
MONTH 2021SECTION 4.3.6 - GEOLOGIC
4.3.7 VULNERABILITY ASSESSMENT
Slopes above 15-percent were selected using the USGS 2014/2015 Digital Elevation Model (DEM) to represent
the landslide geologic hazard area. Additionally, the 2019 NJDEP bedrock geology layer was used to identify
areas of carbonate rock using limestone, dolomite, and dolomitic sandstones bedrock types for the
subsidence/sinkhole geologic hazard area. The following text summarizes the potential impact of geological
hazards on the County. Refer to Section 4.2 (Methodology) for additional details on the methodology used to
assess geological hazard risk.
Impact on Life, Health, and Safety
Generally, a landslide or subsidence event is an isolated event and impacts the populations within the immediate
area. Specifically, the population located downslope of the landslide hazard areas are particularly vulnerable.
In addition to causing damages to residential buildings and displacing residents, landslides and subsidence events
can block off or damage major roadways and inhibit travel for emergency responders or populations trying to
evacuate the area.
Table 4.3.6-4 summarizes the population living on landscapes with carbonate bedrock or on slopes greater than
or equal to 15-percent. Overall, 30,266 persons and 7,536 persons are living on carbonate bedrock or landscapes
with slopes greater than or equal to 15-percent, respectively. Princeton has the greatest proportion of population
exposed to the carbonate bedrock geologic hazard area. The Township of Hopewell has the greatest proportion
of population susceptible areas with landscape slopes greater than or equal to 15-percent, respectively.
Table 4.3.6-4. Estimated Population Living on Landscape with Carbonate Rock or Greater than 15-
Percent Slope by Municipality
American
Community Number of Number of Persons
Survey (2015- Persons Residing Residing on Steep Slopes
2019) on Carbonate Percent (Greater than 15 Percent
Jurisdiction Population Rock of Total Percent) of Total
East Windsor (Twp) 27,245 0 0.0% 264 1.0%
Ewing (Twp) 36,037 5,263 14.6% 891 2.5%
Hamilton (Twp) 87,424 0 0.0% 860 1.0%
Hightstown (B) 5,375 0 0.0% 36 0.7%
Hopewell (B) 1,915 0 0.0% 102 5.3%
Hopewell (Twp) 18,067 4,860 26.9% 1,443 8.0%
Lawrence (Twp) 32,614 6,385 19.6% 599 1.8%
Pennington (B) 2,531 0 0.0% 44 1.7%
Princeton 31,000 13,757 44.4% 1,991 6.4%
Robbinsville (Twp) 14,365 0 0.0% 309 2.1%
Trenton (C) 83,412 0 0.0% 715 0.9%
West Windsor (Twp) 27,937 0 0.0% 283 1.0%
Mercer County (Total) 367,922 30,266 8.2% 7,536 2.0%
Source: American Community Survey 2019 5-Year Estimates; NJDEP – 2019; USGS - 2014/2015
Note: B – Borough; C - City; Twp – Township; % - Percent
DMA 2000 Hazard Mitigation Plan Update – Mercer County, New Jersey 4.3.7-10
MONTH 2021SECTION 4.3.6 - GEOLOGIC
Research has also shown that some populations, while they may not have more hazard exposure, may experience
exacerbated impacts and prolonged recovery if/when impacted. For example, persons over the age of 65 and
people below the poverty level are most vulnerable to geologic hazards because of the potential limited access
to mobilization or medical resources if a landslide or subsidence event occurs. According to the 2019 ACS 5-
Year Population Estimate, there are 46,347 persons over 65 years old and 40,980 persons living below the
poverty level out of the total 366,513 persons that live in Mercer County. Higher concentrations of persons over
65 years in age reside in the Borough of Pennington and the Township of Hamilton. The highest concentrations
of persons living below the poverty level reside in the City of Trenton (i.e., 28-percent of total County
population).
Impact on General Building Stock
In general, the built environment is vulnerable to the geologic hazard if built on soils susceptible to sliding or
sink holes such as carbonate bedrock or slopes that are greater than 15-percent. Geologic hazard areas may
destabilize the foundation of structures resulting in monetary losses to businesses and residents. There are 8,749
buildings with a replacement cost value of approximately $12.4 billion built on lands with carbonate bedrock.
Furthermore, there are 2,365 buildings with a replacement cost value of approximately $4.9 billion built on lands
with slopes greater than 15-percent.
Princeton has the greatest number of buildings built on carbonate bedrock; 3,262 buildings (43-percent of its
total building stock) with an estimated replacement cost of $4.8 billion. The Township of Hopewell has the
greatest number of buildings built on landscapes with slopes greater than 15-percent; 604 buildings (7.8-percent
of its total building stock) with an estimated replacement cost of $1.1 billion. Table 4.3.6-5 summarizes the
number of buildings built on each geologic hazard area and the total replacement cost of these buildings by
municipality.
DMA 2000 Hazard Mitigation Plan Update – Mercer County, New Jersey 4.3.7-11
MONTH 2021SECTION 4.3.6 - GEOLOGIC
Table 4.3.6-5. Number and Value of Buildings Built on Lands with Carbonate Bedrock and Steep Slope (>15-percent) by Municipality
Total Replacement Cost
Number of Buildings Value of Structures
Located in the Steep Located in the Steep
Number Total Slope (Greater Than 15- Slope (Greater Than 15-
of Replacement Percent Grade) Geologic Percent Percent Grade) Geologic Percent
Jurisdiction Buildings Cost Value Hazard Area of Total Hazard Area of Total
East Windsor (Twp) 5,439 $7,712,408,240 59 1.1% $47,799,140 0.6%
Ewing (Twp) 12,054 $18,161,858,212 284 2.4% $497,597,526 2.7%
Hamilton (Twp) 29,515 $30,878,928,699 303 1.0% $336,195,009 1.1%
Hightstown (B) 1,624 $1,867,544,787 13 0.8% $21,810,540 1.2%
Hopewell (B) 844 $850,167,003 42 5.0% $40,852,942 4.8%
Hopewell (Twp) 7,719 $11,709,101,176 604 7.8% $1,119,700,942 9.6%
Lawrence (Twp) 9,027 $14,232,035,476 169 1.9% $329,479,687 2.3%
Pennington (B) 953 $1,009,760,468 18 1.9% $13,478,463 1.3%
Princeton 7,527 $12,608,393,758 494 6.6% $1,011,349,373 8.0%
Robbinsville (Twp) 4,162 $7,167,631,183 84 2.0% $53,447,159 0.7%
Trenton (C) 17,152 $36,604,311,832 214 1.2% $1,245,754,362 3.4%
West Windsor (Twp) 7,563 $13,179,360,332 81 1.1% $215,581,277 1.6%
Mercer County (Total) 103,579 $155,981,501,165 2,365 2.3% $4,933,046,419 3.2%
Source: Mercer County GIS 2019/2020; MOD-IV – 2019; RS Means 2021; NJDEP – 2019
Note: B – Borough; C - City; Twp – Township; % - Percent
DMA 2000 Hazard Mitigation Plan Update – Mercer County, New Jersey 4.3.7-12
MONTH 2021SECTION 4.3.6 - GEOLOGIC
Impact on Critical Facilities and Lifelines
To estimate potential risk to critical facilities, the geologic hazard areas were overlaid upon the critical facility
and lifeline inventory. There are 273 critical facilities built on lands with carbonate bedrock and 169 critical
facilities built on landscapes with slopes greater than 15-percent. All of these critical facilities are considered
lifelines. Refer to Table 4.3.5-6 and Table 4.3.5-7 which summarize the number of critical facilities and lifelines
exposed to the geologic hazard areas by municipality.
Table 4.3.5-6. Number of Critical Facilities and Lifelines Built on Carbonate Rock
Number of Critical Facilities and Lifeline
Facilities Located in the Carbonate Rock
Geologic Hazard Area
Total Total Percent
Number Number of Total Percent
of Critical of Critical Critical of Total
Jurisdiction Facilities* Lifelines** Facilities Facilities Lifelines Lifelines
East Windsor (Twp) 171 154 0 0.0% 0 0.0%
Ewing (Twp) 266 215 66 24.8% 54 25.1%
Hamilton (Twp) 639 537 0 0.0% 0 0.0%
Hightstown (B) 70 63 0 0.0% 0 0.0%
Hopewell (B) 47 39 0 0.0% 0 0.0%
Hopewell (Twp) 438 406 76 17.4% 70 17.2%
Lawrence (Twp) 334 304 32 9.6% 30 9.9%
Pennington (B) 44 40 0 0.0% 0 0.0%
Princeton 252 209 99 39.3% 77 36.8%
Robbinsville (Twp) 136 127 0 0.0% 0 0.0%
Trenton (C) 701 478 0 0.0% 0 0.0%
West Windsor (Twp) 288 234 0 0.0% 0 0.0%
Mercer County (Total) 3,386 2,806 273 8.1% 231 8.2%
Source: Mercer County GIS - 2020; NJDEP – 2019
Notes: B = Borough, C = City, Twp = Township, % = Percent
*Community lifelines are included in the total number of critical facilities.
**Total number of critical facilities considered lifelines.
Table 4.3.5-7. Number of Critical Facilities and Lifelines Built on Slopes Greater than 15% Grade
Number of Critical Facilities and Lifeline
Facilities Located in the Steep Slope
(Greater Than 15-Percent Grade) Geologic
Total Hazard Area
Number Total Percent
of Number of Total Percent
Critical of Critical Critical of Total
Jurisdiction Facilities Lifelines** Facilities Facilities Lifelines Lifelines
East Windsor (Twp) 171 154 7 4.1% 7 4.5%
Ewing (Twp) 266 215 14 5.3% 12 5.6%
Hamilton (Twp) 639 537 16 2.5% 15 2.8%
Hightstown (B) 70 63 3 4.3% 2 3.2%
DMA 2000 Hazard Mitigation Plan Update – Mercer County, New Jersey 4.3.7-13
MONTH 2021SECTION 4.3.6 - GEOLOGIC
Number of Critical Facilities and Lifeline
Facilities Located in the Steep Slope
(Greater Than 15-Percent Grade) Geologic
Total Hazard Area
Number Total Percent
of Number of Total Percent
Critical of Critical Critical of Total
Jurisdiction Facilities Lifelines** Facilities Facilities Lifelines Lifelines
Hopewell (B) 47 39 0 0.0% 0 0.0%
Hopewell (Twp) 438 406 53 12.1% 49 12.1%
Lawrence (Twp) 334 304 8 2.4% 8 2.6%
Pennington (B) 44 40 2 4.5% 2 5.0%
Princeton 252 209 26 10.3% 23 11.0%
Robbinsville (Twp) 136 127 6 4.4% 6 4.7%
Trenton (C) 701 478 28 4.0% 23 4.8%
West Windsor (Twp) 288 234 6 2.1% 6 2.6%
Mercer County (Total) 3,386 2,806 169 5.0% 153 5.5%
Source: Mercer County GIS 2020; USGS 2014/2015
Notes: B = Borough, C = City, Twp = Township, % = Percent
*Community lifelines are included in the total number of critical facilities.
**Total number of critical facilities considered lifelines.
A significant amount of infrastructure can be exposed to mass movements of geological material:
Roads—Access to major roads is crucial to life-safety after a disaster event and to response and recovery
operations. Landslides can block egress and ingress on roads, causing isolation for neighborhoods,
traffic problems, and delays for public and private transportation. This can result in economic losses
for businesses.
Bridges—Landslides can significantly impact road bridges. Mass movements can knock out bridge
abutments or significantly weaken the soil supporting them, making them hazardous for use.
Power Lines—Power lines are generally elevated above steep slopes; but the towers supporting them
can be subject to landslides. A landslide could trigger failure of the soil underneath a tower, causing it
to collapse and ripping down the lines. Power and communication failures due to landslides can create
problems for vulnerable populations and businesses.
Rail Lines—Similar to roads, rail lines are important for response and recovery operations after a
disaster. Landslides can block travel along the rail lines, which would become especially troublesome,
because it would not be as easy to detour a rail line as it is on a local road or highway. Many residents
rely on public transport to get to work around the county and into New York City, and a landslide event
could prevent travel to and from work.
Utilities – Water and sewer infrastructure may be impacted by mass movements of geological material
resulting in damages, as well as impacts to services.
Impact on the Economy
Geologic hazards can impose direct and indirect impacts on society. Direct costs include the actual damage
sustained by buildings, property, and infrastructure due to ground failure, which also threatens transportation
corridors, fuel and energy conduits, and communication lines (USGS 2020). Indirect costs, such as clean-up
costs, business interruption, loss of tax revenues, reduced property values, and loss of productivity may also
occur, but are difficult to measure.
DMA 2000 Hazard Mitigation Plan Update – Mercer County, New Jersey 4.3.7-14
MONTH 2021SECTION 4.3.6 - GEOLOGIC
Buildings susceptible to landslide events were summarized earlier in this section. Losses to these structures will
impact the local tax base and economy.
Impact on the Environment
A landslide or sinkhole/subsidence event will alter the landscape. In addition to changes in topography,
vegetation and wildlife habitats may be damaged or destroyed, forest productivity can decline, or massive
wasting and erosion of natural surfaces may occur causing soil and sediment runoff (USGS 2020). Soil and
sediment runoff can accumulate downslope potentially blocking waterways and roadways and impacting quality
of streams and other water bodies. Habitats stripped of fertile soils can delay the growth of new vegetation post-
landslide event.
Future Changes That May Impact Vulnerability
Understanding future changes that effect vulnerability in the County can assist in planning for future
development and ensure establishment of appropriate mitigation, planning, and preparedness measures. The
County considered the following factors to examine potential conditions that may affect hazard vulnerability:
• Potential or projected development
• Projected changes in population
• Other identified conditions as relevant and appropriate, including the impacts of climate change
Projected Development
Any areas of growth could be potentially impacted by the geologic hazard if located within the identified
hazard areas or downslope. In general, development of slopes is not recommended due to the increased risk of
erosion, stormwater runoff and flooding potential. The additional runoff results in sedimentation of down slope
surface waters, which damages habitat and has the potential to damage property.
Individual municipalities such as Princeton have a model steep slope ordinance to regulate the intensity and use
in areas of steep slope terrain in order to limit soil loss, erosion, excessive stormwater runoff, excessive removal
of vegetation, the degradation of surface water and to maintain the natural topography of land and continuing
replenishment of groundwater resources.
Projected Changes in Population
Mercer County’s population has increased since 2010. According to the U.S. Census Bureau, the County’s
population increased 0.4-percent between 2010 and 2019 (U.S. Census Bureau 2020). Although the population
change is less than 1-percent, changes in density can not only create issues for local residents during evacuation
of a landslide or ground failure event but can also have an effect on commuters that travel into and out of the
County for work, particularly during a geologic event that breaches major transportation corridors, which are
also major commuter roads.
Climate Change
A direct impact of climate change on landslides is difficult to determine. Multiple secondary effects of climate
change have the potential to increase the likelihood of landslides. Warming temperatures resulting in wildfires
would reduce vegetative cover along steep slopes and destabilize the soils due to destruction of the root system;
increased intensity of rainfall events would increase saturation of soils on steep slopes. Under these future
conditions, the County’s assets located on or at the base of these steep slopes will have an increased risk to
landslides. Roadways and other transportation infrastructure located in these areas will also be at an increased
risk of closure, which would impact the County’s risk as described above.
DMA 2000 Hazard Mitigation Plan Update – Mercer County, New Jersey 4.3.7-15
MONTH 2021SECTION 4.3.6 - GEOLOGIC
Higher temperatures and the possibility of more intense, less frequent summer rainfall may lead to changes in
water resource availability. Increase in average temperatures may lead to an increase in the frequency of
droughts. Sinkhole activity intensifies in some karst areas during periods of drought. With an increase in drought
periods, the number of sinkholes could increase. Additionally, changes to the water balance of an area including
over-withdrawal of groundwater, diverting surface water from a large area and concentrating it in a single point,
artificially creating ponds of surface water, and drilling new water wells will cause sinkholes. These actions can
also serve to accelerate the natural processes of bedrock degradation, which can have a direct impact on sinkhole
creation.
Vulnerability Changes Since the 2016 HMP
The 2021 updated HMP references an updated building stock and critical facility data to assess the County’s risk
to the geologic hazard areas. The building inventory was updated using RS Means 2021 values, which is more
current and reflects replacement cost versus the building stock improvement values reported in the 2016 HMP.
Further, the 2019 5-year population estimates from the ACS were used to evaluate the population exposed to the
geologic hazard areas. Additionally, the 2019 geologic bedrock layer from NJDEP and the 2014/2015 USGS
digital elevation model were referenced to assess the County’s assets to the geologic hazard.
Overall, changes in population, development and climate did not change the County’s vulnerability to the
geologic hazard. The County remains vulnerable to the geologic hazard.
DMA 2000 Hazard Mitigation Plan Update – Mercer County, New Jersey 4.3.7-16
MONTH 2021You can also read