4Q19 Earnings Call Presentation - January 29, 2020
←
→
Page content transcription
If your browser does not render page correctly, please read the page content below
4Q19 Earnings Call Presentation
        January 29, 2020
Forward Looking Statements
This presentation contains forward-looking statements made pursuant to the Safe Harbor Provisions of the Private
Securities Litigation Reform Act of 1995. Forward-looking statements involve a number of risks, uncertainties or other
factors beyond the company’s control, which may cause material differences in actual results, performance or other
expectations. These factors include, but are not limited to, general economic conditions, disruptions or reductions in
travel, as well as in our operations, due to natural or man-made disasters, pandemics, epidemics, or outbreaks of
infectious or contagious diseases such as the coronavirus originating in Wuhan, China, new development, construction
and ventures, government regulation, risks relating to our gaming licenses and subconcession, fluctuations in currency
exchange rates and interest rates, substantial leverage and debt service, gaming promoters, competition, tax law changes,
infrastructure in Macao, political instability, civil unrest, terrorist acts or war, legalization of gaming, insurance, our
subsidiaries’ ability to make distribution payments to us, and other factors detailed in the reports filed by Las Vegas Sands
with the Securities and Exchange Commission. Readers are cautioned not to place undue reliance on these forward-
looking statements, which speak only as of the date thereof. Las Vegas Sands assumes no obligation to update such
information.

Within this presentation, the company may make reference to certain non-GAAP financial measures including “adjusted
net income,” “adjusted earnings per diluted share,” and “consolidated adjusted property EBITDA,” which have directly
comparable financial measures presented in accordance with accounting principles generally accepted in the United
States of America ("GAAP"), along with “adjusted property EBITDA margin,” “hold-normalized adjusted property EBITDA,”
“hold-normalized adjusted property EBITDA margin,” “hold-normalized adjusted net income,” and “hold-normalized
adjusted earnings per diluted share,” as well as presenting these or other items on a constant currency basis. The specific
reasons why the company’s management believes the presentation of each of these non-GAAP financial measures
provides useful information to investors regarding Las Vegas Sands’ financial condition, results of operations and cash
flows, as well as reconciliations of the non-GAAP measures to the most directly comparable GAAP measures, are included
in the company’s Form 8-K dated January 29, 2020, which is available on the company’s website at www.sands.com.
Reconciliations also are available in the Reconciliation of Non-GAAP Measures and Other Financial Information section of
this presentation.

                                                                                                                                2
The Investment Case for Las Vegas Sands
The global leader in Integrated Resort development and operation
A unique MICE-based business model delivering industry-leading returns
Unmatched development and operating track record creates competitive advantage as we
pursue the world’s most promising Integrated Resort development opportunities
Proven history of delivering innovative growth in Asia
Industry-leading, investment grade balance sheet strength
Demonstrated commitment to maximizing shareholder returns
The industry’s most experienced leadership team: visionary, disciplined and dedicated to driving
long-term shareholder value
Maximizing Return to Shareholders by:
1. Delivering growth in current markets through investments in capacity expansion and strong
reinvestment in industry-leading property portfolio
2. Leveraging proven MICE-based Integrated Resort business model and balance sheet strength to
pursue global growth opportunities in new markets
3. Continuing to increase the return of capital to shareholders
3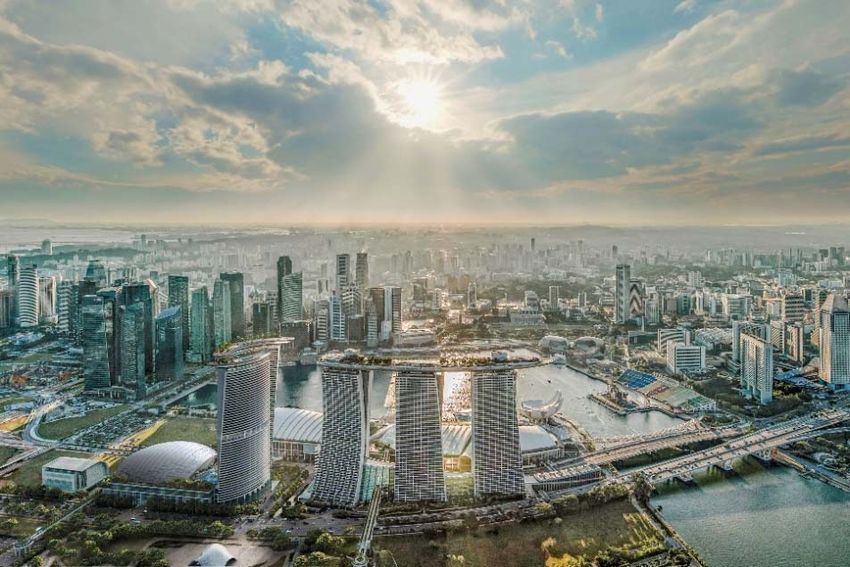
Fourth Quarter 2019 Highlights
Macao Property Portfolio:
− Mass market win grew 3.3% reaching a 4Q record $1.63 billion
− Delivered $811 million of Adjusted Property EBITDA ($781 million on a hold-normalized basis)
− The above results were delivered despite a decrease in visitation to the market of 8% from Mainland China
Marina Bay Sands:
− Delivered $457 million of Adjusted Property EBITDA ($408 million on a hold-normalized basis)
Las Vegas delivered $120 million of Adjusted Property EBITDA
The Company returned $888 million of capital to shareholders through $588 million of dividends ($0.77 per share) and
$300 million of repurchases (4.7 million shares at $64.07)
Macao – Mass and Non-Gaming revenue growth…Implementing $2.2 billion investment program, featuring
expansion of premium suite capacity by ~two million SF, to drive future growth
Singapore – Delivered $457 million in Adjusted Property EBITDA…with $3.3 billion Marina Bay Sands
Expansion ahead to drive future growth
Pursuing New Development Opportunities while increasing Return of Capital to Shareholders
Note: The company completed the sale of Sands Bethlehem on May 31, 2019.
4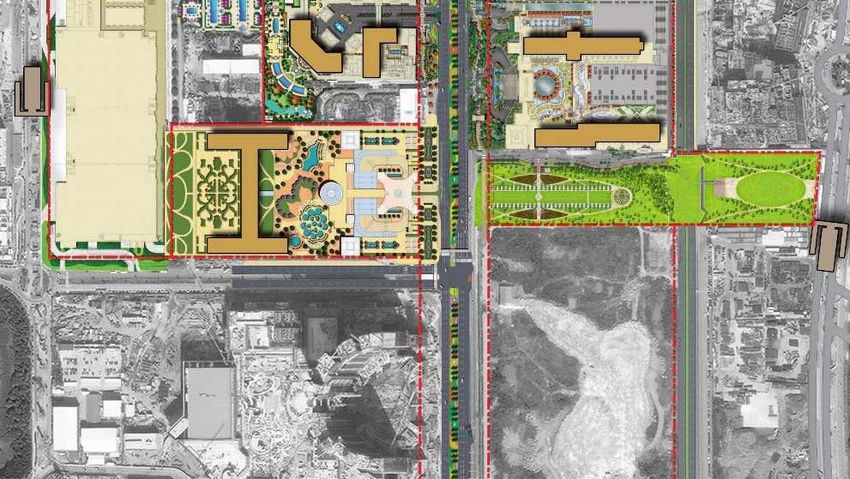
Geographically Diverse Sources of EBITDA
EBITDA Contribution by Geography in 4Q 2019
($ in US millions)

         LVS Consolidated Adjusted Property EBITDA1                                                                       LVS Consolidated Hold-Normalized Adj. Prop. EBITDA1

                                              $1,388M                                                                                                                   $1,309M

             Las Vegas                                                                                                                    Las Vegas
                9%                                                                                                                           9%

                                                                                                                                                  Singapore
                                                                                                                                                     31%
                         Singapore
                            33%                                   Macao
                                                                                                                                                                                          Macao
                                                                   58%
                                                                                                                                                                                           60%

1. The Macao region includes adjusted property EBITDA from The Venetian Macao, Sands Cotai Central, The Parisian Macao, The Plaza Macao and Four Seasons Hotel Macao, Sands Macao and Ferry Operations and Other. The Singapore region
   includes adjusted property EBITDA from Marina Bay Sands.

                                                                                                                                                                                                                                         5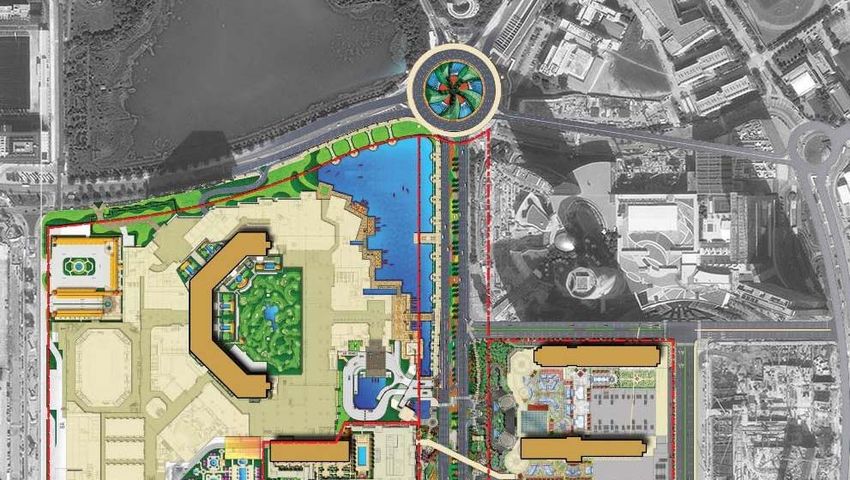
Geographically Diverse Sources of EBITDA
EBITDA Contribution by Geography in Trailing Twelve Months Ended December 31, 2019
($ in US millions)

                                                                        LVS Consolidated Adjusted Property EBITDA1

                                                                                                              $5,389M

                                                                                                       United
                                                                                                       States
                                                                                                        10%

                                                                                    Singapore
                                                                                       31%
                                                                                                                                 Macao
                                                                                                                                  59%

1. The Macao region includes adjusted property EBITDA from The Venetian Macao, Sands Cotai Central, The Parisian Macao, The Plaza Macao and Four Seasons Hotel Macao, Sands Macao and Ferry Operations and Other. The Singapore region
   includes adjusted property EBITDA from Marina Bay Sands and the United States region includes adjusted property EBITDA from the Las Vegas Operating Properties and Sands Bethlehem.
Note: The company completed the sale of Sands Bethlehem on May 31, 2019, and $52 million of Adjusted Property EBITDA generated by Sands Bethlehem is included in the United States segment above for the period from January 1, 2019 to May
30, 2019.

                                                                                                                                                                                                                                              6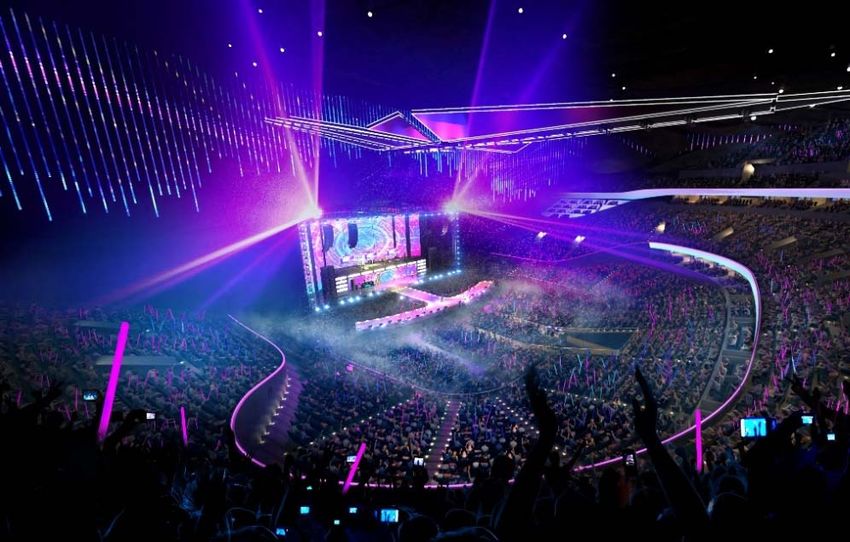
Fourth Quarter 2019 Financial Results
 Quarter Ended December 31, 2019 vs Quarter Ended December 31, 2018

    ($ in US millions, except per share information)
                                                                                                                 4Q18             4Q19    $ Change   % Change

    Net Revenue                                                                                              $3,475              $3,509      $34       1.0%
    Net Income (Loss)                                                                                             ($40) (1)       $783      $823        n/m
    Adjusted Net Income Attributable to LVS                                                                      $598             $678       $80      13.4%
    Adjusted Property EBITDA                                                                                 $1,272              $1,388     $116       9.1%
    Adjusted Property EBITDA Margin                                                                            36.6%              39.6%               300 bps
                                                                                                                           (2)
    Diluted EPS                                                                                               ($0.22)             $0.82    $1.04        n/m
    Adjusted Diluted EPS                                                                                       $0.77              $0.88    $0.11      14.3%
    Dividends per Common Share                                                                                 $0.75              $0.77    $0.02       2.7%
    Hold-Normalized :
           Adjusted Property EBITDA                                                                          $1,317              $1,309       ($8)     -0.6%
           Adjusted Property EBITDA Margin                                                                     37.3%              38.6%               130 bps
           Adjusted Diluted EPS                                                                                 $0.81             $0.80    ($0.01)     -1.2%

1. Includes $727 million nonrecurring non-cash income tax expense of U.S. tax reform.
2. Includes approximately $0.93 per share impact related to nonrecurring non-cash income tax expense of U.S. tax reform.
Note: The company completed the sale of Sands Bethlehem on May 31, 2019.

                                                                                                                                                                7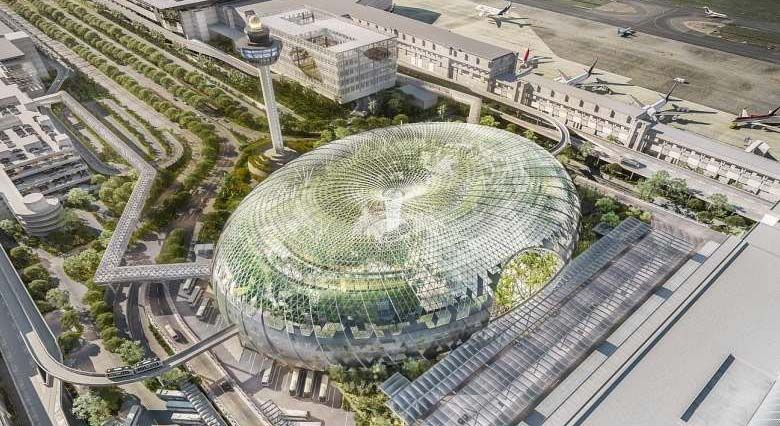
Strong Cash Flow, Balance Sheet and Liquidity
Investment Grade Balance Sheet Provides Flexibility for Future Growth Opportunities and Return of Capital
As of December 31, 2019: Trailing Twelve Months Ended December 31, 2019:
Cash Balance – $4.24 billion Cash Flow from Operations – $3.04 billion2
Debt1 – $12.48 billion Cash Flow from Operations excluding land premium payment
Net Debt1 – $8.23 billion for Marina Bay Sands Expansion – $4.00 billion
Net Debt1 to TTM EBITDA – 1.5x Adjusted Property EBITDA – $5.39 billion
LVS Dividends Paid – $2.37 billion; SCL Dividends Paid –
$616 million3
($ in US millions) Sands China U.S. LVS Corp. Total
Figures as of December 31, 2019 Ltd. Singapore Operations and Other Consolidated
Cash and Cash Equivalents4 $2,486 $404 $150 $1,201 $4,241
Debt 5,491 3,023 - 3,961 12,475
Net Debt (Cash) 3,005 2,619 (150) 2,760 8,234
5 6
Trailing Twelve Months Adjusted Property EBITDA 3,189 1,661 539 - 5,389
Gross Debt to TTM Adjusted Property EBITDA 1.7x 1.8x - - 2.3x
Net Debt to TTM Adjusted Property EBITDA 0.9x 1.6x - - 1.5x
Industry’s Strongest Balance Sheet and Cash Flow Create Ability to Reinvest in Current Portfolio, Return Capital to Shareholders and
Preserve The Flexibility to Make Investments in New Jurisdictions – Allows Potential Investments of $20 Billion or More in the Future
1. Debt balances shown here are net of deferred financing costs and original issue discounts of $137 million and exclude finance leases. SCL debt balance is net of a positive cumulative fair value adjustment of $35 million.
2. Includes the payment of $963 million made in April 2019 for the land premium related to the Marina Bay Sands Expansion.
3. Reflects only the public (non-LVS) portion of dividends paid by Sands China. Total dividends paid by Sands China in the TTM period ended December 31, 2019 were $2.05 billion.
4. Includes restricted cash of $16 million.
5. TTM Adjusted Property EBITDA for Sands China presented here reflects Adjusted Property EBITDA from our Macao Operations.
6. The company completed the sale of Sands Bethlehem on May 31, 2019, and $52 million of Adjusted Property EBITDA generated by Sands Bethlehem is included in the United States segment above for the period from January 1, 2019 to May 30, 2019.
8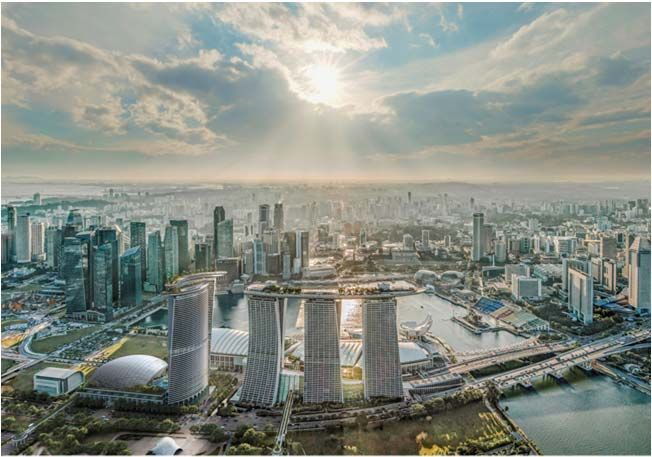
LVS Return of Capital to Shareholders
 $26.3 Billion of Capital Returned to Shareholders Since 2012

                                                                                Total Capital Returned to Shareholders

                      ($ in US millions)                                                                             Year Ended December 31,
                                                                        2012             2013              2014           2015     2016    2017       2018     2019     Total
                                                       1
                      LVS Dividends Paid                                  $823          $1,153           $1,610          $2,074   $2,290   $2,310     $2,352   $2,367   $14,979

                      LVS Special Dividend Paid                         2,262                 -                -            -        -          -        -        -       2,262
                      LVS Shares Repurchased                                -                570           1,665            205      -         375      905      754      4,474
                              Subtotal LVS                             $3,085           $1,723           $3,275          $2,279   $2,290   $2,685     $3,257   $3,121   $21,715
                                                       2
                      SCL Dividends Paid                                    357              411              538           619     619        619      615      616      4,394
                                                                  2
                      SCL Special Dividend Paid                             -                 -               239           -        -          -        -        -        239

                              Subtotal SCL                                $357             $411             $777           $619    $619        $619    $615     $616     $4,633

                      Total                                            $3,442           $2,134           $4,052          $2,898   $2,909   $3,304     $3,872   $3,737   $26,348

 LVS is Focused on Returning Capital to Shareholders While Maintaining a Strong Balance Sheet and the
 Financial Flexibility to Pursue Development Opportunities

1. Excludes dividends paid by Sands China and excludes the $2.75 per share special dividend paid in December 2012.
2. Reflects only the public (non-LVS) portion of dividends paid by Sands China.

                                                                                                                                                                                  9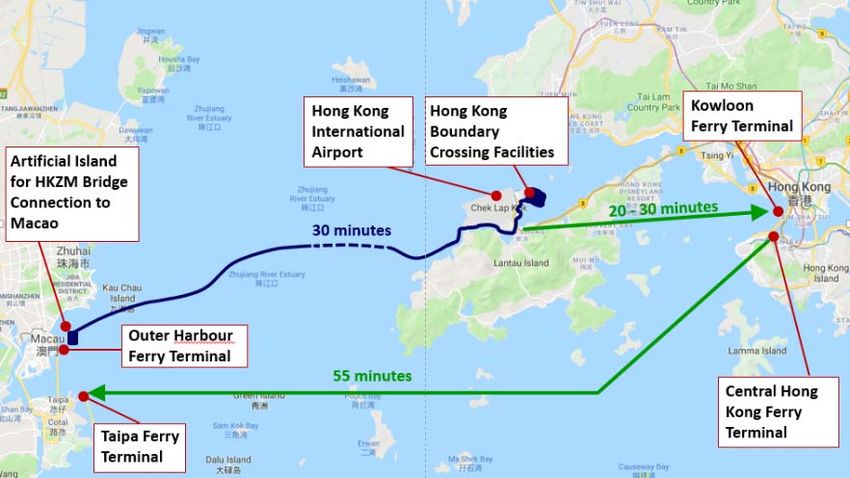
LVS Increasing Return of Capital to Shareholders
$26.3 Billion of Capital Returned to Shareholders Since 2012
LVS Recurring Dividends per Share1
$3.08 $3.16
$2.88 $2.92 $3.00
$2.60
$2.00
$1.40
$1.00
2012 2013 2014 2015 2016 2017 2018 2019 2020
Dividends Repurchases
The LVS Board of Directors announced the increase of the LVS On June 7, 2018, the LVS Board of Directors authorized an
recurring dividend for the 2020 calendar year by $0.08 to $3.16 per increase in LVS’ share repurchase program to $2.5 billion and
share ($0.79 per share payable quarterly) extended the expiration date to November 2, 2020
Las Vegas Sands is committed to maintaining its recurring dividend During the fourth quarter of 2019, $300 million of common stock
program and to increasing dividends in the future as cash flows was repurchased (4.7 million shares at a weighted average price of
grow $64.07 per share)
The company currently has $916 million available under its current
repurchase authorization
Since the inception of the company’s share repurchase program in
2013, the company has returned $4.47 billion to shareholders
through the repurchase of 69.1 million shares
LVS Remains Committed to Returning Capital Through Recurring Dividends and Share Repurchases
1. Excludes dividends paid by Sands China and excludes the $2.75 per share special dividend paid in December 2012.
10Macao Operations EBITDA Performance
Quarter Ended December 31, 2019 vs Quarter Ended December 31, 2018
Macao Operations Adjusted Property EBITDA and Adjusted Property EBITDA Margin
($ in US millions)
Adjusted Property EBITDA Hold-Normalized Adj. Prop. EBITDA
$900 60%
$800
$811 50%
$786 $786 $781
$700
$600 40%
$500 36.2% 35.8%
34.8% 34.8% 30%
$400
$300 20%
$200
10%
$100
$0 0%
4Q18 4Q19 4Q18 4Q19
Our Macao Property Portfolio Delivered $811 Million in Adjusted Property EBITDA During the Fourth Quarter
of 2019
11Macao Financial Performance
Quarter Ended December 31, 2019 vs Quarter Ended December 31, 2018
($ in US millions)
Net Revenue Adj. Property EBITDA Adj. Property EBITDA Margin
Growth Growth Growth
4Q18 4Q19 $ % 4Q18 4Q19 $ % 4Q18 4Q19 bps
T he Venetian Macao $919 $908 ($11) -1.2% $355 $368 $13 3.7% 38.6% 40.5% 190
Sands Cotai Central 558 505 (53) -9.5% 194 180 (14) -7.2% 34.8% 35.6% 80
T he Parisian Macao 414 401 (13) -3.1% 132 122 (10) -7.6% 31.9% 30.4% (150)
Four Seasons/Plaza Casino 175 246 71 40.6% 64 102 38 59.4% 36.6% 41.5% 490
Total Cotai 2,066 2,060 (6) -0.3% 745 772 27 3.6% 36.1% 37.5% 140
Sands Macao 156 150 (6) -3.8% 38 40 2 5.3% 24.4% 26.7% 230
Ferry Operations and Other 37 31 (6) -16.2% 3 (1) (4) -133.3% 8.1% -3.2% n/m
Total Macao 2,259 2,241 (18) -0.8% 786 811 25 3.2% 34.8% 36.2% 140
Adjusted Property EBITDA Margins at Our Macao Portfolio Grew 140 bps Year-Over-Year
in 4Q19 to Reach 36.2%
12Macao Financial Performance
Year Ended December 31, 2019 vs Year Ended December 31, 2018
($ in US millions)
Net Revenue Adj. Property EBITDA Adj. Property EBITDA Margin
Growth Growth Growth
FY18 FY19 $ % FY18 FY19 $ % FY18 FY19 bps
The Venetian Macao $3,474 $3,510 $36 1.0% $1,378 $1,407 $29 2.1% 39.7% 40.1% 40
Sands Cotai Central 2,153 2,052 (101) -4.7% 759 726 (33) -4.3% 35.3% 35.4% 10
The Parisian Macao 1,533 1,650 117 7.6% 484 544 60 12.4% 31.6% 33.0% 140
Four Seasons/Plaza Casino 719 877 158 22.0% 262 345 83 31.7% 36.4% 39.3% 290
Total Cotai 7,879 8,089 210 2.7% 2,883 3,022 139 4.8% 36.6% 37.4% 80
Sands Macao 650 628 (22) -3.4% 178 175 (3) -1.7% 27.4% 27.9% 50
Ferry Operations and Other 160 117 (43) -26.9% 18 (8) (26) -144.4% 11.3% -6.8% n/m
Total Macao 8,689 8,834 145 1.7% 3,079 3,189 110 3.6% 35.4% 36.1% 70
Adjusted Property EBITDA Margins at Our Macao Portfolio Grew 70 bps Year-Over-Year
in 2019 to Reach 36.1%
13Sands China Mass Market Table Update
SCL Base Mass Table Win by Quarter SCL Premium Mass Table Win by Quarter
Sands China Departmental Profit Margin: 35% - 45% Sands China Departmental Profit Margin: 25% - 40%
($ in US millions) ($ in US millions)
$1,000 Avg. Win per Table per Day: $1,000 Avg. Win per Table per Day:
$8,999 $15,745
$900 $900
$800 $800
$789 $774
$700 $745 $756 $762 $700
$725
All-time
$693 $674 $675
$600 Record $600 $635
$500 $500
$400 $400
$300 $300
$200 $200
$100 $100
$0 $0
4Q18 1Q19 2Q19 3Q19 4Q19 4Q18 1Q19 2Q19 3Q19 4Q19
Avg. Avg.
Tables
976 961 962 956 953 Tables
439 446 448 450 466
Mass Market Table Win Grew 3.2% to Reach a Fourth Quarter Record $1.46 Billion, Driven by Continuing
Growth in the Base Segment, Reaching Record Levels
Note: Sands China’s base mass and premium mass table revenues as presented above are based on the geographic position of non-rolling (mass) tables on the gaming floor. Some high-end mass play occurs in the base mass
geographic area.
14Sands China Mass Market Table and Slots Delivered 3.3% Growth
SCL Mass Table(1) Win by Quarter SCL Slots(2) Win by Quarter
Avg. Win per Table per Day: $11,214 Avg. Win per Unit per Day: $295
($ in US millions) ($ in US millions)
$1,800 $200
$1,600 $180
$1,400
$1,519 $160
$1,418 $1,436 $1,464 $162 $160 $161
$1,391 $155 $154
$140
$1,200
Fourth
Quarter $120
$1,000 Record
$100
$800
$80
$600
$60
$400 $40
$200 $20
$0 $0
4Q18 1Q19 2Q19 3Q19 4Q19 4Q18 1Q19 2Q19 3Q19 4Q19
Avg. Avg.
1,415 1,407 1,410 1,406 1,419 5,241 5,827 5,840 6,039 5,932
Tables Units
Total Mass Market Delivered 3.3% Growth to Reach Fourth Quarter Record $1.63 Billion, Driven by Mass
Tables and Slots Segments
(1) Excludes rolling play.
(2) Includes slots and electronic table games.
15Growing Visitation from China to Macao1
Visitation from China Increased 11% to 27.9 Million in the Twelve Months Ended December 2019
Year-Over-Year Visitation Growth from China Visitation from China to Macao1
Twelve Months Ended December 31, Population GDP Per Penetration
Province 2018 2019 % Change (MM) Capita (US$) Rate
Guangdong 10,516,328 12,816,693 +22% 113 $12,951 11.3%
Hunan 1,192,747 1,124,039 -6% 69 $7,976 1.6%
Fujian 924,812 930,098 +1% 39 $13,724 2.4%
Hubei 869,324 923,470 +6% 59 $10,050 1.6%
Guangxi 828,549 857,665 +4% 49 $6,241 1.7%
Zhejiang 787,803 788,762 +0% 57 $14,797 1.4%
Jiangsu 704,008 782,876 +11% 81 $17,373 1.0%
Shanghai 687,316 721,783 +5% 24 $20,365 3.0%
Sichuan 503,587 551,978 +10% 83 $7,367 0.7%
Henan 558,461 510,004 -9% 96 $7,558 0.5%
Jiangxi 538,586 475,038 -12% 46 $7,145 1.0%
Beijing 382,387 390,491 +2% 22 $21,263 1.8%
Anhui 308,515 297,621 -4% 63 $7,168 0.5%
Chongqing 290,678 286,400 -1% 31 $9,916 0.9%
Liaoning 345,971 285,475 -17% 44 $8,773 0.7%
Heilongjiang 331,528 277,815 -16% 38 $6,551 0.7%
Shandong 333,013 277,442 -17% 100 $11,497 0.3%
Hebei 274,771 238,581 -13% 76 $7,199 0.3%
Shaanxi 224,295 213,667 -5% 39 $9,554 0.6%
Jilin 252,994 204,507 -19% 27 $8,421 0.8%
Tianjin 135,569 124,620 -8% 16 $18,214 0.8%
All Other Provinces 4,269,314 4,844,194 +13% 224 N/A 2.2%
> 10% 0% - ≤10% < 0% - ≥ -10% < -10% Subtotal (Excluding
14,744,228 15,106,526 +2% 1,283 $9,624 1.2%
Guangdong)
Data not available
Total China 25,260,556 27,923,219 +11% 1,397 $9,894 2.0%
(1) Visitation figures shown exclude visitation from Hong Kong SAR.
Note: Penetration rates assume that each visitor to Macao is a unique visitor. GDP per Capita defined as 2018 GDP divided by 2018 population (the latest data available).
Source: Macao DSEC (Statistics and Census Service of the Macao Government) statistical database, National Bureau of Statistics of China.
16Visitation from China to Macao1
Visitation from China Decreased 8% to 6.5 Million in the Three Months Ended December 2019
Year-Over-Year Visitation Growth from China Visitation from China to Macao1
Three Months Ended December 31, Population GDP Per Penetration
Province 2018 2019 % Change (MM) Capita (US$) Rate
Guangdong 2,890,839 3,424,123 +18% 113 $12,951 3.0%
Fujian 269,457 211,950 -21% 39 $13,724 0.5%
Hunan 347,736 196,448 -44% 69 $7,976 0.3%
Hubei 252,366 179,563 -29% 59 $10,050 0.3%
Shanghai 179,756 150,900 -16% 24 $20,365 0.6%
Zhejiang 216,444 150,337 -31% 57 $14,797 0.3%
Guangxi 270,268 146,918 -46% 49 $6,241 0.3%
Jiangsu 198,605 144,128 -27% 81 $17,373 0.2%
Henan 153,636 91,223 -41% 96 $7,558 0.1%
Beijing 106,039 88,530 -17% 22 $21,263 0.4%
Sichuan 157,393 88,456 -44% 83 $7,367 0.1%
Jiangxi 136,528 78,846 -42% 46 $7,145 0.2%
Anhui 90,829 51,719 -43% 63 $7,168 0.1%
Liaoning 98,548 51,004 -48% 44 $8,773 0.1%
Shandong 100,654 48,052 -52% 100 $11,497 0.0%
Chongqing 83,365 43,886 -47% 31 $9,916 0.1%
Hebei 77,521 42,635 -45% 76 $7,199 0.1%
Heilongjiang 92,297 40,210 -56% 38 $6,551 0.1%
Shaanxi 68,346 35,210 -48% 39 $9,554 0.1%
Jilin 72,880 28,402 -61% 27 $8,421 0.1%
Tianjin 36,454 23,693 -35% 16 $18,214 0.2%
All Other Provinces 1,139,440 1,151,692 +1% 224 N/A 0.5%
> 10% 0% - ≤10% < 0% - ≥ -10% < -10% Subtotal (Excluding
4,148,562 3,043,802 -27% 1,283 $9,624 0.2%
Guangdong)
Data not available
Total China 7,039,401 6,467,925 -8% 1,397 $9,894 0.5%
(1) Visitation figures shown exclude visitation from Hong Kong SAR.
Note: Penetration rates assume that each visitor to Macao is a unique visitor. GDP per Capita defined as 2018 GDP divided by 2018 population (the latest data available).
Source: Macao DSEC (Statistics and Census Service of the Macao Government) statistical database, National Bureau of Statistics of China.
17Macao Market: Increasing Mass Gaming Revenue
Macao Market Mass Gaming Revenue
($ in US millions) 1
Mass Win (Tables and Slots)
Q1 Q2 Q3 Q4 Total
2016 $3,609 $3,508 $3,816 $3,989 $14,922
2017 $4,146 $4,017 $4,169 $4,706 $17,038
Growth ('17 v '16) 14.9% 14.5% 9.3% 18.0% 14.2%
2018 $4,955 $4,841 $4,864 $5,251 $19,911
Growth ('18 v '17) 19.5% 20.5% 16.7% 11.6% 16.9%
2019 $5,440 $5,356 $5,523 $5,618 2 $21,937
2
Growth ('19 v '18) 9.8% 10.6% 13.5% 7.0% 10.2%
The Macao Market’s High-Margin Mass Gaming Segment Continues to Grow
1. Market-wide mass GGR for all periods through 3Q19 is defined as mass win (tables and slots) as reported by the casino operators in their public filings (does not include revenue from Galaxy’s City Clubs business). All figures reported in Hong Kong
dollars have been converted to USD using a 7.75 exchange rate.
2. Market-wide mass GGR for 4Q19 is estimated by LVS management based on DICJ reported data and LVS management’s estimated differences between DICJ reporting and win reported by operators in public filings.
Source: Public company filings, Macao DICJ.
18Macao Market: Continued Growth in High Margin
Mass Gaming Segment
Macao Market Mass Gaming Revenue (Tables & Slots) & Mass Win-per-Visit1
($ US in millions)
$6,000 $1,400
$5,618
$5,440 $5,523
$5,500 $5,356
$5,251 $1,200
$4,955
$5,000 $4,864
$4,841
$4,706 $1,000
$4,589
$4,500 $4,449 $4,419
$4,169 Record
$4,146 $800
Win per
$3,989 $4,017
$3,919 Visit
$4,000
$3,816 $610
$597 $3,682 $580 $586
$3,408 $3,589 $3,609 $3,508 $540 $526 $540 $557 $600
$536 $3,497 $527 $522 $536 $525
$490 $497 $484 $480 $494 $504
$3,500 $586 $464 $471
$457
$432
$400
$3,000
$200
$2,500
$2,000 $0
1Q14 2Q14 3Q14 4Q14 1Q15 2Q15 3Q15 4Q15 1Q16 2Q16 3Q16 4Q16 1Q17 2Q17 3Q17 4Q17 1Q18 2Q18 3Q18 4Q18 1Q19 2Q19 3Q19 4Q19
Mass Win (Tables & Slots) Mass Win per Visit
We Estimate Macao Market-Wide Mass Win Increased Approximately 7% in 4Q19
1. Market-wide mass GGR for all periods through 3Q19 is defined as mass win (tables and slots) as reported by the casino operators in their public filings (does not include revenue from Galaxy’s City Clubs business). All figures reported in Hong Kong
dollars have been converted to USD using a 7.75 exchange rate. Market-wide mass GGR for 4Q19 is estimated by LVS management based on DICJ reported data and LVS management’s estimated differences between DICJ reporting and win
reported by operators in public filings.
Source: Public company filings, Macao DSEC, Macao DICJ, Macao Public Security Police.
.
19Sands China Departmental Profit Contribution Is Diversified and Stable
Sands China Departmental Profit Contribution1
TTM 4Q18 TTM 4Q19
VIP VIP
9% Other 7%
Other 2%
4%
Mall
12%
Mall
12%
Mass
Tables Hotel
Mass
54% 14%
Hotel Tables
15% 58%
Slots
Slots 7%
6%
Mass Tables / Slots and Non-Gaming Generated 93% of Sands China’s Departmental Profit in TTM 4Q19
1. Represents departmental profit from The Venetian Macao, Sands Cotai Central, The Parisian Macao, The Plaza Macao and Four Seasons Hotel Macao, Sands Macao and Ferry Operations and Other (before unallocated expenses) for the TTM
periods ended December 31, 2019 and 2018.
20Ongoing Strategic Reinvestment in Our Market-Leading
Macao Portfolio
Estimated Spend Expected Timeframe
The Londoner Macao:
• Renovation, expansion and rebranding of SCC to ~$1.35B Commencement in 2019 – phased to minimize
The Londoner Macao disruption during peak periods
• Phased completion throughout 2020 and 2021
New Luxurious Hotel Towers:
• Grand Suites at Four Seasons Macao Expand suite ~$450M • Three gaming salons opened in tower late
inventory with approximately 290 new luxury suites, ranging September 2019
in size from 2,000 to 4,700 SF; introduction of three luxurious • Suite simulations now in progress
gaming salons (~1 million SF in new suite product)
• Grand opening expected in first half of 2020
• The Londoner Tower Suites Approximately 370 new luxury ~$400M Work is progressing – anticipated completion in
suites ranging in size from 1,400 to 3,100 SF (~1 million SF in late 2020
new suite product)
Total Spend: Londoner, The Londoner Tower Suites and
Grand Suites at Four Seasons Macao ~$2.2B
Other Projects:
The Parisian Macao Creating additional luxury suites Phases I, II and III completed
The Venetian Macao VIP and premium mass gaming areas expanded Work is progressing – phased completion throughout
and refurbished 2020
The Plaza Macao VIP gaming areas expanded and refurbished Work is completed
Investments Targeted to Drive Growth in Every Segment of the Macao Market: Retail, Entertainment, Hotel
and Both Mass and VIP Gaming
21Sands China
Continued Expansion of Market-Leading Cotai Strip Property Portfolio
LVS’ Cotai Strip Properties Leadership in Macao
Investment
Grand Suites at Four
Seasons Macao St. Regis Hotel ~$13 billion today, ~$15 billion by 2021
~290 Suites 400 Suites
Approximately 30 million square feet of interconnected facilities on Cotai
The Londoner Tower Hotel Inventory
The Venetian Macao Suites
2,905 Suites ~370 Suites ~12,000 rooms and luxury suites
~49% of hotel inventory on Cotai
C Retail
O ~1.9 million square feet of gross leasable retail
T Conrad
Revenue of $527 million as of TTM 4Q19
A
659 Rooms
& Suites
Entertainment
I The Macao leader in entertainment – more seats, shows and venues than any
Four Seasons Londoner other operator
Macao Hotel
360 Suites 600 Suites The Cotai Arena is the largest, most important entertainment venue in Macao,
S featuring 15,000 seats
Paiza Sheraton
Mansions
T MICE
3,968 Rooms
19 Suites & Suites
R The Macao leader in convention and group meetings
I ~80% of all MICE square footage in Macao is owned and operated by Sands
P China
Reinvestment
~290 new suites in the Grand Suites at Four Seasons Macao by 1H20
The Parisian Macao Tropical Gardens (~1 million SF in new suite product)
2,541 Rooms &
Suites ~370 new suites in The Londoner Tower Suites in late 2020
(~1 million SF in new suite product)
The re-themed Londoner Macao will provide a third European-themed iconic
destination resort on Cotai with additional MICE, retail, entertainment and
luxurious suite offerings upon completion of its planned opening in phases
New Luxury Suites Suite Conversion1
throughout 2020 and 2021
1. Upon completion, The Londoner hotel will feature approximately 600 suites.
22Market Leading Hotel Capacity
SCL is the Clear Leader in Macao Hotel Room and Suite Inventory
Projected Macao Market 4/5 Star Hotel Rooms at December 31, 20201 – Gaming Operators
Cotai ~ 25,000 Rooms by Gaming Operators Total Macao ~ 28,500 Rooms by Gaming Operators
MGM 12,112 Rooms and MGM 12,401 Rooms and
Wynn China Suites at SCL China Suites at SCL
Macau 6% Wynn 7%
6% Macau
9%
SJM
8% SJM
Sands Sands
10%
China China
Melco
49% 44%
15%
Melco
14%
Galaxy Galaxy
16% 16%
With a Market-Leading ~US$15 Billion of Investment by 2020, SCL Hotel Inventory is Forecast to Represent
~44% of Gaming Operator Hotel Rooms and ~49% of Hotel Rooms on Cotai
1. See slide 65 titled ‘Market-Leading Hotel Capacity at SCL’ for further detail.
Source: Public company filings, Macao DSEC, Macao Tourism Board.
23Macao Market
Adjusted Property EBITDA Market Share by Operator
Historical Adjusted Property EBITDA Market Share1
Sands China2 All Others
Macao Leader in Market Share of EBITDA MGM3 Melco
Wynn Galaxy3
SJM
40% 80%
72%
34% 66%
10%
60% 8%
30% 28%
16%
15%
20% 40% 14% 5%
15%
14%
10% 20%
18% 23%
0% 0% 4
2012 TTM 3Q19 2012 TTM 3Q19
Sands China Generated 34% of Macao Market EBITDA for the Twelve Months Ended September 30, 2019
1. Reflects reported adjusted property EBITDA for the six concessionaires and sub-concessionaires.
2. Reflects adjusted property EBITDA from The Venetian Macao, Sands Cotai Central, The Parisian Macao, The Plaza Macao and Four Seasons Hotel Macao, Sands Macao and Ferry Operations & Other.
3. Galaxy only includes EBITDA from Starworld, Galaxy Macau and Broadway Macau. MGM reflects Adjusted EBITDA (excluding royalty fees) from MGM Macau and MGM Cotai as reported by MGM Resorts.
4. Sum of individual rounded competitor concessionaire market share percentages may not add to total rounded competitor market share percentage.
Source: company reports.
24Marina Bay Sands
$457 Million of Adjusted Property EBITDA in 4Q19
Adjusted Property EBITDA
and Adjusted Property EBITDA Margin
Adjusted property EBITDA increased 26.2% to $457 million ($ in US millions)
Actual Hold-Normalized
Hold-normalized adjusted property EBITDA increased 6.8% to $600 80%
$408 million $500 $457 70%
$382 $408
Mass (non-Rolling tables and slots) win-per-day of $4.75 million $400 $362 60%
$300 53.6% 50%
─ Non-Rolling table win: $270 million 49.9% 50.9% 51.5%
$200 40%
─ Slot win: $167 million $100 30%
$0 20%
Mass table hold increased 0.2 pts to 22.0% from 21.8% 4Q18 4Q19 4Q18 4Q19
Non-Rolling Table and Slot Win Per Day
ADR grew 6.4% to $450, while occupancy increased 1.8 pts to
($ in US millions)
97.3%
$6.0
Rolling volume increased 16.0% to $7.92 billion; Rolling win % $4.68 $4.75
was 3.93% in 4Q19 compared to 2.79% in the prior-year quarter $4.0 $1.70 $1.82
$2.0 Slot Machines
$2.98 $2.93
Non-Rolling
Tables
$0.0
4Q18 4Q19
Continued Strength in Foreign Visitation and Spending Contributing to $457 million in Adjusted Property
EBITDA
25Marina Bay Sands
Diversified Sources of Departmental Profit
Marina Bay Sands Hold-Normalized1 Departmental Profit Contribution
TTM 4Q182 TTM 4Q192
VIP VIP
17% 18% Mass
Other Mass
Tables Other Tables
5%
33% 5% 32%
Mall
Mall
8%
8%
Hotel Slots Slots
21% Hotel 20%
16%
17%
Diversified Sources of Profit at Marina Bay Sands Continued to Generate Strong and Stable Cash Flow at
the Property
1. Hold-normalized figures reflect methodology implemented in 1Q19 whereby rolling win percentage will be normalized to 3.15% when falling outside of the 3.00% - 3.30% range.
2. With no adjustment for hold-normalization, VIP contribution would have been 20% (vs. 17%) in the TTM period ended December 31, 2018 and 20% (vs. 18%) in the TTM period ended December 31, 2019.
26Marina Bay Sands $3.3 Billion Expansion to Bring New
Luxurious Hotel, Entertainment, MICE and Retail Offerings
Las Vegas Sands has entered into a development agreement with the Singapore government to expand Marina Bay Sands
Iconic New Luxury Hotel Tower:
− Approximately 1,000 all-suite rooms designed to set a new standard of luxury in the region
− Sky roof with a swimming pool and other tourism attractions
State-of-the-art arena designed specifically for live musical performances; Seating for at least 15,000
Additional MICE capacity (meeting and function rooms, exhibition halls)
Luxury retail
Note: Images above denote preliminary artistic impressions which are subject to change.
27Our Integrated Resorts Are Designed to Maximize Economic Growth
and the Leisure & Business Tourism Appeal of our Host Markets
Contribution to Singapore’s Leisure & Business Tourism Appeal
MBS Existing Contributed to economic growth and to Singapore’s appeal as an exciting
global city
Delivered iconic architecture to Singapore’s CBD area
MBS is central to the MICE business in Singapore with record 2019 MICE
revenues. MBS hosted more than 3,000 events in 2018
Created thousands of jobs for Singaporeans (MBS employed >10,000
FTE’s in 2019)
Procurement and sourcing focused on Singapore-based SME’s
MBS Expansion Further enhance MBS’ status as an iconic architectural landmark
Provide suite product that is unparalleled in South East Asia
Introduce a ‘state-of-the-art’ theater designed for live musical
performances that can attract the highest-caliber global entertainment
events and artists to Singapore
Extend the success of Singapore as a MICE destination
Ensure MBS is positioned to grow its economic, employment and
visitation contributions to Singapore in the years ahead
Note: Images above denote preliminary artistic impressions which are subject to change.
28Retail Mall Portfolio in Asia Generates Strong Revenue and
Operating Profit
Trailing Twelve Months Retail Mall Revenue
($ in US millions)
$800 TTM 4Q19 Sales
$712 per Sq. Foot²
$682 $685 $689 $696
$700
$185 MBS
$600 $179 $180 $180 $182 $2,062
Parisian Macao
$500 $52 $52 $53 $785
$56 $53 SCC
$72 $72 $70 $934
$400 $69 $71
Four Seasons
$142 $151 Luxury: $7,065
$300 $145 $145 $143 Other: $2,823
$200 Venetian
$1,709
$233 $236 $242 $248 $253
$100
$0
4Q18 1Q19 2Q19 3Q19 4Q19
Operating
$604M $608M $610M $618M $634M
Profit
Operating Profit
Margin 89% 89% 89% 89% 89%
The Venetian Macao Four Seasons Macao Sands Cotai Central1 The Parisian Macao Marina Bay Sands
1. At December 31, 2019, approximately 473,000 square feet of gross leasable area was occupied out of a total of up to approximately 600,000 square feet of retail mall space that will be featured at completion of all phases of Sands Cotai Central’s
renovation, rebranding and expansion to The Londoner Macao.
2. Tenant sales per square foot is the sum of reported comparable sales for the trailing 12 months divided by the comparable square footage for the same period. Only tenants that have occupied mall space for a minimum of 12 months are included
in the tenant sales per square foot calculation.
29Strong Retail Sales in Our Market-Leading Destination Retail
Portfolio in Asia
($ per Sq. Foot, Unless Otherwise Indicated) 2
4Q19 Sales per Sq. Ft.
GLA1 Occupancy %
(Sq. Ft) at Period End TTM 4Q19 TTM 3Q19 TTM 2Q19 TTM 1Q19 TTM 4Q18
The Shoppes at Marina Bay Sands 593,714 96.4% $2,062 $2,028 $1,945 $1,918 $1,898
Shoppes at Venetian 812,938 91.4% $1,709 $1,708 $1,688 $1,732 $1,746
Shoppes at Four Seasons
Luxury Retail 125,466 100.0% $7,065 $6,652 $6,247 $6,051 $5,836
Other Stores 116,959 89.7% $2,823 $2,687 $2,186 $2,123 $2,046
Shoppes at Cotai Central 525,222 90.1% $934 $966 $967 $880 $892
Shoppes at Parisian 295,920 86.2% $785 $688 $650 $640 $649
Retail Sales Continue to Grow Across Our Asian Retail Property Portfolio
1. Denotes gross leasable area.
2. Tenant sales per square foot reflect sales from tenants only after the tenant has been open for a period of 12 months.
30Capital Expenditures Expectations
Future Planned Investments Composed of Income Producing Projects and Maintenance
($ US in millions)
$3,000
LVS Capex Expectations
$2,400 $2,180
$1,725
$1,800 $1,550
$981
$1,375 $1,300
$175
$150 $900
$1,200 $949 $425
$837 $273 $375
$25 $800
$194 $211 $450
$396 $350 $325 $500
$600 $147 $240
$477 $450 $450 $500 $500 $500 $500 $500
$0
2017A 2018A 2019A 2020E 2021E 2022E 2023E 2024E
Development Timeline
Expansion, Renovation and Rebranding of SCC to The Londoner
Grand Suites at Four Seasons Macao
The Londoner Tower Suites
Marina Bay Sands Expansion Project
Marina Bay Sands Expansion Expansion, Renovation and Rebranding of SCC to The Londoner Grand Suites at Four Seasons Macao Pre-Opening
1
The Londoner Tower Suites The Parisian Macao St. Regis Hotel at SCC Investments in Current Properties and Other Maintenance Post-Opening
Future Capital Expenditures Focused on $5.5 billion of Projects to Expand and Enhance Our Industry-
Leading Property Portfolios in Macao and Singapore
1. Reflects investments that are designed to generate future income in our current property portfolio.
31Las Vegas Operations Update
Adjusted Property EBITDA of $120 million
Adjusted Property EBITDA
Adjusted property EBITDA was $120 million an increase of 20.0% and Adjusted Property EBITDA Margin
($ in US millions)
Hold-normalized adjusted property EBITDA Actual Hold-Normalized
+20.0% -4.0%
− Decreased 4.0% to $120 million $140 $125 40%
$120 $120
$120
− Margin decreased 220 basis points to 25.3% $100 30%
$100
Hotel room revenue grew 4.1% to $153 million $80 27.5%
25.3%
23.6% 25.3% 20%
− ADR increased 1.2% to $253, while occupancy increased 3.4 pts $60
to 94.5% $40 10%
$20
− RevPAR increased 4.8% to $239
$0 0%
Slot win increased 4.7% to $67 million 4Q18 4Q19 4Q18 4Q19
Table games drop increased 2.7% to $540 million, while win percentage Composition of Table Games Drop
increased 7.1 pts to 19.8% ($ in US millions)
$700
Most promising opportunities for future growth
$600 $540
$526
− Convention and group meeting business $500
$238
− Increase in room pricing $400 $256
$300 Non-Baccarat
− Entertainment and non-gaming offerings Baccarat
$200
$302
− Increase in premium play $100
$270
$0
4Q18 4Q19
In FY 2019 Las Vegas Delivered All-time Record EBITDA of $487 millon
32Disciplined Execution of Our Global Growth Strategy
Focused on the Most Promising Global Development Opportunities
Uniquely positioned to bring our unmatched track record and powerful convention-based business model to the world’s most
promising Integrated Resort development opportunities
Balance sheet strength designed to support future large-scale development projects, flexibility to support $20 billion of future investment
Development opportunity objectives:
− Target minimum of 20% return on total invested capital
− 25% - 35% of total project costs to be funded with equity (project financing to fund 65% - 75% of total project costs)
Principal Areas of Future Development Interest:
Macao Singapore Japan South Korea
33Appendices
Supplemental Data
Historical Hold-Normalized Adjusted Property EBITDA1
($ in US millions)
                                                            4Q17                 1Q18                 2Q18                 3Q18                4Q18                 1Q19                2Q19                  3Q19                4Q19
                        2
Macao Operations
     Reported                                                $730                $789                 $750                 $754                 $786                 $858                 $765                $755                 $811
     Hold-Normalized                                         $757                $767                 $730                 $754                 $786                 $835                 $744                $755                 $781

                        3
Marina Bay Sands
     Reported                                                $457                $541                 $368                 $419                 $362                 $423                 $346                $435                 $457
     Hold-Normalized                                         $407                $447                 $382                 $403                 $382                 $423                 $384                $387                 $408

Las Vegas Operations
     Reported                                                $114                $141                   $77                  $76                $100                 $138                 $136                  $93                $120
     Hold-Normalized                                         $114                $141                 $106                   $97                $125                 $131                 $146                $106                 $120

                       4
Sands Bethlehem
     Reported                                                 $34                  $29                  $30                  $33                  $24                 $33                  $19                      -                    -
     Hold-Normalized                                          $34                  $29                  $30                  $33                  $24                 $33                  $19                      -                    -

LVS Consolidated
     Reported                                             $1,335               $1,500               $1,225               $1,282               $1,272              $1,452               $1,266               $1,283               $1,388
     Hold-Normalized                                      $1,312               $1,384               $1,248               $1,287               $1,317              $1,422               $1,293               $1,248               $1,309
1. This schedule presents hold-normalized adjusted property EBITDA based on the following methodology:
    - for Macao operations and Marina Bay Sands: if the quarter’s rolling win percentage is outside of the 3.00%-3.30% range, then a hold adjustment is calculated by applying a rolling win percentage of 3.15% to the rolling volume for the quarter.
    - for Las Vegas Operations: if the quarter’s baccarat win percentage is outside of the 18.0%-26.0% range, then a hold adjustment is calculated by applying a baccarat win percentage of 22.0%, and if the quarter’s non-baccarat win percentage is
      outside of the 16.0%-24.0% range, then a hold adjustment is calculated by applying a non-baccarat win percentage of 20.0%.
    - for Sands Bethlehem: no hold adjustment was made.
    - for all properties: gaming taxes, commissions paid, bad debt expense, discounts and other incentives are applied to determine the hold-normalized adjusted property EBITDA impact.
2. Adjusted property EBITDA presented here reflects adjusted property EBITDA from The Venetian Macao, Sands Cotai Central, The Parisian Macao, The Plaza Macao and Four Seasons Hotel Macao, Sands Macao and Ferry Operations and Other.
3. Denotes revised normalized rolling win percentage implemented in Q1 2019.
4. The company completed the sale of Sands Bethlehem on May 31, 2019. Results of operations include Sands Bethlehem through May 30, 2019.

                                                                                                                                                                                                                                                          36
Debt Maturity Profile
Debt Maturity by Year
($ in US millions)
$3,500 $3,321
$3,000 500
$2,670
$2,500
1,021
1,000
$2,000 $1,862 $1,889 $1,900
$1,500
$1,000 1,750 1,900
1,800 1,800 1,670 $750
$500
750
$62 $61 $62 $0
$0
2020 2021 2022 2023 2024 2025 2026 2027 2028 2029
% of
Total 1% 1% 1% 14% 15% 26% 21% 0% 15% 6%
MBS Credit Facility SCL Bonds LVS Bonds
Long Dated, Low Cost Capital Structure in Place
37Macao Market: VIP Gaming
Macao Market VIP Gaming Revenue
($ in US millions)
VIP Win1
Q1 Q2 Q3 Q4 Total
2016 $3,294 $2,856 $3,017 $3,516 $12,683
2017 $3,661 $3,734 $4,099 $4,292 $15,786
Growth ('17 v '16) 11.1% 30.7% 35.9% 22.1% 24.5%
2018 $4,429 $4,208 $4,288 $4,412 $17,337
Growth ('18 v '17) 21.0% 12.7% 4.6% 2.8% 9.8%
2019 $3,892 $3,640 $3,173 $3,231 2 $13,936
2
Growth ('19 v '18) -12.1% -13.5% -26.0% -26.8% -19.6%
The Macao VIP Market Continued to Decline in the Fourth Quarter of 2019
1. Market-wide VIP GGR for all periods through 3Q19 as reported by the casino operators in their public filings (does not include revenue from Galaxy’s City Clubs business). All figures reported in Hong Kong dollars have been converted to USD using
a 7.75 exchange rate.
2. Market-wide VIP GGR for 4Q19 is estimated by LVS management based on DICJ reported data and LVS management’s estimated differences between DICJ reporting and win reported by operators in public filings.
Source: Public company filings, Macao DICJ.
38Sands China VIP Table Update
SCL Rolling Volume by Quarter SCL Rolling Win by Quarter
($ in US billions) ($ in US millions, except per table amounts)
$1,000 Avg. Win per Table per Avg. Win per Table per
$25 Day: $28,384 Day: $23,622
$900
$20
$22.08 $800
$700
$692
$15 $600
$15.18
$500 $552
$10 $400
$300
$5 $200
$100
$0 $0
4Q18 4Q19 4Q18 4Q19
Avg. Rolling
265 254 Win %
3.13% 3.64%
Tables
Sands China Rolling Volume Declined ~31% in 4Q19
39Marina Bay Sands Expansion
Marina Bay Sands Expansion

A Development Agreement with The Singapore Tourism Board Will Allow an Expansion of Marina Bay Sands

                                                                                                       41
Marina Bay Sands Expansion
Artistic Impression
Design and Development Work are Progressing, with a Focus on Increasing the Leisure and Business
Tourism Appeal of Singapore and Marina Bay Sands
Note: Image above denotes preliminary artistic impression which is subject to change.
42Visitor Arrivals To Singapore
(000s)
20,000 Opening of Marina Bay
Sands and Resorts World
18,000 Sentosa, 2010 $18,508
$17,425
16,000 $16,403
$15,568 $15,231
$15,095
14,000 $14,496
$13,171
12,000
$11,642
10,000
$9,683
8,000
6,000
4,000
2,000
0
2009 2010 2011 2012 2013 2014 2015 2016 2017 2018
- Visitation to Singapore has Almost Doubled Since the Introduction of Integrated Resorts
- Following a Contraction in 2014, Visitation has Reaccelerated
- The CAGR for the Period from 2009 (Immediately Prior to IR Openings) to 2018 is 7.5%
Source: Singapore Tourism Board.
Note: Excludes visitor arrivals from Malaysia by land.
43Strong Growth in Chinese Inbound Tourism to Singapore
Singapore Inbound Tourism Arrivals from Largest Source Markets
2014-2018
CAGR +4.0% +3.6% +0.2% +0.7% +0.4% +11.2% 0.0% +18.7%
(in thousands)
4,000
China has been the fastest-growing market for visitation to Singapore, with a
CAGR of 19% over the last four years 3,418
3,500
3,025 3,021
3,000
2,500
2,000 1,722
1,442
1,500 1,233 1,254
1,075 1,107
944
1,000 778 825 830
629 676
537
500
-
South Korea Philipines Japan Australia Malaysia1 India Indonesia China
FY 2014 FY 2018
Visitors from China Dominate the Recent Growth in Tourism Arrivals, Compounding at ~19% Per Annum
Over the Last Four Years
1. Excludes visitor arrivals from Malaysia by land.
Source: Singapore Tourism Board.
44Retail Spending by Visitors to Singapore Has Increased
60% Since the Introduction of the Two Integrated Resorts
Singapore Shopping Tourism Receipts
($ in Singapore millions)
$7,000
$6,000 $6,172
$5,958
$5,385
$5,000
$4,489 $4,588 $4,553
$4,000 $4,116
$3,971 $3,913
$3,377
$3,000
$2,000
$1,000
$0
2009 2010 2011 2012 2013 2014 2015 2016 2017 2018
Source: Singapore Tourism Board.
45Changi Airport
Conveniently Connecting The World to Singapore
Overview
Singapore’s Changi Airport processed 65.6 million passenger movements in 2018, ranking it 19th Globally and 8th in Asia by that
measurement
Qualitative measures place it significantly higher – ranked World’s Best Airport in 2019 (Skytrax World Airport Awards) for seventh
consecutive year and for the tenth time overall
Changi currently services ~400 cities in ~100 countries
Future traffic growth estimated at least 3 – 4% per annum long-term and significant capacity increases are underway to facilitate
that additional traffic
Changi Airport
Recent Passenger Growth
Changi passenger movements in 2018 increased +5.5% versus 2017
2015 to 2018 CAGR rate in passenger movement is +5.8%
Most recent data for the first eleven months of 2019 reports growth of +4.1%
Changi is One of the World’s Largest Airports, an Important Asian Transportation Hub and a Strong
Contributor to Singapore’s Leisure and Business Tourism Appeal
46Changi Airport
Significant Development to Sustain Growth in Passenger Capacity
Recent Airport Expansion
Terminal 4 opened October 2017 and hosts nine airlines including Cathay Pacific, Korean Air, Air Asia and Vietnam Airlines
This has allowed these carriers to expand their operations as well as freeing up capacity in Terminals 1, 2 & 3
Terminal 4 capacity is 16 million passengers taking the total capacity to 82 million passenger movements
Changi Jewel opened in April 2019 – multi-use retail, hotel and F&B destination jointly developed by Changi Airport and CapitalLand;
Includes 280 shopping and dining outlets
Changi Airport – Layout of Existing Facilities and Proposed Future Developments Changi Jewel – Opened April 2019
Future Airport Expansion:
Runways: Work currently ongoing to expand from a two-runway to three-runway system. Completion anticipated early 2020’s
New ‘Mega-Terminal” known variously as Terminal 5 or Changi East will ultimately take passenger handling capacity from 82 million
to >130 million passengers by ~2030
In the longer-term, Terminal 5 could add a further 20 million passengers if justified by demand, taking capacity >80% higher than it is
today, even after the recent opening of Terminal 4
47Changi Airport - 38 Cities in China are Served by Direct
Flights to Singapore
Eighteen airlines fly direct services between Singapore Changi and cities in China
Air China Juneyao Airlines
Cathay Pacific Scoot
China Eastern Shenzhen Airlines
China Southern Sichuan Airlines
China West Airlines SilkAir
Guangxi Beibu Gulf Singapore Airlines
Hainan Airlines Spring Airlines
Hebei Airlines Urumqi Airlines
Jetstar Asia Xiamen Airlines
The following 38 cities in China are currently served by direct flights to/from Singapore
Beijing Haikou Kunming Qingdao Wuxi
Changsha Guiyang Lanzhou Quanzhou Xiamen
Changchun Hangzhou Zhongchuan Shanghai Xi’an
Chengdu Harbin Macao Shantou Xuzhou
Chongqing Hefei Nanchang Shenyang Yantai
Dalian Hohhot Nanning Shenzhen Yinchuan
Fuzhou Hong Kong Nanjing Tianjin Zhengzhou
Guangzhou Jinan Ningbo Wuhan
Prior to the Proposed Changi Terminal 5 Expansion China is Already Served by 18 Airline Operators with
Direct Flights to and from Singapore, to a Total of 38 Cities
48Marina Bay Sands
Changes in Casino Regulations
Casino Exclusivity
The Singapore government has announced a renewal of the exclusivity period for the casinos within the two Integrated
Resorts to the end of 2030
Singapore Casino Entry Levy Increase
The entry levy increased on April 4, 2019 by 50% to S$150 daily, or S$3,000 annually
Changes Specific to the Casino at Marina Bay Sands
Approval to develop the 55th floor of MBS’ hotel Tower 1, or other areas within Tower 1, to conduct casino gaming
Upon the achievement of certain milestones:
− Ability to operate up to 3,500 gaming machines (up from 2,500 previously)
− Option to purchase an additional 2,000 sq. meters of additional gaming area
49Marina Bay Sands
Changes in Casino Tax Rates Effective March 1, 2022
On March 1, 2022, a tiered casino tax system will go into effect. These tax rates will be in effect until at least February
2032
Casino Tax Rate Structure1
Mass Gaming
Mass Gaming Tax
Tax Rates
Rates:
Before March 1, 2022 After March 1, 2022
All GGR First S$3.1B GGR GGR>S$3.1B
15.0% 18.0% 22.0%
Premium Gaming
Premium Gaming Tax
Tax Rates
Rates:
Before March 1, 2022 After March 1, 2022
All GGR First S$2.4B GGR GGR>S$2.4B
5.0% 8.0% 12.0%
1. If the IR fails to meet its investment commitments, then a flat tax rate of 12% will apply on the entire amount of GGR from premium gaming, and a flat tax of 22% will apply on the entire amount of GGR from mass gaming.
50Macao Market Background and Infrastructure Slides
Market-Leading ~$15 Billion of Investment
Investing in Macao’s Future as a Leisure & Business Tourism Destination
Industry-Leading Integrated Resort Portfolio
− Portfolio of ~12,400 suites and hotel rooms
− Addition of ~2 million sq. feet of new luxurious hotel suite inventory in 2020
The Entertainment and Tourism Offerings of The Londoner Macao Will Be Introduced Throughout 2020 and 2021
Conference, Exhibition and Carpeted Meeting Space: ~Two Million sq. feet
World-Class Entertainment and Events
World Class Shopping: ~ 1.9 Million sq. feet
Our Diversified Convention-Based Integrated Resort Offerings Coupled with Industry Leading Branding and Service
Levels Appeal to the Broadest Set of Customers and Provide a Competitive Advantage in the Macao Market
52Macao Visitation Opportunity
Business & Leisure Tourism Expenditure Drivers
Future Growth Drivers As a result, Macao’s Mass visitors will
More efficient and affordable Come From Farther Away
transportation infrastructure
Stay Longer
Greater number of hotel rooms and
non-gaming offerings in Macao
Spend More On
Additional tourism attractions in − Lodging
− Retail
Macao and Hengqin Island
− Dining
− Entertainment
Rapidly expanding middle-class with − Gaming
growing disposable income and a
desire for tourism and travel
experiences
53In the Macao Market in Total… Mass Gaming Generates ~86%
of the Operating Profit Produced in the Gaming Segment
($ in US millions)
Total Gross Gaming Revenue1 in the Macao Market Total Estimated Operating Profit2 from Gaming in the Macao Market
Quarter Ended December 31, 2019: $8,849M Quarter Ended December 31, 2019: $2,570M
VIP
Gaming
VIP 13%
Gaming
37% Estimated
Mass Tables Operating Profit
Margin:
and Slots 29.0%
63% Mass Tables and
Slots
87%
Year Ended December 31, 2019: $35,874M Year Ended December 31, 2019: $10,168M
VIP
Gaming
VIP 14%
Gaming
Mass Tables 39% Estimated
Operating Profit
and Slots Margin:
28.3%
61% Mass Tables
and Slots
86%
Mass Tables and Slots VIP Gaming
1. Market-wide GGR for all periods through 3Q19 as reported by the casino operators in their public filings (does not include revenue from Galaxy’s City Clubs business). All figures reported in Hong Kong dollars have been converted to USD using a
7.75 exchange rate. Market-wide GGR for 4Q19 is estimated by LVS management based on DICJ reported data and LVS management’s estimated differences between DICJ reporting and win reported by operators in prior public filings.
2. Assumes operating profit margin of 10.0% on gross VIP revenue and a blended margin of 40% on mass table and slot gross revenue.
Source: Public company filings, Macao DICJ.
54Five Trends Supporting Growth
in the Macao Market in the Future
260 million tourists are expected to travel outside of China by 2025, up from 135
1 million in 2016. Chinese tourism expenditures are expected to increase from $261 billion
in 2016 to $672 billion by 2025
Transportation infrastructure and connectivity throughout China, especially in the
2 Pearl River Delta region, will be expanded, including through the $20 billion Hong
Kong – Zhuhai – Macao bridge, which opened on October 24, 2018
3 ~2,660 new hotel rooms are expected to open in Macao through 2020
4 Increasing length of stay in Macao
The Greater Bay Area Initiative and the development of Hengqin Island will contribute to
5 Macao’s diversification and to its further development as a leisure and business
tourism destination
Sources: Bernstein research, Haver, SAFE, Public company filings, Macao DSEC, Macao Tourism Board.
55China Is The World’s Largest and Fastest
1 Growing Outbound Tourism Market
Outbound Travel Tourism Spending
($ in US billions)
$700
$672
$600
$500 +$411 Billion
in Incremental
Spend
$400
$300
$261
$200
$100
$0
2016 2017E 2018E 2019E 2020E 2021E 2022E 2023E 2024E 2025E
Outbound Chinese Tourism Spend is Projected to Reach $672 Billion by 2025
Sources: Bernstein research, SAFE.
56China Is The World’s Largest and Fastest
1 Growing Outbound Tourism Market (cont.d)
Number of Outbound Travel Trips from China
(Trips in millions)
300
250 260
200
150
135
100
50
0
2016 2017E 2018E 2019E 2020E 2021E 2022E 2023E 2024E 2025E
In the Next 7 Years Outbound Travel From China is Projected to Reach 260 Million Trips
Source: Bernstein research, Haver.
571 Strong Growth in Chinese Outbound Tourism
Chinese Outbound Tourism to Select Markets
2010-2018
CAGR
+17% +16% +13% +13% +7% +17% +14% +12% +25% +33% +8% +11%
(in millions)
60.0
51.1
50.0
40.0
30.0
25.3
22.7
20.0
13.2
10.5
10.0 8.4
3.4 4.8
2.4 2.9 1.6 2.7 2.8 1.9
0.4 1.4 0.5 1.6 0.9 1.1 0.8 1.2 1.4 1.1
0.0
Australia Germany France Malaysia Taiwan USA Singapore Korea Japan Thailand Macao Hong Kong
2010 2018
Continued Growth of Chinese Outbound Tourism is Expected to Contribute to the Macao Mass Tourism
Opportunity
Source: CLSA, Macao DSEC, Hong Kong Tourism Board, Bloomberg.
58Chinese Middle Class Consumption Growth
1 Chinese Middle Class Consumption in 2030 is Projected to Reach $10 Trillion
Global Middle Class Consumption in 2030
($ in US trillions)
$15.0
$10.0
$10.0
$5.0
$4.0
$2.3 $2.5
$1.1 $1.2 $1.2 $1.3 $1.4
$0.0
France Brazil Mexico Germany Russia Japan Indonesia USA China
Continued Chinese Middle Class Consumption Growth is Expected to Contribute to the Macao Mass
Tourism Opportunity
Note: Brookings Institution defines the global middle class as those households with daily expenditures between $10 and $100 per person in purchasing power parity terms.
Source: Brookings Institution, UN, World Bank, The Financial Times.
592 Infrastructure: China’s High-Speed Rail
Connecting More of Mainland China to Macao
Beijing – Guangzhou High-Speed Rail
• World’s longest high-speed rail route
• Covers 2,298km in ~10 hours
(compared to 22 hours previously)
• Provides seamless connection from
Guangzhou – Zhuhai Intercity Rail Northern China to the Macao border via
the Guangzhou-Zhuhai Intercity Rail
• Rail line connecting Guangzhou to
Zhuhai, where the Gongbei border
gate to Macao is located
Wuhan – Guangzhou High-Speed Rail
• Guangzhou is the largest city in
Guangdong province and is a key • Wuhan is the capital of Hubei Province
economic and transportation hub and one of the most populous cities in
Central China with ~10 million people
• Reduces travel time from Guangzhou
to Zhuhai from 2+ hours by bus to as
• Wuhan is an important economic and
short as 60 minutes
transportation hub in Central China
• Zhuhai station opened in Jan 2013
• HSR reduces travel time to Guangzhou
• Future link to Macao Light Rail from 11 hours by bus to under 4 hours
System by train
Hong Kong
Macao
Continued Investment in the High-Speed Rail System
Source: SCMP, New York Times, Chinatrainguide.com, LVS.
60Infrastructure: Meaningful Improvements
2 Throughout The Greater Bay Area
Guangzhou Wuhan – Guangzhou High-Speed Rail
Population: 16.0M
• Four hour train ride
GDP Per Capita: US$22,000
Guangzhou – Shenzhen – Hong Kong Rail
• Two hour train ride from Guangzhou to Hong Kong
Guangzhou – Zhuhai Intercity Rail Shenzhen
• 60 - 80 minute train ride (2+ hours by bus) Population: 13.0M
GDP Per Capita: US$30,200
China Border Gate Expansion
• Reduced average wait times on China side of border
Macao
Population: 0.6M
GDP Per Capita: US$87,200
Gongbei – Hengqin Railway
• Connects the Gongbei border crossing with Hengqin
Island Hong Kong
• Stops at Lotus Bridge crossing and ends at Population: 7.5M
Chimelong theme park (Expected completion 2020) GDP Per Capita: US$48,700
• Second phase linking Hengqin Chimelong to Jinwan
Zhuhai Airport (Expected completion 2023)
Hong Kong-Zhuhai-Macao Bridge ~US$20B
Hengqin Island (opened October 2018)
• Special economic area
• Over $20B of overall investment expected
• Over 10,000 hotel rooms expected (~5,000 today) Taipa Ferry Terminal
• Phase I of Chimelong theme park opened in Jan. ‘14 • Opened June 2017
and attracted 10.8M visitors in ‘18. 20M annual visitors Existing
expected at completion of all phases Future
Source: DSEC, World Bank, Bloomberg, SCMP, Shenzen Government Online, Hong Kong Census and Statistics Department, Government of Guangzhou Municipality, Chinadaily.com, equity research.
Note: population and GDP data from 2018.
61You can also read