A 1.5 CELSIUS PATHWAY TO CLIMATE LEADERSHIP FOR THE UNITED STATES
←
→
Page content transcription
If your browser does not render page correctly, please read the page content below
www.energyinnovation.org
                                                            98 Battery Street; San Francisco, CA 94111
                                                                         policy@energyinnovation.org

A 1.5 CELSIUS PATHWAY TO
CLIMATE LEADERSHIP FOR THE
UNITED STATES
BY ROBBIE ORVIS ● FEBRUARY 2021

INTRODUCTION
According to the Intergovernmental Panel on Climate Change (IPCC), we must limit warming to
no more than 1.5 degrees Celsius by 2100 to avoid catastrophic climate change impacts.1 This
requires deep greenhouse gas (GHG) emissions reductions, dropping to net zero by or before
2050. Achieving these reductions requires immediate changes in how we power our economy
and necessitates a transition from fossil fuel-based technologies to low- or zero-carbon
technologies.
The costs of many zero-carbon technologies, along with costs of highly efficient appliances and
equipment, have fallen dramatically in the last ten years—making this transition possible and
affordable. Since 2009, solar photovoltaic panel costs have dropped 90 percent,2 wind turbine
costs 71 percent,3 and LED light bulbs 80 percent.4 Meanwhile, batteries—which are now
powering our vehicles and will increasingly support greater renewables integration—have fallen
80 percent in cost since 2013.5 Because these declines will continue, today’s technology and
anticipated improvements mean the United States has the tools necessary to deeply
decarbonize our economy while spurring massive job creation to deploy new clean energy
resources.
But this transition will not happen on its own, and certainly not on the timeline outlined by the
IPCC, without additional policy. Only well-designed policies can drive this technological
transformation at the required pace. The good news is that decades of experience in climate and
energy policy have established a deep understanding of which policies can deliver emissions
reductions and show us the path forward.
The U.S. Energy Policy Simulator, an open-source and non-partisan computer model developed
by Energy Innovation, has designed a policy scenario that achieves the IPCC’s recommended
emissions reductions. This state-of-the-art modeling tool shows that a comparatively small group
of policies can drive the U.S. economy toward net-zero emissions by 2050 and achieve the
emissions reductions in 2030 required for a 1.5 C trajectory. Transforming the built economy
also generates huge benefits. The modeling shows a 1.5 C pathway could increase U.S. gross

                                                                                                         1
domestic product by $489 billion per year in 2030 and $997 billion in 2050 (a 2.6 percent annual
GDP expansion), create more than 3.1 million new job-years by 2030 and 5.5 million new job-
years by 2050, avoid more than 65,000 premature deaths and 2 million asthma attacks by 2050,
and would build an economy powered primarily by renewable energy that is insulated from fossil
fuel-price volatility.
But we have no time to waste. Immediate action is required to achieve interim requirements and
ensure sufficient time to replace existing fossil-fueled equipment with zero- and low-carbon
alternatives. This paper outlines a path forward.
STEEP, IMMEDIATE REDUCTIONS REQUIRED TO LIMIT WARMING TO 1.5 C
Achieving the IPCC targets requires cutting global carbon dioxide (CO2) emissions roughly in half
by 2030 and approaching zero by 2050. Non-CO2 GHGs must follow a similar trajectory, with
some additional time to reach net zero. While the exact percent of emissions decrease is
undefined, the IPCC has suggested that without heavy reliance on CO2 removal technology—
which does not yet exist at scale—a global decrease of 47-58 percent in 2030 and 93-95 percent
in 2050 relative to 2010 levels is required, with developed nations at the upper end of those
ranges or even beyond them.6,i
Cutting emissions in line with these goals requires replacing most fossil fuel consumption with
clean alternatives. By 2050, nearly all energy demand must be met with zero-carbon fuels,
particularly in the buildings, electricity, industry, and on-road transportation sectors. Agricultural
emissions, which account for about 10 percent of net GHG emissions, must be cut as well. CO2
uptake from land use, land-use change, and forestry practices (LULUCF) can offset some
remaining agricultural, fossil fuel, and industrial process emissions, but LULUCF mitigation
potential in the United States is quite small.
Interim goals, like the 2030 targets, are necessary to a 1.5 C pathway because they will
determine cumulative GHG emissions between now and 2050, which is ultimately what matters
for climate stability. Immediate cuts are required to hit 2030 targets roughly consistent with
halving emissions in the next ten years. We must focus on electricity sector decarbonization, as it
has the most readily available and deployable technology, and we must prioritize eliminating
coal—the highest-polluting fuel. But we must simultaneously ramp up deployment of the
technologies that will be key to achieving 2031-2050 targets, such as electric vehicles and heat
pumps.
Previous EPS analysis demonstrates how costly it would be to delay adopting policies that begin
to draw down emissions. Modeling shows that immediately adopting clean energy policies in
2021 to put us on a pathway to net zero by 2050 would require cumulative investments of
approximately $320 billion in 2035. On the other hand, starting implementation in 2030—a delay
i These ranges reflect scenarios P1 and P2, which do not rely on significant CO2 removal in the latter half of the century.
2of just ten years—would cost roughly $750 billion by 2035. Delaying action also risks building
new fossil fuel resources that will be stranded assets in a net-zero future.7
Major emitting regions and countries have already committed to steep emissions cuts with
interim targets, and the United States must follow suit. In September 2020 China committed to
carbon neutrality by 2060,8 and in December 2020 the European Union committed to cut
emissions 55 percent relative to 1990 levels, in line with the reductions needed for a 1.5 C
pathway.9
As it did ahead of the landmark Paris Climate Agreement, the U.S. should once again commit to
emissions reductions, this time in line with a 1.5 C pathway. This new commitment would align
the U.S. with recent updated commitments from other leading emitters such as China and the
EU, driving stronger commitments from other major emitting countries.
A 1.5 C POLICY PATHWAY FOR THE UNITED STATES
We used the U.S. Energy Policy Simulator to model a 1.5 C Scenario, identifying policies across all
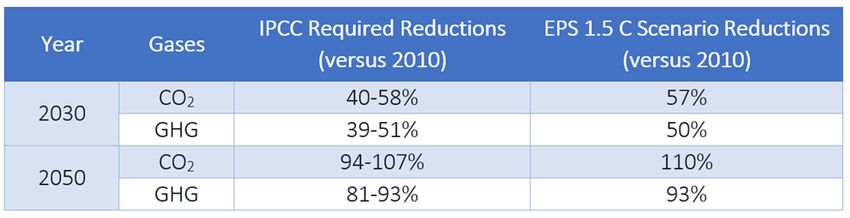
economic sectors to achieve the IPCC’s recommended GHG reductions. The 1.5 C Scenario cuts
CO2 emissions 54 percent and total GHG emissions 48 percent in 2030, and 111 percent and 95
percent in 2050, relative to 2010 levels.
Reductions in 2030 are in line with those suggested by the IPCC, while 2050 reductions actually
exceed the IPCC’s suggested ranges as a way of minimizing cumulative emissions in this
timeframe.
Table 1: Emissions Reductions in 1.5 C Scenario Relative to IPCC Required Reductions
The wedge graph below shows U.S. emissions trajectories, including how much each specific
policy reduces emissions through 2050. Policies are color-coded by sector with industrial policies
in red, electricity policies in blue, transportation policies in purple, building policies in green,
LULUCF policies in yellow, and agricultural policies in orange. The analysis finds that while
policies are needed across all sectors of the economy, a handful can achieve most required
reductions
3Greenhouse Gas Reductions by Policy
Cropland and Rice Measures
6,000
Livestock Measures
Afforestation and Reforestation
Improved Forest Management
5,000 Increased Retrofitting
Building Efficiency
Electric Building Codes and Appliance
Standards
Million Metric Tons CO2e
4,000 Mode Shifting
Vehicle Fuel Economy Standards
1.5 C Pathway Range Passenger EV Sales Standard + Clean
Trucks
3,000 Extension of ITC/PTC
Existing Coal Power Plant Regs
New Gas Power Plant Regs
100% Clean Electricity Standard + Grid
2,000
Flex
Cement Clinker Substitution
Industry CCS
Industry Energy and Material Efficiency
1,000
F-gas Measures
Hydrogen Production via Electrolysis
1.5 C Pathway Range
Methane Capture and Destruction
0
Industrial Switch to Clean Fuels
2020 2025 2030 2035 2040 2045 2050
TOP EMISSIONS REDUCTION POLICIES
Clean Electricity Standard
One of the strongest policies to reduce emissions is a clean electricity standard (CES), coupled
with grid flexibility policies like expanded transmission and deployment of storage and demand
response. The CES, which requires 80 percent clean electricity in 2030 and 100 percent in 2035,
is the linchpin of economywide decarbonization because it unlocks zero-emission electrification
of demand in other sectors, such as through electric vehicles and electric building heating. As the
overall economy is electrified, emissions associated with other sectors are also eliminated
because they are powered by a clean grid.
Three separate and detailed grid modeling studies released in 2020 by the University of
California, Berkeley,ii Princeton University,iii and Vibrant Clean Energyiv demonstrated that a
deeply decarbonized grid (90 percent or more) can be both reliable and affordable. Each study
found that transitioning away from coal and gas does not negatively impact cost or reliability.
Coal is often the most expensive power in the market, so replacing coal plants with clean energy
ii Phadke, A., U. Paliwal, N. Abhyankar, T. McNair, B. Paulos, D. Wooley, and R. O’Connell, 2020, “2035 Report: Plummeting Solar,
Wind, and Battery Costs Can Accelerate Our Clean Electricity Future,” Berkeley, CA: Goldman School of Public Policy, University of
California, Berkeley, https://www.2035report.com/
iii Larson, E., C. Greig, J. Jenkins, E. Mayfield, A. Pascale, C. Zhang, S. Pacala, et al. 2020, Net-Zero America by 2050: Potential
pathways, deployments and impacts, Princeton, NJ: Princeton University, https://environmenthalfcentury.princeton.edu/
iv Vibrant Clean Energy, Consumer, Employment, and Environmental Benefits of Electricity Transmission Expansion in the Eastern
U.S., 2020, https://www.vibrantcleanenergy.com/wp-content/uploads/2020/10/EIC-Transmission-Decarb.pdf
4generates substantial cost savings. In fact, more than 90 percent of existing U.S. coal-fired power
can be replaced by local wind and solar while generating customer savings.v Although not all of
these studies looked at decarbonizing the last 10 percent of the grid, more than a decade
remains until that level of grid decarbonization is required, giving engineers and researchers
ample time to develop solutions.vi
Industrial Switching to Zero-Carbon Fuels and Green Hydrogen
Another important policy to reduce emissions is moving away from industrial fossil fuel use
toward alternatives such as electricity, hydrogen, and biomass. If hydrogen ends up providing a
major share of alternative fuel use, that hydrogen must be produced from electrolysis (i.e., green
hydrogen) to avoid a large emissions increase. Industrial fuel switching could be achieved
through a variety of policies including air pollution or equipment standards, carbon pricing on
industrial fuels, or industrial carbon caps. Similarly, some amount of fuel switching could be
avoided by implementing industrial carbon capture and storage. Any policy combination,
however, must push industry away from fossil fuels toward clean alternatives, then eliminate
remaining emissions.
Zero-Emission Vehicle Standards
Zero-emission vehicle (ZEV) standards, which require all new sales of cars, trucks, and buses to
be zero-emission by 2035 (cars and buses) or 2045 (trucks), are another key policy. These
standards start the process of converting the bus and truck fleet to zero-carbon technologies,
while allowing time for those technologies to develop.
A ZEV standard could be achieved several different ways. One option would be strengthening
existing tailpipe standards to a standard of zero CO2 grams per mile in 2035, effectively requiring
all new passenger car sales to be ZEV by 2035. Another option would be separately instituting a
sales standard requiring a minimum share of vehicles sold each year to be ZEVs, then steadily
ramping that requirement up to 100 percent by 2035. The latter option is similar to the
approach taken by California and several other states, while the former is more aligned with
existing federal policy.
Electrified Building Standards
Electrifying all existing and new buildings is another top economywide decarbonization policy.
Most of the U.S. building stock that will exist in 2050 is already built today, which means existing
fossil fuel equipment in buildings must be replaced with electrified alternatives. This means
replacing fossil fuel-powered space heating, water heating, and cooking equipment with electric
alternatives such as air source heat pumps, heat pump and electric resistance water heaters, and
vAs-yet unpublished Energy Innovation analysis—can be made available on request.
viPrevious Energy Innovation analysis explains five possible technological pathways for cost-effectively meeting 100 percent clean
electricity by 2035. See: Phadke, A., Aggarwal, S., O’Boyle, M., Gimon, E., Abhyankar, N. 2020, “Illustrative Pathways To 100
Percent Zero Carbon Power By 2035. Energy Innovation. https://energyinnovation.org/wp-content/uploads/2020/09/Pathways-
to-100-Zero-Carbon-Power-by-2035-Without-Increasing-Customer-Costs.pdf
5electric or induction cookstoves. Considering appliances can last up to 20 years, all new
equipment must be electric by 2030 to ensure an all-electric building stock by 2050.
Various policy mechanisms can achieve this sales standard, such as using existing regulatory
authority to limit pollutant emissions from new equipment and setting efficiency standards that
drive new equipment sales. Upgraded building codes could require new buildings to be electric,
and several U.S. cities and foreign countries have already instituted codes requiring all new
buildings to be net zero beginning in the next five to ten years.vii
Eliminating Coal Emissions
Eliminating coal power plant emissions is a critical component in achieving the 2030 emissions
reduction target. Our analysis finds that without eliminating coal emissions by 2030, achieving
U.S. emissions reductions in line with limiting warming to 1.5 C is impossible. Studies range in
estimates of how much coal retirement is expected without additional policy, with some
modeling finding low gas and renewables prices driving faster retirements, while other models
factor in current utility practices of running uneconomic coal and forestalling retirement. In
either case, policy will be needed to ensure coal plants are no longer emitting in 2030.
Policy could take a variety of forms, including federal regulations on coal plant emissions (both
GHG and conventional pollutants), a sufficient power sector carbon price, and state-overseen
utility resource planning. Our modeling assumes a combination of these policies will retire the
coal fleet by 2030. Another pathway would be retrofitting existing coal plants with carbon
capture, but this is prohibitively expensive at both current and future projected costs.
INDUSTRY SECTOR POLICIES
In the industry sector, which encompasses manufacturing and energy production except for
electricity, standards can drive substitution of all fossil fuels with a mix of zero-carbon fuels
including electricity and hydrogen. Similarly, we modeled standards ensuring all new hydrogen is
produced via electrolysis by 2050. Today, nearly 95 percent of hydrogen is produced via carbon-
intensive methane reforming. New and strengthened leakage regulations can significantly
reduce methane emissions, with full implementation of these policies achieved by 2030. We also
modeled new standards to cut emissions of fluorinated gases (F-gases), which are used primarily
as refrigerants in cooling systems and which have high global warming potential, in line with the
Kigali Amendment to the Montreal Protocol.viii
vii Some examples include California, Cambridge, MA, Scotland, U.K., and the European Union.
viii
Congress authorized these reductions in the December 2020 spending bill, strengthening EPA’s authority to achieve these
reductions. In the past, the EPA has set limits on F-gas consumption and emissions through the Significant New Alternatives
Policy (SNAP) program. Bill Pascrell, “Further Consolidated Appropriations Act, 2020,” Pub. L. No. 116–94 (2020),
https://www.congress.gov/bill/116th-congress/house-bill/1865/text.
6Greenhouse Gas Reductions by Policy - Industry
6,000 Cement Clinker
Substitution (2%)
5,000 Industry CCS (3%)
4,000 Industry Energy and
Million Metric Tons CO2e
Material Efficiency
(4%)
F-gas Measures
3,000
(15%)
Hydrogen
2,000 Production via
Electrolysis (16%)
Methane Capture
1,000 and Destruction
(19%)
Industrial Switch to
Clean Fuels (41%)
0
2020 2025 2030 2035 2040 2045 2050
For remaining industrial process CO2 emissions in 2050 (emissions not from energy combustion),
we assume half of these emissions are captured and sequestered using carbon capture,
utilization, and sequestration technology. We also include industrial energy efficiency policies
that cut energy demand 17 percent by 2050, roughly doubling the projected business-as-usual
rate of efficiency improvement. While these measures have little CO2 impact when implemented
alongside a switch to zero-carbon fuels, they are key to lowering industry-sector transition costs
because they avoid the need to build additional electricity and hydrogen infrastructure. Finally,
we included policies requiring an increase in the use of clinker substitutes in the cement sector
and improved material efficiency, which reduce the need for new industrial commodities such as
cement, iron, and steel. Like energy efficiency standards, these are key components of industry-
sector decarbonization because they reduce demand for new zero-carbon infrastructure.
ELECTRICITY SECTOR POLICIES
In the electricity sector, a clean electricity standard (CES) of 80 percent by 2030 and 100 percent
by 2035, coupled with policies supportive of deploying more batteries, demand response, and
transmission, is the key to decarbonizing the entire economy. In the 1.5 C Scenario, most sectors
rely on electrification to decarbonize, and the CES ensures this new electricity demand is met
7with zero-carbon electricity. However, the U.S. must eliminate coal electricity generation by
2030 to achieve the IPCC’s 2030 targets. The 1.5 C Scenario assumes that a mix of standards will
stop coal generation by 2030.
Greenhouse Gas Reductions by Policy - Electricity
6,000
Extension of
ITC/PTC (1%)
5,000
4,000
Million Metric Tons CO2e
Existing Coal Power
Plant Regs (13%)
3,000
New Gas Power
2,000 Plant Regs (27%)
1,000
100% Clean
Electricity Standard
+ Grid Flex (60%)
0
2020 2025 2030 2035 2040 2045 2050
Cutting electricity emissions in line with a 1.5 C target also requires not building any new gas
plants that lack carbon capture. The United States already has a massive oversupply of gas
plants, many of which are likely to become stranded assets, and no reason exists to build more
plants. Accordingly, we include policy that requires carbon capture on new gas plants, which
causes no new gas plants to be built where construction hasn’t already commenced. Finally,
extending the Production Tax Credit and Investment Tax Credit can help ease the transition to a
decarbonized grid by subsidizing part of the required new construction.
TRANSPORTATION SECTOR POLICIES
To decarbonize the transportation sector, newly sold vehicles—including light- and heavy-duty
vehicles—must be zero-emission. We include a transition to selling 100 percent zero-emission
light-duty vehicles and buses by 2035, and 100 percent heavy-duty vehicles by 2045 in this
scenario. These sales targets could be achieved through a sales standard or existing GHG tailpipe
8regulations. The 2035 target for light-duty vehicles and buses ensures nearly the whole stock of
those vehicles is electric by 2050. For heavy-duty trucks, we allow more time for technology to
develop and costs to come down.
Greenhouse Gas Reductions by Policy - Transportation
6,000
Mode Shifting (4%)
5,000
4,000
Million Metric Tons CO2e
3,000 Vehicle Fuel
Economy Standards
(20%)
2,000
1,000 Passenger EV Sales
Standard + Clean
Trucks (76%)
0
2020 2025 2030 2035 2040 2045 2050
Even with these aggressive sales targets, a significant number of fossil fuel-powered vehicles will
continue to be sold in the interim. These vehicles must be as efficient as possible to avoid locking
in higher emissions. For this reason, we include a fuel efficiency standard that significantly
strengthens these vehicles’ efficiency before they are phased out.
We also include policies promoting better freight transport utilization and a 20 percent
passenger car travel reduction, which reflects policies encouraging use of non-motorized and
public transit. While these policies have smaller emissions reduction potential, they are
important for public health and healthy cities—particularly in low-income neighborhoods, which
have a disproportionate share of freight emissions—and they lower the cost of transitioning to a
low-carbon transportation sector.
9BUILDING SECTOR POLICIES
Building sector emissions primarily come from burning gas and oil in buildings, which makes
transitioning to all-electric buildings the key to decarbonizing. The 1.5 C Scenario includes a sales
standard requiring all newly sold building equipment to run on electricity by 2030 and all new
buildings to be fully electric and net zero by 2035.
Greenhouse Gas Reductions by Policy - Buildings
6,000
Increased
5,000 Retrofitting (4%)
4,000
Million Metric Tons CO2e
Building Efficiency
3,000 (7%)
2,000
1,000
Electric Building
Codes and
Appliance
Standards (90%)
0
2020 2025 2030 2035 2040 2045 2050
These policies lead to all buildings being fully electrified by 2050. We also include improved
building efficiency for all equipment as well as building retrofits, so that 30 percent of the
existing building stock will be retrofitted by 2050. While these policies create a smaller emissions
impact in the 1.5 C Scenario because of building electrification, they lower decarbonization costs
by allowing smaller equipment to be installed and by avoiding new power plant buildout. They
also are massive job creators: a 2020 report by the Energy Futures Initiative estimated nearly 2.4
million Americans are employed in the Energy Efficiency sector.10
LAND AND AGRICULTURE POLICIES
We include several land and agriculture policies in the 1.5 C Scenario, but we do not rely heavily
on them due to uncertainties around abatement potential and policy implementation. This
10scenario includes forest management policies, improved carbon uptake, growing forested land in
the U.S., and afforestation and reforestation policies.
Greenhouse Gas Reductions by Policy - Land and Agriculture
6,000
Cropland and Rice
5,000 Measures (4%)
4,000
Million Metric Tons CO2e
Livestock Measures
(26%)
3,000
Afforestation and
2,000 Reforestation (26%)
1,000
Improved Forest
Management (44%)
0
2020 2025 2030 2035 2040 2045 2050
In the agriculture sector, we include livestock and cropland measures, which primarily results in
wide-scale deployment of anaerobic digesters and improved soil carbon practices, like precision
and no-till agriculture.
ECONOMIC AND HEALTH
Decarbonizing our economy can create millions of new jobs, with the 1.5 C Scenario generating
more than 3.1 million new job-years by 2030 and 5.5 million new job-years by 2050.ix These jobs
result from deploying new infrastructure on the path to deep decarbonization, such as
constructing wind and solar power plants and developing hydrogen plants used to supply the
industry sector.
ix One job-year is one full-time job for one year.
11Job Creation in 1.5 C Scenario
6,000,000
5,000,000
4,000,000
Job-Years
3,000,000
2,000,000
1,000,000
-
2020 2025 2030 2035 2040 2045 2050
Fossil Fuel and Utility Jobs
Manufacturing and Construction Jobs
Other Jobs
Total
Of course, additional assistance will be required to ensure that workers in transitioning
industries are able to retrain and take advantage of the newly created job opportunities. This
assistance can come in many forms, including tax credits and subsidies for businesses in fossil
fuel-dependent communities, job training, small business loan access, and support for fossil fuel
pension programs, many of which, like the Pension Benefits Corporation,11 are running huge
budget deficits.
Enormous health benefits are also associated with the transition to a zero-carbon economy.
Emissions of PM2.5, a dangerous pollutant that causes adverse health effects including premature
death, drop nearly 90 percent by 2050. SOx and NOx emissions, which form secondary PM2.5 and
also contribute to premature death, drop by more than 90 and 65 percent, respectively. As a
result, the 1.5 C Scenario avoids nearly 20,000 premature deaths in 2030. By 2050, the scenario
avoids more than 65,000 premature deaths, nearly 2 million asthma attacks, nearly 38,000
hospital admissions, and more than 6.5 million lost workdays
CONCLUSION
The U.S. is off-track to a sustainable climate future, and without additional policies, emissions are
projected to remain more or less steady for the foreseeable future. To become an international
leader and align with efforts limiting warming to 1.5 C, the U.S. must immediately begin cutting
emissions economywide. This includes phasing out coal power by 2030; committing to
generating electricity from clean sources in line with reducing electricity emissions 80 percent by
2030 and 100 percent by 2035; ensuring new passenger cars and buses are all electric by 2035
12and trucks by 2045; phasing out sales of non-electric building equipment by 2030; and
significantly cutting non-CO2 pollutants, such as methane and refrigerant emissions, over the
next decade. Pursuing these and other policies outlined in the 1.5 C Scenario can put the U.S. on
a path to net-zero CO2 before 2050 and align the country with global efforts to secure a safe
climate future.
These policies, and the required deployment of new clean technology, will generate millions of
new jobs and help reinvigorate the U.S. economy as we emerge from the COVID-19 pandemic.
The demand for new technology will create enormous opportunities for U.S. manufacturers to
design, build, and sell this technology at home and abroad. And these policies will cut dangerous
pollution that kills tens of thousands of Americans every year and causes millions more to suffer
from respiratory illnesses. The 1.5 C Scenario shows how policymakers can solve both the
growing climate crisis, while also creating well-paying jobs and investing in sustainable economic
growth.
1 IPCC, “Summary for Policymakers,” in Global Warming of 1.5°C. An IPCC Special Report on the Impacts of Global Warming of
1.5°C above Pre-Industrial Levels and Related Global Greenhouse Gas Emission Pathways, in the Context of Strengthening the
Global Response to the Threat of Climate Change, Sustainable Development, and Efforts to Eradicate Poverty, ed. Masson-
Delmotte, V. et al. (Geneva, Switzerland: World Meteorological Organization), 32, accessed February 9, 2021,
https://www.ipcc.ch/site/assets/uploads/sites/2/2019/05/SR15_SPM_version_report_LR.pdf.
2 “Levelized Cost of Energy and of Storage,” Lazard.com, accessed February 18, 2021,
http://www.lazard.com/perspective/levelized-cost-of-energy-and-levelized-cost-of-storage-2020/.
3 “Levelized Cost of Energy and of Storage.”
4 “Energy Savings Forecast of Solid-State Lighting in General Illumination Applications,” 2018, 128.
5 “Battery Pack Prices Cited Below $100/KWh for the First Time in 2020, While Market Average Sits at $137/KWh,” BloombergNEF
(blog), December 16, 2020, https://about.bnef.com/blog/battery-pack-prices-cited-below-100-kwh-for-the-first-time-in-2020-
while-market-average-sits-at-137-kwh/.
6 IPCC, “Summary for Policymakers.”
7 Harvey, H, Mahajan, M., Aggarwal, S. Deng, M., “The Costs of Delay,” Energy Innovation, February 2021,
https://energyinnovation.org/wp-content/uploads/2021/01/Cost_of_Delay.pdf
8 Steven Lee Myers, “China’s Pledge to Be Carbon Neutral by 2060: What It Means,” The New York Times, September 23, 2020,
sec. World, https://www.nytimes.com/2020/09/23/world/asia/china-climate-change.html.
9 “EU Leaders Pledge to Cut Emissions by 55% by 2030,” The Independent, December 12, 2020,
https://www.independent.co.uk/climate-change/news/eu-leaders-emissions-pledge-2030-b1769935.html.
10 National Association of State Energy Officials and Energy Futures Initiative, “2020 U.S. Energy & Employment Report,” accessed
February 22, 2021,
https://static1.squarespace.com/static/5a98cf80ec4eb7c5cd928c61/t/5ee78423c6fcc20e01b83896/1592230956175/USEER+20
20+0615.pdf.
11 “PBGC Fiscal Year 2018 Report Highlights | PLANSPONSOR,” accessed February 19, 2021, www.plansponsor.com/pbgc-fiscal-
year-2018-report-highlights/.
13You can also read