A comprehensive dataset of microbial abundance, dissolved organic carbon, and nitrogen in Tibetan Plateau glaciers - ESSD
←
→
Page content transcription
If your browser does not render page correctly, please read the page content below
Earth Syst. Sci. Data, 14, 2303–2314, 2022
https://doi.org/10.5194/essd-14-2303-2022
© Author(s) 2022. This work is distributed under
the Creative Commons Attribution 4.0 License.
A comprehensive dataset of microbial abundance,
dissolved organic carbon, and nitrogen in
Tibetan Plateau glaciers
Yongqin Liu1,2 , Pengcheng Fang3 , Bixi Guo2 , Mukan Ji1 , Pengfei Liu1 , Guannan Mao2 , Baiqing Xu2 ,
Shichang Kang4 , and Junzhi Liu1
1 Center
for the Pan-Third Pole Environment, Lanzhou University, Lanzhou 730000, China
2 State Key Laboratory of Tibetan Plateau Earth System, Resources and Environment, Institute of Tibetan
Plateau Research, Chinese Academy of Sciences, Beijing 100101, China
3 Key Laboratory of Virtual Geographic Environment (Nanjing Normal University), Ministry of Education,
Nanjing 210023, China
4 State Key Laboratory of Cryospheric Science, Northwest Institute of Eco-Environment and Resources,
Chinese Academy of Sciences, Lanzhou 730000, China
Correspondence: Junzhi Liu (liujunzhi@lzu.edu.cn)
Received: 6 January 2022 – Discussion started: 21 January 2022
Revised: 11 April 2022 – Accepted: 20 April 2022 – Published: 13 May 2022
Abstract. Glaciers are recognized as a biome dominated by microorganisms and a reservoir of organic carbon
and nutrients. Global warming remarkably increases glacier melting rate and runoff volume, which have signif-
icant impacts on the carbon and nitrogen cycles in downstream ecosystems. The Tibetan Plateau (TP), dubbed
“the water tower of Asia”, owns the largest mountain glacial area at mid- and low-latitudes. However, limited
data on the microbial abundance, organic carbon, and nitrogen in TP glaciers are available in the literature, which
severely hinders our understanding of the regional carbon and nitrogen cycles. This work presents a new dataset
on microbial abundance, dissolved organic carbon (DOC), and total nitrogen (TN) for TP glaciers. In this dataset,
there are 5409 records from 12 glaciers for microbial abundance in ice cores and snow pits, and 2532 records
from 38 glaciers for DOC and TN in the ice core, snow pit, surface ice, surface snow, and proglacial runoff. These
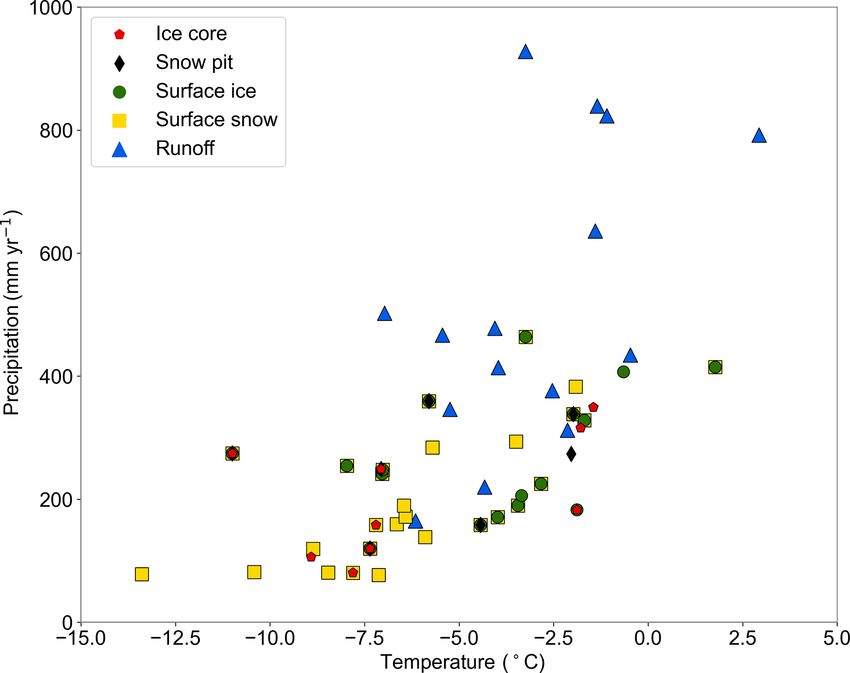
glaciers are located across diverse geographic and climatic regions, where the multiyear average air temperature
ranges from −13.4 to 2.9 ◦ C and the multiyear average precipitation ranges from 76.9 to 927.8 mm. This makes
the constructed dataset qualified for large-scale studies across the TP. To the best of our knowledge, this is the
first dataset of microbial abundance and TN in TP glaciers and also the first dataset of DOC in ice cores of the TP.
This new dataset provides important information for studies on carbon and nitrogen cycles in glacial ecosystems,
and is especially valuable for the assessment of potential impacts of glacier retreat on downstream ecosystems
under global warming. The dataset is available from the National Tibetan Plateau/Third Pole Environment Data
Center (https://doi.org/10.11888/Cryos.tpdc.271841; Liu, 2021).
Published by Copernicus Publications.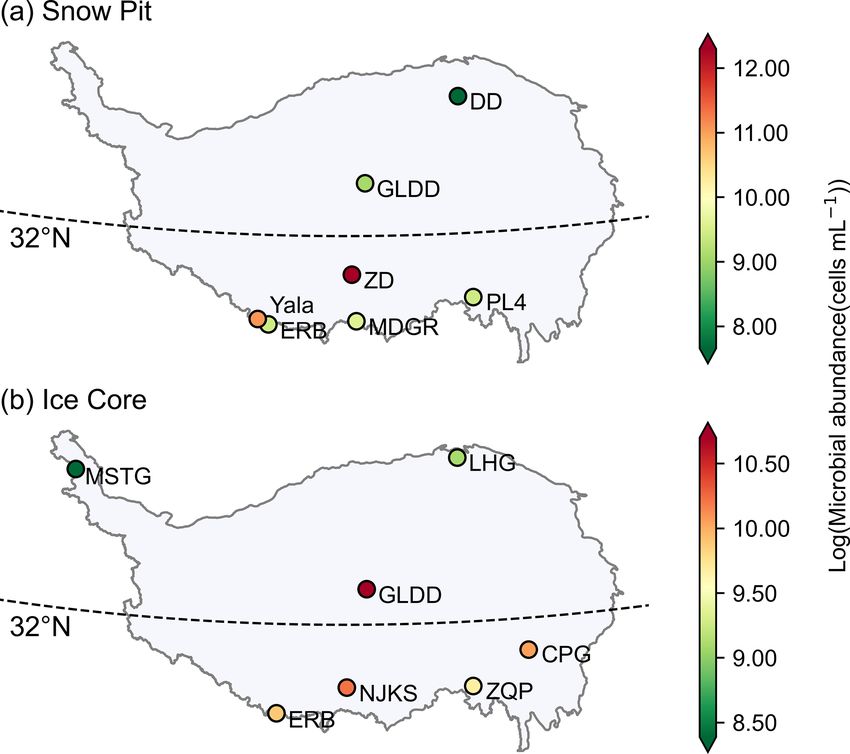
2304                                                               Y. Liu et al.: Microbial abundance, DOC, and TN in TP glaciers

1   Introduction                                                       This dataset can provide fundamental data for analyzing the
                                                                       storage, spatial pattern, and drivers of glacier carbon and
The glacier is regarded as an extreme environment, featured            nitrogen on the TP. It can also facilitate the investigations
by sustained low temperature, lack of nutrients, and strong            of glacier biogeochemical cycles and evaluate the impact of
radiation. Abundant and active microorganisms play impor-              glacier retreat on downstream ecosystems.
tant roles in the biogeochemical cycling in glacier ecosys-
tems (Liu et al., 2016a; Smith et al., 2017; Irvine-Fynn et            2     Study area
al., 2021), and the glacier is a reservoir of microorganisms,
organic carbon, and nitrogen (Anesio and Laybourn-Parry,               The TP covers an area of about 2.5 million km2 , with an aver-
2012; Hood et al., 2015). Carbon and nitrogen in glaciers              age altitude of more than 4000 m above sea level (a.s.l.). The
could be originated from atmospheric deposition or micro-              climate over the TP is primarily influenced by the interaction
bial activities (Anesio et al., 2017; Hodson et al., 2008).            between the Indian monsoon and the westerly wind (Tian et
These nutrients are vital for downstream aquatic ecosystems            al., 2001). The TP and its surrounding regions contain the
(Hodson et al., 2008; Dubnick et al., 2017), especially for the        largest number of glaciers outside the poles with an area of
oligotrophic proglacial streams and lakes (Hood et al., 2015).         about 47 000 km2 (Yao et al., 2012). These glaciers are im-
Glaciers are also the species pools for downstream aquatic             portant water resources for downstream areas and play a cru-
ecosystems and substantially influence the microbial func-             cial role in regional water supply (Immerzeel et al., 2010).
tions in downstream ecosystems. It has been reported that              The glaciers on the TP are mainly distributed in the Kunlun,
glacier-originated bacteria can contribute up to 20 % of the           Nyainqntanglha, Himalaya, and Karakoram mountains, and
microbial community in the proglacial stream 20 km down-               most glaciers are located between 4500 and 6500 m a.s.l. (Liu
stream (Liu et al., 2021), and glacier retreat can change the          et al., 2015). The glaciers can be divided into three types (Shi
fungal abundance and cellulose decomposition rate in moun-             and Liu, 2000): monsoonal temperate glaciers (mainly dis-
tain rivers (Fell et al., 2021). Under global climate warming,         tributed in the southeast of the TP), subcontinental glaciers
glaciers are melting at an accelerating rate: the carbon, nitro-       (mainly distributed in the northeast and southern margin of
gen, and microorganisms stored in glaciers will be released            the TP), and the continental glaciers (mainly distributed in
in glacier runoff, and may alter the carbon and nitrogen cy-           the west of the TP). Most of the TP glaciers, except those in
cling in downstream ecosystems (Hood et al., 2009; Singer              the Karakoram region, are experiencing rapid retreat under
et al., 2012; Fellman et al., 2015; Wadham et al., 2016).              climate warming (Yao et al., 2012; Wang et al., 2021).
   The Tibetan Plateau (TP), dubbed “the water tower of
Asia”, owns the largest mountain glacial area at mid- and
low-latitudes (Yao et al., 2012). Glaciers on the TP are the           3     Sample distribution and laboratory measurements
sources of several large rivers in Asia and are thus of great
                                                                       3.1    Sample distribution
importance for downstream regions (Yao et al., 2019). How-
ever, due to harsh climate conditions and logistic difficulties,       In this study, 5409 microbial abundance data are distributed
there have been limited reports of microorganisms, organic             across 12 glaciers across the TP (Fig. 1a), including 5210 ice
carbon, and nitrogen in TP glaciers, especially in ice cores.          core samples from 7 glaciers and 199 snow-pit samples from
Microbial abundance in ice cores is only available in three            7 glaciers. For DOC and TN, 2532 samples from 38 glaciers
TP glaciers (i.e., Puruoganri, East Rongbuk, and Malan; Yao            were collected as shown in Fig. 1b, including 1625 ice core
et al., 2006; Zhang et al., 2008, 2010) using the epifluores-          samples from 7 glaciers, 180 surface ice samples from 17
cence microscopy method, and there is as yet no publicly               glaciers, 100 snow-pit samples from 4 glaciers, 254 surface
available dataset on the dissolved organic carbon (DOC) and            snow samples from 28 glaciers, and 397 proglacial runoff
total nitrogen (TN) in ice cores from the TP. Even for the sur-        samples from 16 glaciers.
face ice and snow, the data on microbial abundances, DOC,                 The sampled glaciers cover diverse climate conditions.
or TN have only been reported in less than 10 glaciers (Hood           The multiyear average air temperature ranged from −13.4
et al., 2015; Liu et al., 2016b; Hu et al., 2018; Yan et al.,          (the Guliya glacier) to 2.9 ◦ C (the Zhuxigou glacier), and the
2020; Kang et al., 2022). Data scarcity has significantly hin-         multiyear average precipitation ranged from 76.9 mm (the
dered our understanding of the biogeochemical cycle in TP              No. 15 glacier) to 927.8 mm (the 24K glacier). The tempera-
glaciers and downstream ecosystems.                                    ture and precipitation of most glaciers over the TP are within
   In this study, we aimed to construct a comprehensive                these ranges, which makes the dataset comprehensive and
dataset of microbial abundance, DOC, and TN in TP glaciers             representative.
through extensive field sampling and experimental measure-
ments. In this dataset, there are 5409 records from 12 glaciers
                                                                       3.2    Sample distribution
for microbial abundance in ice cores and snow pits, and 2532
records from 38 glaciers for DOC and TN in the ice core,               Ice cores were drilled from the accumulation zones of nine
snow pit, surface ice, surface snow, and proglacial runoff.            glaciers to depths from 11 to 173 m (Fig. 1) and then trans-

Earth Syst. Sci. Data, 14, 2303–2314, 2022                                             https://doi.org/10.5194/essd-14-2303-2022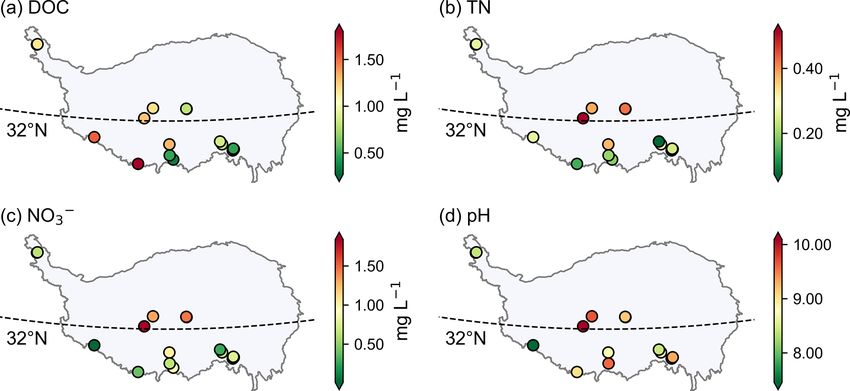
Y. Liu et al.: Microbial abundance, DOC, and TN in TP glaciers                                                             2305

ported frozen to the laboratory. Both microbial abundance         1 % HCl, rinsed with deionized water three times, and then
and DOC/TN data were measured for samples from five               combusted (450 ◦ C for >3 h) before use.
glaciers (i.e., Muztagh Ata (MSTG), Cuopugou (CPG), Zuo-             Flow cytometry combined with the nucleic acid stain is
qiupu (ZQP), Noijin Kangsang (NJKS), and East Rongbuk             a fast, accurate, quantitative, and reproducible technique for
(ERB)); for samples from the Laohugou (LHG) and Geladan-          counting the number of bacteria (Hammes et al., 2008; Prest
dong (GLDD) glacier, only microbial abundance was mea-            et al., 2013). The meltwater of snow, ice, and ice core sam-
sured; for samples from Muji (MJ) and Dunde (DD) glaciers,        ples were fixed with glutaraldehyde (final concentration:
only DOC and TN were measured. The MJ, MSTG, LHG,                 1 %) and then stored at 4 ◦ C, and were analyzed within 8 h
DD, and GLDD glaciers are mainly influenced by the west-          after being stained with SYBR Green I (final concentration:
erly wind, while the CPG, ZQP, NJKS, and ERB glaciers are         1 × 10⁻⁴ ; Marie et al., 1997). SYBR Green I is the standard
strongly influenced by the Indian monsoon.                        dye used to distinguish microorganisms from abiotic parti-
   Snow pits were dug at the accumulation zones of seven          cles in various environments (Van Nevel et al., 2017; Mao et
glaciers, and snow was sampled from top to bottom at 5 or         al., 2022). Stained samples were filtered using a cell strainer
10 cm intervals in each pit using a pre-sterilized steel scoop.   (pore size 420 µm) before being analyzed using flow cytom-
Microbial abundance, DOC, and TN concentrations were              etry to prevent clotting of the machine. The signal of mi-
measured for samples from GLDD, Zhadang (ZD), Palon               croorganisms was differentiated from the inorganic particles
No. 4 (PL4), and ERB glacier, while only microbial abun-          based on both fluorescence intensity and size (Prest et al.,
dance was measured for samples from DD, Mengdagangri              2013). Samples were processed on an EPICS ALTRA II flow
(MDGR), and Yala glacier. More specifically, 14 snow pits         cytometer (Beckman Coulter, USA) (Liu et al., 2016a). Du-
were analyzed for microbial abundance measurement, in-            plicate samples were measured with a relative standard devi-
cluding 6 at ZD glacier during April, May, June, August,          ation lower than 10 %. Flow cytometry data were collected
September, and October in 2006, 2 at the MDGR glacier in          and analyzed with CytoWin 4.31 software.
2006 and 2007, 2 at different altitudes in the PL4 glacier, and      The DOC and TN concentrations were measured using
1 for each at the DD, GLDD, ERB, and Yala glacier, respec-        a TOC-Lcph (Shimadzu Corp., Japan) following standard
tively. Four snow pits were sampled for DOC and TN con-           methods (Greenberg et al., 1992). Concentrations of NO−      3
centration measurements with one snow pit in each glacier         were measured using a Dionex ion Chromatograph System
among GLDD, ZD, PL4, and ERB.                                     2000 (Dionex Corp, USA) as previously described (Liu et
   Surface snow (top 10 cm) was sampled using a pre-              al., 2016a).
sterilized steel scoop from the ablation and accumulation
zones in 28 glaciers for DOC and TN concentration measure-        4     Data description of microbial abundance
ments. Surface ice samples were collected with a pre-cleaned
ice axe at the ablation zones in 17 glaciers. Ice and snow sam-   4.1    Snowpit
ples were stored in well-sealed WhirlPak bags (WhirlPak® ,
Nasco, USA) and transported to the laboratory under frozen        The microbial abundance in snow pits of the seven sam-
conditions.                                                       pled glaciers ranged from 212 to 721 305 cells mL−1 , and
   Proglacial runoff samples were collected from 16 glaciers      the mean microbial abundances were 2117, 8664, 218 305,
using 100 mL polycarbonate bottles pre-cleaned using 1 %          12 479, 14 442, 64 515, and 12 401 cells mL−1 for DD,
HCl (Nalgene, USA). Totally eight sets of 24 h water sam-         GLDD, ZD, PL4, MDGR, Yala, and ERB, respectively.
ples were collected at 6 glaciers (i.e., MSTG, Tanggula           The range of these measurements is consistent with pre-
Longxiazailongba (TGL), Qiangtang No. 1 (QT1), Qiangy-            vious studies using the flow cytometer method (e.g., 3.7–
ong (QY), Tonkmadi (DKMD), and PL4). The conductivity             25.0 × 10⁴ cells mL−1 in the Kuytun 51 Glacier, Tian-
and pH of proglacial runoff were measured in the field with a     shan Mountains; Xiang et al., 2009; on the order of 103 –
YSI EXO2 Water Quality Sonde. Water samples were trans-           105 cells mL−1 in the alpine snowpack; Lazzaro et al., 2015;
ported in a dark container with ice. In the laboratory, samples   Fillinger et al., 2021). Figure 3a shows the geospatial dis-
were frozen at −20 ◦ C until analyzed.                            tribution of microbial abundance for the sampled snow pits.
                                                                  Generally, the microbial abundance is lower in the westerly
                                                                  dominated region than those in the monsoon dominated re-
3.3   Laboratory measurements                                     gion. The DD glacier, located in the northeast of the TP,
The ice cores were decontaminated by removing the outer 1–        had the lowest microbial abundance (i.e., 2177 cells mL−1 ),
2 cm annulus with a knife, then were cut into 5–10 cm long        while the ZD glacier, located in the south of the TP, had the
sections and transferred into containers in a −20 ◦ C clean       highest abundance (i.e., 218 305 cells mL−1 ), which was 100
room. Both knife and container were pre-cleaned using 1 %         times higher than that in DD. Figure 4 shows the variation
HCl and rinsed with filter water. Snow, ice, and ice core sam-    of microbial abundance with depth in each snow pit, but no
ples were melted overnight and the meltwater was aliquoted        consistent patterns were observed.
into 20 mL glass bottles. The glass bottles were washed with

https://doi.org/10.5194/essd-14-2303-2022                                          Earth Syst. Sci. Data, 14, 2303–2314, 2022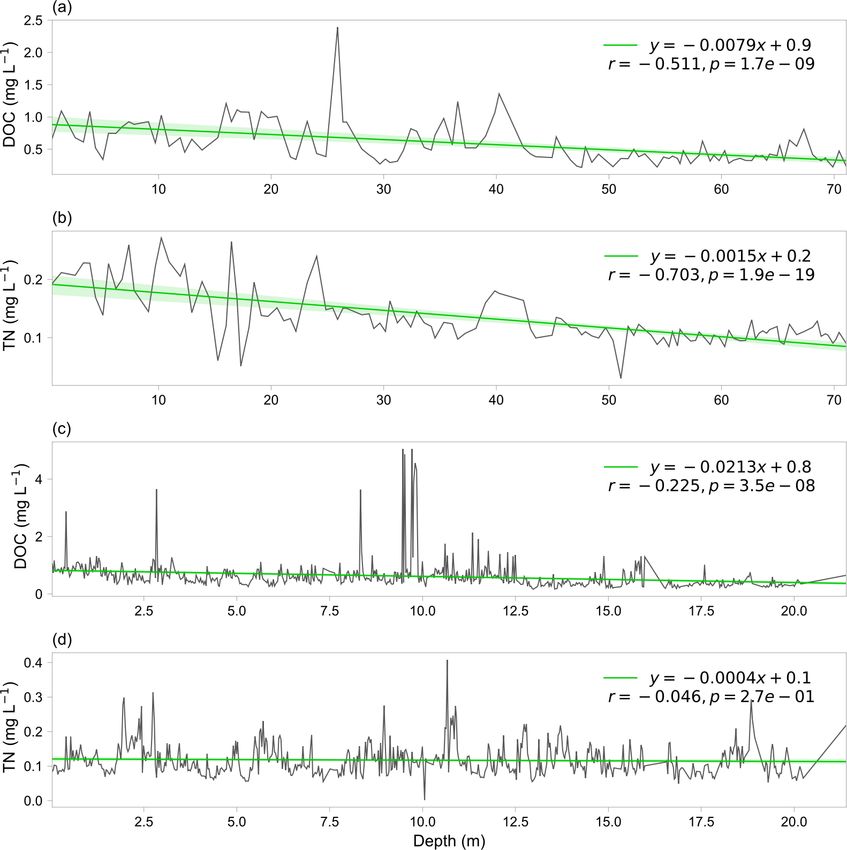
2306 Y. Liu et al.: Microbial abundance, DOC, and TN in TP glaciers
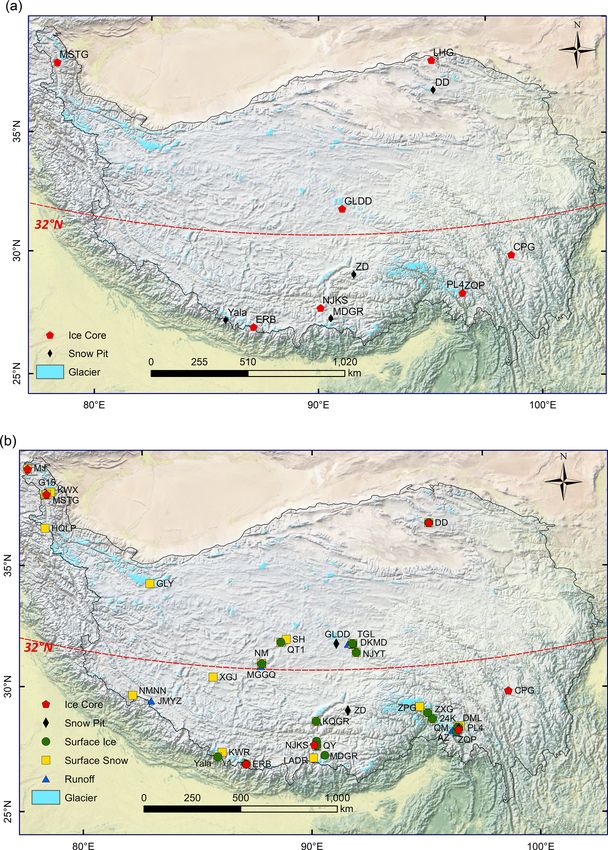
Figure 1. Location of sampled glaciers for microbial abundance (a) as well as DOC and TN (b) on the Tibetan Plateau. The abbreviations
of glacier names are labeled in the map and the full names are available in the Supplement.
4.2 Ice core core. The microbial abundance in ice cores of the seven
sampled glaciers varied substantially, ranging from 63 to
1 130 080 cells mL−1 , and the mean microbial abundances
Microorganisms in glaciers are originated from atmospheric
were 4389, 8617, 44 318, 23 311, 15 648, 27 330, and 19 656
deposition, and it has been reported that microorganisms
cells mL−1 for MSTG, LHG, GLDD, CPG, ZQP, NJKS, and
originating from the Saharan Desert have been found thou-
ERB, respectively. These values generally are in agreement
sands of kilometers away in the Caribbean and European
with previous studies using the flow cytometer method (e.g.,
Alps (Kellogg and Griffin, 2006). The deposited microor-
on the order of 104 –107 in the GISP2 Greenland ice core;
ganisms are subjected to a range of post-depositional en-
Miteva et al., 2009; 6.53 × 10³ –2.89 × 10⁵ cells mL−1 in the
vironmental selection processes (Chen et al., 2022), until
West Antarctic Ice Sheet Divide ice core; Santibáñez et al.,
they are buried by snow and eventually frozen in the ice
Earth Syst. Sci. Data, 14, 2303–2314, 2022 https://doi.org/10.5194/essd-14-2303-2022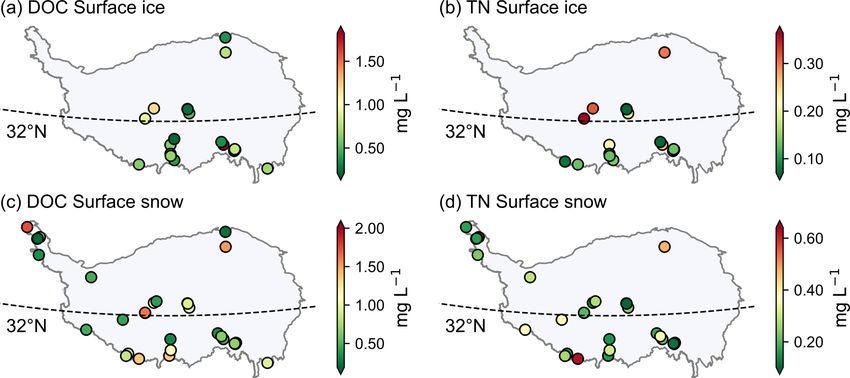
Y. Liu et al.: Microbial abundance, DOC, and TN in TP glaciers                                                                 2307

                                                                     5     Data description of DOC and TN

                                                                     5.1    Ice core

                                                                     Organic carbon and nitrogen in ice cores can be from
                                                                     allochthonous or autochthonous sources. It has been re-
                                                                     ported that the wet DOC deposition ranges from 47 to
                                                                     330 mg C m−2 yr−1 (Yan et al., 2020) and the wet N depo-
                                                                     sition ranges from 44 to 155 mg N m−2 yr−1 on the TP (Liu
                                                                     et al., 2015). In addition, microbial carbon fixation has also
                                                                     been reported in glacier surface microbiome, and the aver-
                                                                     age fixation rate in cryoconite holes of four glaciers on the
                                                                     TP is 1.77 µmol C m−2 d−1 (the yearly rate is approximately
                                                                     3.3 mg C m−2 yr−1 assuming a growing season from May to
                                                                     September; Zhang et al., 2021), which is substantially lower
                                                                     than the atmospheric deposition rate. The microbial nitrogen
                                                                     fixation rate has not been quantified, but a study in the Arctic
Figure 2. Multiyear average air temperature and precipitation of     region has been reported as 0.04 mg N m−2 yr−1 (Telling et
sampled glaciers.                                                    al., 2011), which is again orders of magnitude lower than the
                                                                     atmospheric deposition.
                                                                        The DOC concentrations in ice core samples ranged
                                                                     from 0.005 to 5.05 mg L−1 with an average value
                                                                     of 0.54 ± 0.38 mg L−1 . These values are larger than
                                                                     the englacial DOC concentrations in global mountain
                                                                     glaciers reported by Hood et al. (2015) (0.01–1.20 mg L−1 ,
                                                                     0.29 ± 0.03 mg L−1 on average), which may be related to the
                                                                     higher aerosol concentration of TP (Spracklen et al., 2011).
                                                                     The TN concentrations ranged from 0.001 to 1.15 mg L−1
                                                                     with an average value of 0.24 ± 0.16 mg L−1 . Figure 6 shows
                                                                     the variation in DOC and TN concentrations across the ver-
                                                                     tical profiles in ice cores of the MSTG and ERB glaciers.
                                                                     Generally, there are decreasing trends of DOC and TN with
                                                                     depth, suggesting that atmospheric deposition has been in-
                                                                     creasing in recent years. There exist large inter-annual vari-
                                                                     ations in the serial data with some large values occasionally,
                                                                     which may be related to historical large sand storms.

                                                                     5.2    Surface ice, surface snow, and snow pit
Figure 3. The spatial distribution of log(microbial abundance) for
sampled snow pits (a) and ice cores (b) averaged in each glacier.    The DOC concentrations ranged from 0.08 to 9.0 mg L−1
                                                                     (0.89 ± 1.05 mg L−1 ), from 0.12 to 11.65 mg L−1
                                                                     (1.19 ± 1.78 mg L−1 ), and from 0.05 to 16.15 mg L−1
2016). The spatial distribution pattern of microbial abun-           (0.72 ± 1.71 mg L−1 ) in surface ice, surface snow, and
dance in each ice core is shown in Fig. 3b. Two ice cores in         snow pits, respectively. These values are comparable to
the north (i.e., MSTG and LHG) had a lower microbial abun-           the DOC concentration of surface ice in four TP glaciers
dance (i.e., 4389 and 8958 cells mL−1 , respectively) than           reported by Liu et al. (2016b) (i.e., 1.01 ± 0.22 mg L−1 ),
those in the south where the microbial abundance was at least        and those in surface snow (mean values ranging from
15 688 cells mL−1 . Figure 4 shows the variation of microbial        0.16 to 1.17 mg L−1 ) and snow pits (mean values rang-
abundance along with depth in each ice core. The microbial           ing from 0.21 to 0.81 mg L−1 ) in TP glaciers (Gao et
abundance of ice cores in CPG and NJKS glaciers had de-              al., 2020). The TN concentration ranged from 0.01
creasing trends with depth, while that in the MSTG glacier           to 1.88 mg L−1 (0.19 ± 0.22 mg L−1 ), from 0.07 to
had an increasing trend. There were low-frequency fluctu-            3.06 mg L−1 (0.34 ± 0.35 mg L−1 ), and from 0.02 to
ations observed for the microbial abundance in ice cores of          0.84 mg L−1 (0.15 ± 0.15 mg L−1 ) in surface ice, surface
ERB, GLDD, and LHG glaciers, and there were mainly high-             snow, and snow pits, respectively. Figure 7 shows the spatial
frequency fluctuations in ZQP glacier.                               distribution of DOC and TN concentrations for surface snow

https://doi.org/10.5194/essd-14-2303-2022                                              Earth Syst. Sci. Data, 14, 2303–2314, 2022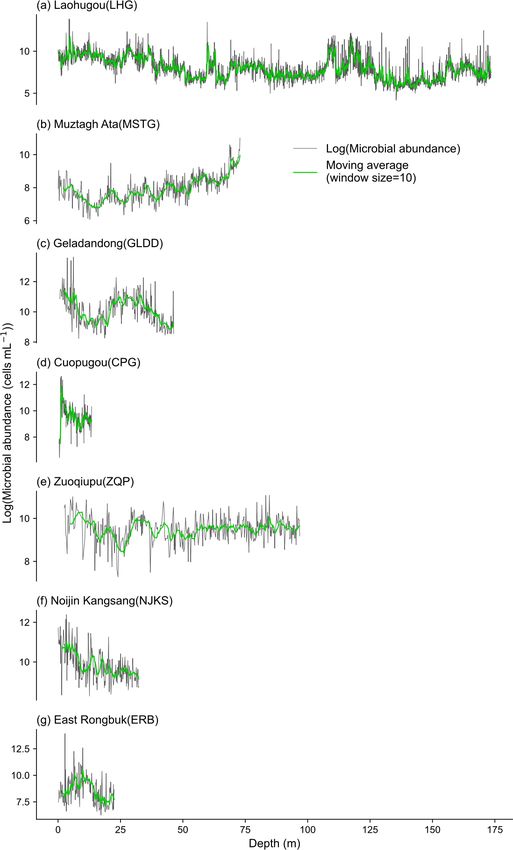
2308                                                            Y. Liu et al.: Microbial abundance, DOC, and TN in TP glaciers

Figure 4. The variation of microbial abundance with depth in each sampled snow pit. The abundance is log-transformed.

and surface ice. For the DOC concentrations of surface                5.3   Runoff
snow, there is a decreasing trend from south to north in the
monsoon dominated region (i.e., located to the south the              The DOC concentration ranged from 0.16 to 4.94 mg L−1
32◦ N). The DOC and TN concentrations in the westerly                 (0.79 ± 0.68 mg L−1 ) in the proglacial runoff, which is con-
wind dominated and monsoon dominated regions were not                 sistent with those observed worldwide (42 glaciers, 0.10–
significantly different (Mann–Whitney U test, p = 0.95).              3.40 mg L−1 ; Li et al., 2018). The TN concentration ranged
The differences in TN concentration between the two regions           from 0.05 to 2.3 mg L−1 (0.29 ± 0.22 mg L−1 ). The runoff
were evident with higher values identified in the westerly            is neutral to alkaline with the pH value ranging from 7.3 to
wind dominated region, although the Mann–Whitney U test               12.4 (9.10 ± 0.88). Figure 8 shows the spatial distribution of
was not significant with a p value of 0.056.                          DOC, TN, NO−     3 concentrations, and pH for the proglacial
                                                                      runoff on the TP. For the DOC concentration of runoff, there
                                                                      was a decreasing trend from west to east. There were signifi-
                                                                      cant differences in the concentrations of TN and NO−  3 in the

Earth Syst. Sci. Data, 14, 2303–2314, 2022                                            https://doi.org/10.5194/essd-14-2303-2022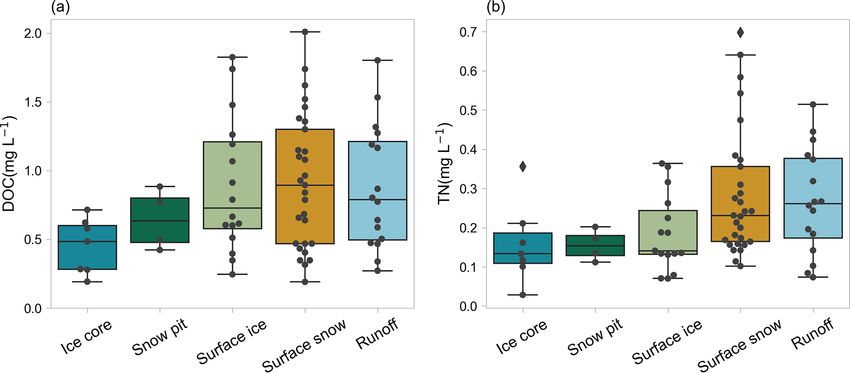
Y. Liu et al.: Microbial abundance, DOC, and TN in TP glaciers                                                                2309

Figure 5. The variation of microbial abundance along depth in seven ice cores. The window size used in the moving average method was
10. Microbial abundance is log-transformed.

https://doi.org/10.5194/essd-14-2303-2022                                           Earth Syst. Sci. Data, 14, 2303–2314, 2022
2310                                                                Y. Liu et al.: Microbial abundance, DOC, and TN in TP glaciers

Figure 6. Variation of DOC (a, c) and TN (b, d) concentrations along vertical profiles in ice cores of the MSTG (Muztagh Ata) glacier (a,
b) and the ERB (East Rongbuk) glacier (c, d).

Figure 7. The spatial distribution of DOC (a, c) and TN (b, d) concentrations for surface ice (a, b) and surface snow (c, d).

runoff between the westerly wind and monsoon regions with                Mann–Whitney U test was not significant with a p value of
p values both less than 0.01 (Mann–Whitney U test) and the               0.07.
values in the westerly wind dominated region were higher.                   Figure 9 shows the diurnal variation of DOC, TN, NO−3,
The pH value was also larger in the westerly wind dominated              and conductivity in proglacial runoff of the Qiangyong
region than in the monsoon dominated region, although the                glacier. No obvious pattern in the diurnal curve of DOC

Earth Syst. Sci. Data, 14, 2303–2314, 2022                                                 https://doi.org/10.5194/essd-14-2303-2022
Y. Liu et al.: Microbial abundance, DOC, and TN in TP glaciers                                                                      2311

Figure 8. The spatial distribution of DOC (a), TN (b), NO−
                                                         3 (c) concentrations, and pH (d) for proglacial runoff on the Tibetan Plateau.

Figure 9. The 24 h time series of DOC (a), TN (b), conductivity (c), and NO−
                                                                           3 (d) in proglacial runoff of the Qiangyong glacier.

was observed, while there were obvious unimodal patterns                similar to those in surface snow (Mann–Whitney U test,
for TN, NO− 3 , and conductivity. These observations are very           P = 0.95 and 1.0 for DOC and TN, respectively).
helpful for biogeochemical studies at fine temporal resolu-
tions.                                                                  6   Data availability

                                                                        The dataset of microbial abundance, DOC, and TN in the
5.4   Comparison among different habitats                               ice core, snow pit, surface ice, and snow from the Ti-
                                                                        betan Plateau glaciers are accessible at the National Tibetan
The DOC and TN concentrations were compared among the                   Plateau/Third Pole Environment Data Center (https://doi.org/
various glacial habitats (ice core, snow pits, surface ice, sur-        10.11888/Cryos.tpdc.271841, Liu, 2021).
face snow, and proglacial runoff). The result showed that
the DOC concentration in ice core was significantly lower               7   Conclusions
than that in surface ice (Mann–Whitney–Wilcoxon test, P =
0.02), while the differences of TN in ice core and surface ice          We constructed a dataset of microbial abundance, DOC, and
were not significant (P = 0.24). The DOC and TN concen-                 TN for glaciers on the TP. The dataset comprises 5409 micro-
trations were also lower in snow pits than in surface snow.             bial abundance data from 12 glaciers and 2532 DOC and TN
The difference was not significant for DOC with a p value               data from 38 glaciers. The sampled glaciers cover diverse ge-
of 0.19 and was significant for TN with a p value of 0.03.              ographic and climatic regions, which makes the dataset qual-
The DOC and TN concentrations in proglacial runoff were                 ified for large-scale studies across the TP. This systematic

https://doi.org/10.5194/essd-14-2303-2022                                               Earth Syst. Sci. Data, 14, 2303–2314, 2022
2312 Y. Liu et al.: Microbial abundance, DOC, and TN in TP glaciers
Figure 10. The boxplots of the DOC (a) and TN (b) concentrations in five main glacial habitats on the Tibetan Plateau.
dataset can provide important information on carbon and ni- Acknowledgements. We would like to thank Keshao Liu and
trogen cycles in glacial ecosystems. It can be used to eval- Feng Wang for their great support in data checking and processing.
uate the response of carbon and nitrogen cycling to global
climate change, and to estimate the impact of glacier melt-
ing on downstream ecosystems such as glacier-fed streams Financial support. This research has been supported by the Na-
and lakes. The time-series data of microbial abundance in ice tional Key Research and Development Program of China (grant
cores can be used as an indicator of past climate change, and no. 2019YFC1509103), the Second Tibetan Plateau Scientific Ex-
pedition and Research program (grant no. 2019QZKK0503), and
the spatial distribution of DOC and TN data can be used to
the National Natural Science Foundation of China (grant nos.
estimate the storage and spatial distribution of glacier carbon
U21A20176 and 42171132).
and nitrogen, which are essential inputs for biogeochemical
models of glacial ecosystems. Considering its broad spatial
and temporal coverage, this dataset can serve as an important Review statement. This paper was edited by David Carlson and
data source for forecasting the impact of warming on glacial reviewed by Arwyn Edwards and one anonymous referee.
carbon and nitrogen cycles at regional and even global scales.
Supplement. The supplement related to this article is available References
online at: https://doi.org/10.5194/essd-14-2303-2022-supplement.
Anesio, A. M. and Laybourn-Parry, J.: Glaciers and ice
sheets as a biome, Trends Ecol. Evol., 27, 219–225,
Author contributions. YL and JL designed the study and wrote
https://doi.org/10.1016/j.tree.2011.09.012, 2012.
the manuscript. PF and JL compiled and analyzed the dataset. YL, Anesio, A. M., Lutz, S., Chrismas, N. A. M., and Benning, L. G.:
BG, MJ, PL, GM, BX, and SK performed field sampling and ex- The microbiome of glaciers and ice sheets, npj Biofilms Micro-
perimental measurement. All authors contributed to the writing and biomes, 3, 10, https://doi.org/10.1038/s41522-017-0019-0, 2017.
editing of this paper. Chen, Y., Liu, K., Liu, Y., Vick-Majors, T. J., Wang, F., and Ji,
M.: Temporal variation of bacterial community and nutrients
in Tibetan glacier snowpack, The Cryosphere, 16, 1265–1280,
https://doi.org/10.5194/tc-16-1265-2022, 2022.
Competing interests. The contact author has declared that nei-
Dubnick, A., Wadham, J., Tranter, M., Sharp, M., Orwin, J., Barker,
ther they nor their co-authors have any competing interests.
J., Bagshaw, E., and Fitzsimons, S.: Trickle or treat: The dynam-
ics of nutrient export from polar glaciers, Hydrol. Process., 31,
1776–1789, https://doi.org/10.1002/hyp.11149, 2017.
Disclaimer. Publisher’s note: Copernicus Publications remains Fell, S. C., Carrivick, J. L., Cauvy-Fraunié, S., Crespo-Pérez, V.,
neutral with regard to jurisdictional claims in published maps and Hood, E., Randall, K. C., Nicholass, K. J. M., Tiegs, S. D.,
institutional affiliations. Dumbrell, A. J., and Brown, L. E.: Fungal decomposition of
river organic matter accelerated by decreasing glacier cover, Nat.
Clim. Change, 11, 349–353, https://doi.org/10.1038/s41558-
Special issue statement. This article is part of the special issue 021-01004-x, 2021.
“Extreme environment datasets for the three poles”. It is not associ- Fellman, J. B., Hood, E., Raymond, P. A., Hudson, J., Bozeman,
ated with a conference. M., and Arimitsu, M.: Evidence for the assimilation of ancient
glacier organic carbon in a proglacial stream food web, Limnol.
Earth Syst. Sci. Data, 14, 2303–2314, 2022 https://doi.org/10.5194/essd-14-2303-2022Y. Liu et al.: Microbial abundance, DOC, and TN in TP glaciers 2313 Oceanogr., 60, 1118–1128, https://doi.org/10.1002/lno.10088, Lazzaro, A., Wismer, A., Schneebeli, M., Erny, I., and 2015. Zeyer, J.: Microbial abundance and community structure in Fillinger, L., Hürkamp, K., Stumpp, C., Weber, N., Forster, a melting alpine snowpack, Extremophiles, 19, 631–642, D., Hausmann, B., Schultz, L., and Griebler, C.: Spatial https://doi.org/10.1007/s00792-015-0744-3, 2015. and Annual Variation in Microbial Abundance, Com- Li, X., Ding, Y., Xu, J., He, X., Han, T., Kang, S., Wu, Q., Mika, munity Composition, and Diversity Associated With S., Yu, Z., and Li, Q.: Importance of Mountain Glaciers as a Alpine Surface Snow, Front. Microbiol., 12, 781904, Source of Dissolved Organic Carbon, J. Geophys. Res.-Earth, https://doi.org/10.3389/fmicb.2021.781904, 2021. 123, 2123–2134, https://doi.org/10.1029/2017JF004333, 2018. Gao, T., Kang, S., Zhang, Y., Sprenger, M., Wang, F., Du, Liu, K., Liu, Y., Hu, A., Wang, F., Zhang, Z., Yan, Q., Ji, M., and W., Wang, X., and Wang, X.: Characterization, sources and Vick-Majors, T. J.: Fate of glacier surface snow-originating bac- transport of dissolved organic carbon and nitrogen from a teria in the glacier-fed hydrologic continuums, Environ. Micro- glacier in the Central Asia, Sci. Total Environ., 725, 138346, biol., 23, 6450–6462, https://doi.org/10.1111/1462-2920.15788, https://doi.org/10.1016/j.scitotenv.2020.138346, 2020. 2021. Greenberg, A. E., Clesceri, L. S., and Andrew, D. E.: Standard Liu, S., Yao, X., Guo, W., Xu, J., Shangguan, D., Wei., J., Bao., W., methods for the examination of water and wastewater, 18th edn., and Wu., L.: The contemporary glaciers in China based on the American Public Health Association, Washington, DC, USA, Second Chinese Glacier Inventory, Acta Geographica Sinica, 70, ISBN 0875532071, 1992. 3–16, 2015 (in Chinese). Hammes, F., Berney, M., Wang, Y., Vital, M., Köster, O., Liu, Y.: Dataset of microbial abundance, dissolved or- and Egli, T.: Flow-cytometric total bacterial cell counts ganic carbon, and total nitrogen in Tibetan Plateau as a descriptive microbiological parameter for drink- glaciers, National Tibetan Plateau Data Center [data set], ing water treatment processes, Water Res., 42, 269–277, https://doi.org/10.11888/Cryos.tpdc.271841, 2021. https://doi.org/10.1016/j.watres.2007.07.009, 2008. Liu, Y., Priscu, J. C., Yao, T., Vick-Majors, T. J., Xu, B., Jiao, N., Hodson, A., Anesio, A. M., Tranter, M., Fountain, A., Osborn, M., Santibáñez, P., Huang, S., Wang, N., Greenwood, M., Michaud, Priscu, J., Laybourn-Parry, J., and Sattler, B.: Glacial ecosystems, A. B., Kang, S., Wang, J., Gao, Q., and Yang, Y.: Bacte- Ecol. Monogr., 78, 41–67, https://doi.org/10.1890/07-0187.1, rial responses to environmental change on the Tibetan Plateau 2008. over the past half century, Environ. Microbiol., 18, 1930–1941, Hood, E., Fellman, J., Spencer, R. G. M., Hernes, P. J., Edwards, https://doi.org/10.1111/1462-2920.13115, 2016a. R., D’Amore, D., and Scott, D.: Glaciers as a source of ancient Liu, Y., Xu, J., Kang, S., Li, X., and Li, Y.: Storage of dissolved and labile organic matter to the marine environment, Nature, 462, organic carbon in Chinese glaciers, J. Glaciol., 62, 402–406, 1044–1047, https://doi.org/10.1038/nature08580, 2009. https://doi.org/10.1017/jog.2016.47, 2016b. Hood, E., Battin, T. J., Fellman, J., O’Neel, S., and Spencer, R. G. Liu, Y. W., Xu-Ri, Wang, Y. S., Pan, Y. P., and Piao, S. L.: Wet M.: Storage and release of organic carbon from glaciers and ice deposition of atmospheric inorganic nitrogen at five remote sites sheets, Nat. Geosci., 8, 91–96, https://doi.org/10.1038/ngeo2331, in the Tibetan Plateau, Atmos. Chem. Phys., 15, 11683–11700, 2015. https://doi.org/10.5194/acp-15-11683-2015, 2015. Hu, Z., Kang, S., Yan, F., Zhang, Y., Li, Y., Chen, P., Qin, Mao, G., Ji, M., Xu, B., Liu, Y., and Jiao, N.: Variation of High X., Wang, K., Gao, S., and Li, C.: Dissolved organic carbon and Low Nucleic Acid-Content Bacteria in Tibetan Ice Cores fractionation accelerates glacier-melting: A case study in the and Their Relationship to Black Carbon, Front. Microbiol., 13, northern Tibetan Plateau, Sci. Total Environ., 627, 579–585, 844432, https://doi.org/10.3389/fmicb.2022.844432, 2022. https://doi.org/10.1016/j.scitotenv.2018.01.265, 2018. Marie, D., Partensky, F., Jacquet, S., and Vaulot, D.: Enumera- Immerzeel, W. W., van Beek, L. P. H., and Bierkens, M. F. P.: Cli- tion and cell cycle analysis of natural populations of marine pi- mate Change Will Affect the Asian Water Towers, Science, 328, coplankton by flow cytometry using the nucleic acid stain SYBR 1382, https://doi.org/10.1126/science.1183188, 2010. Green I, Appl. Environ. Microbiol., 63, 186–193, 1997. Irvine-Fynn, T. D. L., Edwards, A., Stevens, I. T., Mitchell, A. C., Miteva, V., Teacher, C., Sowers, T., and Brenchley, J.: Compari- Bunting, P., Box, J. E., Cameron, K. A., Cook, J. M., Naegeli, son of the microbial diversity at different depths of the GISP2 K., Rassner, S. M. E., Ryan, J. C., Stibal, M., Williamson, C. Greenland ice core in relationship to deposition climates, En- J., and Hubbard, A.: Storage and export of microbial biomass viron. Microbiol., 11, 640–656, https://doi.org/10.1111/j.1462- across the western Greenland Ice Sheet, Nat. Commun., 12, 2920.2008.01835.x, 2009. 3960, https://doi.org/10.1038/s41467-021-24040-9, 2021. Prest, E. I., Hammes, F., Kötzsch, S., van Loosdrecht, M. C. Kang, S., Zhang, Y., Chen, P., Guo, J., Zhang, Q., Cong, Z., Kas- M., and Vrouwenvelder, J. S.: Monitoring microbiological pari, S., Tripathee, L., Gao, T., Niu, H., Zhong, X., Chen, X., changes in drinking water systems using a fast and repro- Hu, Z., Li, X., Li, Y., Neupane, B., Yan, F., Rupakheti, D., Gul, ducible flow cytometric method, Water Res., 47, 7131–7142, C., Zhang, W., Wu, G., Yang, L., Wang, Z., and Li, C.: Black https://doi.org/10.1016/j.watres.2013.07.051, 2013. carbon and organic carbon dataset over the Third Pole, Earth Santibáñez, P. A., Mcconnell, J. R., and Priscu, J. C.: A flow cy- Syst. Sci. Data, 14, 683–707, https://doi.org/10.5194/essd-14- tometric method to measure prokaryotic records in ice cores: an 683-2022, 2022. example from the West Antarctic Ice Sheet Divide drilling site, Kellogg, C. A. and Griffin, D. W.: Aerobiology and the global J. Glaciol., 62, 655–673, https://doi.org/10.1017/jog.2016.50, transport of desert dust, Trends Ecol. Evol., 21, 638–644, 2016. https://doi.org/10.1016/j.tree.2006.07.004, 2006. https://doi.org/10.5194/essd-14-2303-2022 Earth Syst. Sci. Data, 14, 2303–2314, 2022
2314                                                                    Y. Liu et al.: Microbial abundance, DOC, and TN in TP glaciers

Shi., Y. and Liu., S.: Estimation of the response of Chinese glaciers       Yan, F., Wang, P., Kang, S., Chen, P., Hu, Z., Han, X., Sil-
   to global warming in the 21st century, Sci. Bull., 45, 434–438,            lanpää, M., and Li, C.: High particulate carbon deposi-
   2000 (in Chinese).                                                         tion in Lhasa – a typical city in the Himalayan–Tibetan
Singer, G. A., Fasching, C., Wilhelm, L., Niggemann, J., Steier, P.,          Plateau due to local contributions, Chemosphere, 247, 125843,
   Dittmar, T., and Battin, T. J.: Biogeochemically diverse organic           https://doi.org/10.1016/j.chemosphere.2020.125843, 2020.
   matter in Alpine glaciers and its downstream fate, Nat. Geosci.,         Yao, T., Xiang, S., Zhang, X., Wang, N., and Wang, Y.: Microor-
   5, 710–714, https://doi.org/10.1038/ngeo1581, 2012.                        ganisms in the Malan ice core and their relation to climatic and
Smith, H. J., Foster, R. A., McKnight, D. M., Lisle, J. T., Littmann,         environmental changes, Global Biogeochem. Cy., 20, GB1004,
   S., Kuypers, M. M. M., and Foreman, C. M.: Microbial formation             https://doi.org/10.1029/2004GB002424, 2006.
   of labile organic carbon in Antarctic glacial environments, Nat.         Yao, T., Thompson, L., Yang, W., Yu, W., Gao, Y., Guo,
   Geosci., 10, 356–359, https://doi.org/10.1038/ngeo2925, 2017.              X., Yang, X., Duan, K., Zhao, H., Xu, B., Pu, J., Lu,
Spracklen, D. V., Jimenez, J. L., Carslaw, K. S., Worsnop, D. R.,             A., Xiang, Y., Kattel, D. B., and Joswiak, D.: Differ-
   Evans, M. J., Mann, G. W., Zhang, Q., Canagaratna, M. R.,                  ent glacier status with atmospheric circulations in Tibetan
   Allan, J., Coe, H., McFiggans, G., Rap, A., and Forster, P.:               Plateau and surroundings, Nat. Clim. Change, 2, 663–667,
   Aerosol mass spectrometer constraint on the global secondary               https://doi.org/10.1038/nclimate1580, 2012.
   organic aerosol budget, Atmos. Chem. Phys., 11, 12109–12136,             Yao, T., Xue, Y., Chen, D., Chen, F., Thompson, L., Cui, P., Koike,
   https://doi.org/10.5194/acp-11-12109-2011, 2011.                           T., Lau, W. K.-M., Lettenmaier, D., and Mosbrugger, V.: Re-
Telling, J., Anesio, A. M., Tranter, M., Irvine-Fynn, T., Hod-                cent third pole’s rapid warming accompanies cryospheric melt
   son, A., Butler, C., and Wadham, J.: Nitrogen fixation on Arc-             and water cycle intensification and interactions between mon-
   tic glaciers, Svalbard, J. Geophys. Res.-Biogeo., 116, G03039,             soon and environment: Multidisciplinary approach with observa-
   https://doi.org/10.1029/2010JG001632, 2011.                                tions, modeling, and analysis, B. Am. Meteorol. Soc., 100, 423–
Tian, L., Masson-Delmotte, V., Stievenard, M., Yao, T., and Jouzel,           444, https://doi.org/10.1175/BAMS-D-17-0057.1, 2019.
   J.: Tibetan Plateau summer monsoon northward extent revealed             Zhang, S. H., Hou, S. G., Yang, G. L., and Wang, J.
   by measurements of water stable isotopes, J. Geophys. Res.-                H.: Bacterial community in the East Rongbuk Glacier,
   Atmos., 106, 28081–28088, 2001.                                            Mt. Qomolangma (Everest) by culture and culture-
Wadham, J. L., Hawkings, J., Telling, J., Chandler, D., Alcock,               independent methods, Microbiol. Res., 165, 336–345,
   J., O’Donnell, E., Kaur, P., Bagshaw, E., Tranter, M., Tedstone,           https://doi.org/10.1016/j.micres.2009.08.002, 2010.
   A., and Nienow, P.: Sources, cycling and export of nitrogen              Zhang, X. F., Yao, T. D., Tian, L. D., Xu, S. J., and An, L.
   on the Greenland Ice Sheet, Biogeosciences, 13, 6339–6352,                 Z.: Phylogenetic and Physiological Diversity of Bacteria Iso-
   https://doi.org/10.5194/bg-13-6339-2016, 2016.                             lated from Puruogangri Ice Core, Microb. Ecol., 55, 476–488,
Van Nevel, S., Koetzsch, S., Proctor, C. R., Besmer, M. D.,                   https://doi.org/10.1007/s00248-007-9293-3, 2008.
   Prest, E. I., Vrouwenvelder, J. S., Knezev, A., Boon, N., and            Zhang, Y., Kang, S., Wei, D., Luo, X., Wang, Z., and Gao, T.:
   Hammes, F.: Flow cytometric bacterial cell counts challenge                Sink or source? Methane and carbon dioxide emissions from cry-
   conventional heterotrophic plate counts for routine microbio-              oconite holes, subglacial sediments, and proglacial river runoff
   logical drinking water monitoring, Water Res., 113, 191–206,               during intensive glacier melting on the Tibetan Plateau, Fundam.
   https://doi.org/10.1016/j.watres.2017.01.065, 2017.                        Res., 1, 232–239, https://doi.org/10.1016/j.fmre.2021.04.005,
Wang, Q., Yi, S., and Sun, W.: Continuous Estimates of Glacier                2021.
   Mass Balance in High Mountain Asia Based on ICESat-1,2
   and GRACE/GRACE Follow-On Data, Geophys. Res. Lett., 48,
   e2020GL090954, https://doi.org/10.1029/2020GL090954, 2021.
Xiang, S.-R., Shang, T.-C., Chen, Y., Jing, Z.-F., and Yao,
   T.: Changes in diversity and biomass of bacteria along
   a shallow snow pit from Kuytun 51 Glacier, Tianshan
   Mountains, China, J. Geophys. Res.-Biogeo., 114, G04008,
   https://doi.org/10.1029/2008JG000864, 2009.

Earth Syst. Sci. Data, 14, 2303–2314, 2022                                                   https://doi.org/10.5194/essd-14-2303-2022
You can also read