A derived honey bee stock confers resistance to Varroa destructor and associated viral transmission
←
→
Page content transcription
If your browser does not render page correctly, please read the page content below
www.nature.com/scientificreports
OPEN A derived honey bee stock confers
resistance to Varroa destructor
and associated viral transmission
Thomas A. O’Shea‑Wheller1*, Frank D. Rinkevich2, Robert G. Danka2,
Michael Simone‑Finstrom2, Philip G. Tokarz2 & Kristen B. Healy3
The ectoparasite Varroa destructor is the greatest threat to managed honey bee (Apis mellifera)
colonies globally. Despite significant efforts, novel treatments to control the mite and its vectored
pathogens have shown limited efficacy, as the host remains naïve. A prospective solution lies in the
development of Varroa-resistant honey bee stocks, but a paucity of rigorous selection data restricts
widespread adoption. Here, we characterise the parasite and viral dynamics of a Varroa-resistant
honey bee stock, designated ‘Pol-line’, using a large-scale longitudinal study. Results demonstrate
markedly reduced Varroa levels in this stock, diminished titres of three major viruses (DWV-A,
DWV-B, and CBPV), and a two-fold increase in survival. Levels of a fourth virus that is not associated
with Varroa—BQCV—do not differ between stocks, supporting a disruption of the transmission
pathway. Further, we show that when decoupled from the influence of Varroa levels, viral titres do not
constitute strong independent predictors of colony mortality risk. These findings highlight the need
for a reassessment of Varroa etiology, and suggest that derived stocks represent a tractable solution
to the Varroa pandemic.
Honey bee (Apis mellifera) colony losses constitute a severe and ubiquitous concern for both the migratory pol-
lination industry, and modern agricultural security in general1–4. High annual mortality has become a pervasive
facet of commercial pollination, despite significant scientific and legislative efforts to curtail i t5,6. In the United
States alone, current figures place 2018–2019 mortality at 37.5% for commercial beekeeping operations, rising
substantially from a 13-year average of 28.8%7,8. The causes of this are myriad, and the interrelated nature of
extraneous stressors upon colony health makes defining the principle interactions difficult9,10. Despite such inher-
ent system complexity, however, the parasitic mite Varroa destructor repeatedly emerges as the single greatest
driver of global colony l osses1,11–13.
Varroa is associated with varied pathologies, including developmental disruption, immunosuppression, and
behavioural alteration14–16. An extensive body of research demonstrates that the mite vectors and amplifies a
plethora of viral pathogens17, several of which are strongly associated with colony mortality12,18,19, and the discov-
ery of novel viral types is ongoing20. Additionally, recent work has shown that the process of Varroa feeding per
se may cause significant damage, as these mites consume the honey bee hosts’ fat body—an organ with numerous
vital functions12,21. Despite containment efforts, Varroa has continued its 50-year global expansion into formerly
uninfested regions1,13,22,23 with concordant implications for managed and wild pollinators1,24. Simultaneously,
established mite populations show increasing resistance to acaricide treatments, which currently constitute the
efence17,25–28. As such, the ongoing threat presented by this pandemic, and its rapid prolif-
last effective line of d
eration through industrialised agricultural s ystems29,30, is both immediate, and severe.
A promising, sustainable solution in the effort to mitigate Varroa, lies in the development of Varroa-resistant
honey bee s tocks17,31,32. This approach has advantages over other management strategies, in that it is both inte-
grated, and less susceptible to the simple evolutionary adaptations that threaten chemical methods17,33,34. In
natural A. mellifera populations, cases of resistance to Varroa mites have been widely reported35–37. Due to the
devastating nature of infestation absent management, natural selection for colonies able to resist, or coexist, is
rapid, and intense38. Survival mechanisms are varied, although there is some evidence to indicate convergent
trait selection in isolated populations17,37. Notably however, many of the mechanisms that predispose colonies to
Varroa-resistance in nature, such as smaller colony sizes and increased swarming frequencies38–40, are antithetical
1
Environment and Sustainability Institute, University of Exeter, Penryn TR109FE, Cornwall, UK. 2USDA ARS, Honey
Bee Breeding, Genetics and Physiology Laboratory, Baton Rouge, LA 70820, USA. 3Department of Entomology,
Louisiana State University, 404 Life Sciences Building, Baton Rouge, LA 70803, USA. *email: t.a.oshea-wheller@
exeter.ac.uk
Scientific Reports | (2022) 12:4852 | https://doi.org/10.1038/s41598-022-08643-w 1
Vol.:(0123456789)www.nature.com/scientificreports/
to the characteristics most valued in commercial beekeeping17. Indeed, the intensified nature of Varroa-host
dynamics in managed operations41,42, combined with the evolutionary novelty of the association43, necessitates
resistance mechanisms that are tailored to extreme conditions. Consequently, the selection of heritable resistance
traits suited to commercial beekeeping, along with the maintenance of favourable colony-level characteristics,
is a significant challenge for breeding e fforts17,38.
Major programs to develop Varroa-resistant commercial stocks are ongoing38, with emerging support from
marker-assisted selection (MAS)44,45, and ‘omics t echnologies46. Artificially selected traits, including Varroa-
sensitive hygiene (VSH), in which workers remove mite-infested b rood47–49; low mite population growth (low
MPG), which comprises a suite of behaviours limiting Varroa reproduction50,51; and auto-/allo-grooming, the
processes of removing and/or damaging phoretic m ites52,53, have shown promise in commercial s cenarios17,38,54.
The adoption of resultant lines, however, has been limited54, ostensibly due to varying real-world e fficacy31,32,55,
a paucity of controlled large-scale trials with which to validate commercial viability38,56,57, and the challenges
of scalability in breeding efforts58,59. These factors engender industry-wide inertia to the effective integration of
Varroa-resistant honey bees, and subsequently, the globally managed A. mellifera population remains adaptively
naïve—and thus acutely susceptible—to Varroa parasitism.
Here, we employ a controlled longitudinal analysis, to assess the performance of a novel and genetically
distinct Varroa-resistant honey bee stock, ‘Pol-line’54,60. This stock is unique, in that it possesses the substantial
mite-resistance of VSH b ehaviour61, combined with the desirable beekeeping characteristics of commercial
Italian colonies; including large population size, substantial honey production, and docile temperament54. We
utilised a year-long experimental design, comparatively analysing Pol-line and commercial Italian honey bees,
in which all colonies were individually tracked, and parasite, pathogen, and health measures taken at key time
points. Colonies were integrated into a migratory operation in the USA, focussing on almond pollination and
honey production, and spanning the states of Mississippi, South Dakota, and California. This system is notable,
as it constitutes one of the most intensive and stressful scenarios in modern b eekeeping62,63, while simultaneously
64
incorporating three distinct Köppen–Geiger climate z ones . As such, it provides a rigorous test of the functional-
ity of colonies, and is not limited to localised applicability. The study design manipulated acaricide application,
migration route, and colony management, to compare the performance of both stocks, while monitoring Varroa
levels, and associated viral pathogen titres, with high fidelity.
In addition to assessing the functionality of Pol-line honey bees, we utilised our experimental system to
examine the relative influences of Varroa and its associated viruses upon mortality in the field, along with the
predictive utility of both for informing colony prognoses. While the influence of Varroa upon viral dissemination
and amplification has been investigated e xtensively10,17, the specific impacts of Varroa feeding per se, versus those
of the viruses that it transmits, remain poorly understood at the bipartite l evel12,17,29. This paucity of information
arises from the difficulty of isolating either factor effectively, given their tightly coupled nature, and the requisite
cost of controlled field s tudies1,12,65–67.
Current understanding places the RNA picornavirus Deformed wing virus (DWV)—specifically the master
variants DWV-A68, and DWV-B69—as the prime viral threat to colony h ealth70. Impetus for this is derived from
the correlation that DWV exhibits with colony mortality, and the disseminative properties of the virus when
vectored by Varroa23,71. In the presence of Varroa infestation, DWV can increase from latent levels of 6–13%,
up to 100% prevalence in colonies, accompanied by a million-fold increase in viral titres within 3 years1,22. In
tandem, there is evidence for the recombination of DWV strains, leading to more virulent hybrid forms, and
crucially, selection for these forms when transmitted as a viral admixture, via Varroa feeding68,70,72. While the
prevalence of DWV is well established, investigations of the role of viral diversity and propagation in determin-
ing pathogenicity have shown inconsistent r esults68,73–78, and surprisingly, some studies linking the virus to
mortality do not account for the effect of Varroa levels on colony outcome73,79–81. The latter may be symptomatic
of conceptualising Varroa as a viral vector first, and damaging agent second; however this view is inconsistent
with both the mite’s biology12,17, and established large-scale datasets67,76,82,83.
Aside from the known Varroa-vectored viruses, certain other pathogens exhibit Varroa association, although
their exact relationship with the mites is u nclear17. One such case is the taxonomically unassigned RNA virus,
Chronic bee paralysis virus (CBPV)84,85. Despite being one of the first described honey bee v iruses86, CBPV is
comparatively under-studied. However, it is known to cause mortality in adult b ees84, to correlate with colony
losses87–89, and has a wide host range86,90, with an increasing global incidence86,91. Notably, CBPV can exist at
covert levels in healthy colonies, may increase in prevalence in the presence of Varroa parasitism92–94, and has
been detected in Varroa90,95. A direct transmission pathway remains elusive, however84, and observational studies
suggest variable a ssociation90,96.
Another potential Varroa associate is the RNA picornavirus Black queen cell virus (BQCV)17,97,98. BQCV is
highly prevalent globally97, causes fatal infections in queen larvae99, and yet generally remains asymptomatic in
adult workers98,99, showing limited association with colony losses100,101. As with CBPV, BQCV has been detected
in Varroa95,102, and there is evidence for increased transmission to other hosts when the mites are p resent103.
Notably however, while some studies have found that BQCV titres are influenced by Varroa infestation22,104,
others indicate that the virus is decoupled from Varroa levels in c olonies105–107, and conclusive proof of Var-
roa transmission is yet to be a scertained22. The former point is salient, as current understanding suggests that
although Varroa-mediated transmission of BQCV may be feasible, its occurrence is, at most, r are98. Hence,
quantifying this somewhat cryptic relationship will be of utility to the wider study of Varroa-virus dynamics.
Conflicting findings from etiological studies of D WV66,73,76,81,108, CBPV90,94,106,109, and B QCV17,95,105, exacer-
bated by a historically inaccurate research paradigm for Varroa feeding, which appears to have underestimated
direct damage to the fat body12, exemplify the need for ongoing characterisation of Varroa-virus mediated colony
mortality. Until this process is better understood, it remains an obstacle to effective treatment, because there is
no clear consensus as to the relative importance of covariate f actors1,12,66,110,111.
Scientific Reports | (2022) 12:4852 | https://doi.org/10.1038/s41598-022-08643-w 2
Vol:.(1234567890)www.nature.com/scientificreports/
Thus, using the longitudinally tracked colonies in our experimental setup, we tested the influence of Varroa
levels, and DWV-A, DWV-B, CBPV, and BQCV titres, on colony mortality. This constituted an assessment of
viruses both tightly (DWV-A and DWV-B), and loosely (CBPV and BQCV), linked to Varroa parasitism. We
then controlled for Varroa levels, grouping colonies by mite infestation strata, to characterise the relative additive
predictive power of each virus in determining colony mortality, using an epidemiological approach. As such, we
aimed to evaluate the performance of a novel Varroa-resistant honey bee stock, while simultaneously investigat-
ing the specific factor weightings of Varroa-mediated colony mortality.
Materials and methods
Colonies. Colony setup occurred prior to initiation of the study, between March and May 2017, in Mis-
sissippi, USA. Using established methods, queenless colony divisions, obtained from a large commercial bee-
keeping operation, were equalised to an average calculated population size of ~ 7000 w orkers112, and housed
in 10-frame Langstroth hives (Table S1). After acclimatisation for 24–48 h, they each received an imminently
emerging queen cell, containing a queen from one of two stocks, added to the same worker baseline. The stocks
used consisted of an Italian ‘Commercial’ stock, propagated from collaborator established breeder queens, and
thus representative of the industry standard, and the Varroa-resistant ‘Pol-line’ s tock54. To ensure consistency,
all queens were reared in the same ‘cell builder’ colonies, based at the USDA Honey Bee Breeding, Genetics and
Physiology Laboratory, in Baton Rouge, Louisiana, USA. Colonies from each stock were held in independent
apiaries, 80 km apart to maintain physical isolation; and to control genetic fidelity, virgin queens were open
mated to drones of the same stock via drone saturation. Fourteen days after queen emergence, colonies were
inspected, and mated queens were marked with paint on the thorax, to assist with identification, with white cor-
responding to Commercial, and blue to Pol-line. Colonies were allowed to acclimatise for six weeks before sam-
pling began, and those that failed to achieve mating success, or had unacceptably high [≥ 3.0 ‘mites per hundred
bees’ (MPHB)] Varroa levels, were removed, normalising the average between-stock Varroa difference to < 0.1
MPHB from the initiation of the study (Table S1). Each colony was then assigned a random ID number, for a
total of 366 colonies; 193 with Commercial queens, and 173 with Pol-line queens. All colonies were provided
with supplemental sucrose solution, and soya-based commercial pollen supplements ad libitum, in accordance
with standard industry practices.
Experimental design. In order to evaluate the effects of migratory pollination procedures, colonies were
randomly assigned to one of three migration route treatments. The migration treatments used were as follows;
a ‘California’ group, consisting of 156 colonies; 80 Commercial and 76 Pol-line, moved to South Dakota in May,
followed by California in October for overwintering and almond pollination, and back to Mississippi at the end
of the study; a ‘Mississippi’ group, consisting of 156 colonies; 80 Commercial and 76 Pol-line, moved to South
Dakota in May, and back to Mississippi via California in October for overwintering; and a ‘Stationary’ group,
consisting of 54 colonies; 32 Commercial and 22 Pol-line, that remained in Mississippi for the duration of the
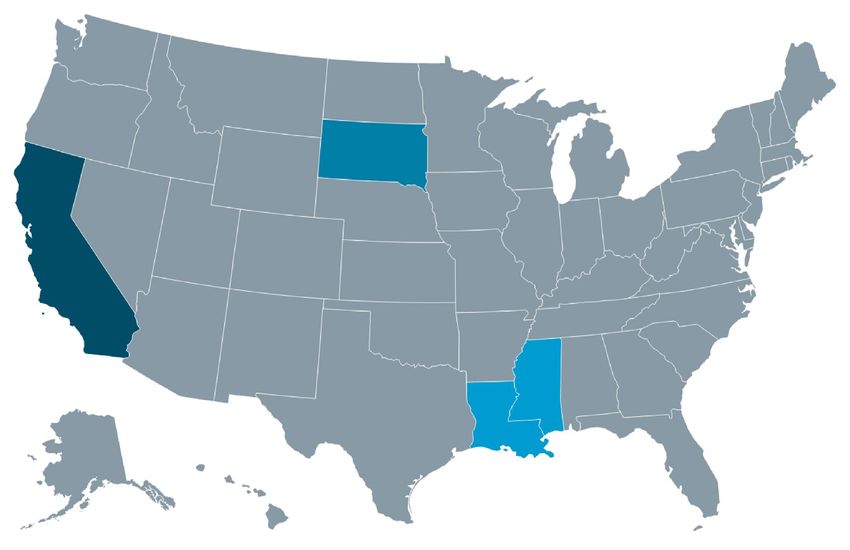
study (Fig. 1). While in South Dakota, colonies were distributed across four apiaries, and in California and Mis-
sissippi, they were held in a single apiary. This practice mirrored standard industry protocol, and provided a
more representative sample by accounting for localised differences in climate and forage.
In addition to migration route, colonies were divided by the frequency of acaricide treatment applied, to better
elucidate the effects of varying infestation strata. Within each migration treatment, and stock, half of the colonies
received a ‘high’ acaricide treatment, and half a ‘low’ acaricide treatment. Colonies in the high treatment group
were treated twice, in September and December; while those in the low treatment group were treated only once,
in December. All treatments were conducted using the acaricide amitraz.
Sampling. Colonies were sampled five times during the course of the study, in May, June, September,
December, and February. For each colony, the queen was examined, and frames of workers, nectar, pollen, and
brood were quantified visually by percentage cover113. Upon observation, if the queen did not have an existing
mark, a single red paint mark was applied to her thorax, to indicate supersedure status. Then, ensuring that the
queen was sequestered to prevent unintentional sampling, two samples of ~ 300 workers were taken in resealable
bags; one being flash frozen with dry ice, and stored at − 80 °C for pathogen analyses; and the other being frozen
with conventional ice, for Varroa analysis. To achieve a representative age sample, workers were removed from
two brood frames, containing sealed and unsealed brood. Workers were evenly mixed using a 20 L bucket, before
collection via a cup-measure, and subsequent assignation to one of the two sample types. The queen was then
returned to the hive, along with any unsampled workers.
Varroa analysis. Varroa analyses were conducted for all colonies, at all five time points. To quantify the level
of Varroa infestation in colonies, a detergent-wash method was e mployed114. The sample of bees was first placed
in a mesh-partitioned cup with a solid base, to allow mite retrieval. Water was then added until the bees were
submerged, and a surfactant-based detergent (Procter & Gamble) mixed in, ensuring an even coating. The lid
of the cup was secured, and it was placed into a Model E5850 reciprocal shaker (Eberbach), to be agitated for a
period of 60 min at 120 rpm. After agitation, the lower faction of the cup was removed, and the contents poured
into a shallow tray, to count the number of mites falling through the mesh. This process was repeated until two
consecutive zero counts were recorded, indicating that all mites had been removed. The bees were then separated
and counted by tally counter, to produce an exact sample size. Finally, the total Varroa count was transformed to
produce a standardised ‘mites per hundred bees’ (MPHB) value, as follows:
Scientific Reports | (2022) 12:4852 | https://doi.org/10.1038/s41598-022-08643-w 3
Vol.:(0123456789)www.nature.com/scientificreports/
SD
CA
MS
LA
California
Mississippi
Both
Figure 1. Migration routes used in the experimental setup. Arrows indicate travel routes, distances, and timings
for each migration group (California, dark blue; Mississippi, light blue; both, dark and light blue). Choropleth
map generated using Datawrapper (release v. 1.25.0).
MPHB = (total mites/total bees) × 100
Pathogen analyses. Four specific viral targets were chosen: DWV-A, DWV-B, CBPV, and BQCV. Anal-
yses were carried out on a randomised subset of 92 colonies from the California and Mississippi migration
groups, divided evenly across stock, and survival outcome. Four major time points were selected: June, Septem-
ber, December, and February. All analyses were conducted using RT-qPCR, following previously established
methods94,115.
RNA extraction. Per colony and time point, pools of 65 bees were randomly selected from the master
samples of ~ 300, placed into 30 ml 19-6358Z bead tubes (Omni), and stored at − 80 °C, for homogenisation
using a Bead Ruptor Elite (Omni). Immediately after homogenisation, 5 ml of homogenisation solution (Pro-
mega), and 4 ml sterile 1xPBS buffer, each at 4 °C, were added to sample tubes, before vortexing for 20 s using
a Vortex-Genie 2 (Scientific Industries). 1.8 ml of each sample was then transferred to 2 ml tubes (Eppendorf),
and centrifuged for 60 s at 5000 rpm, at 4 °C, using a 5430-R centrifuge (Eppendorf). Per sample, 400 μl of the
resultant supernatant was then transferred to Maxwell RSC-48 cartridges (Promega), prepared in accordance
with the manufacturer’s instructions, and RNA extractions were carried out using the Maxwell RSC simplyRNA
tissue protocol (Promega) (Maxwell RSC simplyRNA Tissue Kit, AS1340, TM416, 2019).
Sample purity and yield were then calculated in duplicate, using a NanoDrop One microvolume UV–Vis
spectrophotometer (Thermo Fisher Scientific), and appropriate RNA dilutions were completed to ensure sample
standardisation to 100 ng/μl. Following standardisation, cDNA synthesis was achieved using QuantiTect Reverse
Transcription Kits (Qiagen), utilising a T100 thermal cycler (Bio-Rad), running custom QuantiTect cDNA syn-
thesis protocols (Qiagen) (QuantiTect Reverse Transcription Handbook, 2009). Resultant samples were stored
at − 20 °C, prior to initiation of RT-qPCR analyses.
RT‑qPCR. RT-qPCR was performed on 1 μl aliquots of each sample, in triplicate, in a total reaction volume
of 10 μl, utilising SsoAdvanced Universal SYBR Green Supermix (Bio-Rad), on Multiplate 96-well optical PCR
plates (Bio-Rad). The primers used for quantification of DWV-A116, DWV-B117, CBPV96, and B QCV115 have
been reported previously, and validated for target specificity. For full sequence details, see (Table S2). Negative
controls were included for each target, consisting of 1 μl of nuclease-free H2O (Promega), again run in triplicate.
Additionally, to enable viral quantity mean determination, standard curves were produced for all targets, via
tenfold serial dilutions of known viral quantities, covering 8 orders of magnitude. Linearity ( r2), and reaction
efficiency (E), were maintained at ≥ 0.990, and ≥ 92.5% respectively, for all assays (Table S2). All analyses were
run on CFX Connect Real-Time PCR Detection Systems (Bio-Rad), using previously optimised thermal proto-
cols (Table S3).
Scientific Reports | (2022) 12:4852 | https://doi.org/10.1038/s41598-022-08643-w 4
Vol:.(1234567890)www.nature.com/scientificreports/
Data transformation. Samples were analysed in triplicate, to form a mean Ct value. Any triplicates with a
standard deviation ≥ 1.0 were examined, and the divergent replicate removed, resulting in 26 technical replicate
removals. If this failed to bring the standard deviation to < 1.0, the sample itself was replaced, and removed from
further analyses. Ct means were then quantified against the standard curves for each target, to calculate absolute
viral titres, using the following equation:
Quantity mean = 10((standard curve y - intercept × Ct mean)+(standard curve x - intercept))
ynamics118, these values were then
Due to the wide distribution of quantities inherent to viral replication d
log-transformed, to produce suitable data for further analyses. Where undetected values were present, a constant
Ct mean of 45 was assumed, to allow for subsequent transformation of the d ata105.
Range of assessment factors. Analyses were broadly divided into measurements of colony survival, the
extraneous influences of Varroa levels (MPHB), and viral titres (log10 viral quantity mean per μl cDNA) upon
them, and how stock, mite treatment, and migration route modulated these interactions. Crucially, we exam-
ined both the general effect of Varroa levels and viral titres upon colony survival, and the predictive power of
such measures at seasonally-relevant time points. We additionally determined the explanatory power of viral
titres when colonies were matched for Varroa level, thus elucidating the relative additive influences of Varroa-
transmissible viruses.
Colony and queen survival over time, population size, and honey production. First, the survival of colonies and
queens over time, along with the population sizes of surviving colonies, and honey production, were compared
between the two stocks using time series data collected throughout the course of the study. Colonies were clas-
sified as ‘dead’ when the worker frame-count dropped to < 1.0, and they were confirmed as vacant during any
sequential sampling. This definition of colony death remained consistent across all further analyses. Queens
were classified as ‘dead’ when the existing queen could not be found, and a new unmarked queen, or queen cells,
were present, indicating s upersedure119. Population sizes were compared using worker frame-counts from all
colonies classified as ‘alive’, that is, those with ≥ 1.0 frames at the end of the study, in February. Honey production
was quantified via net weight (kg) of honey extracted per colony during September, excluding colonies in the
stationary migration group, for which extraction was not recorded.
Factors influencing colony survival. We then defined the influences of Varroa levels and viral titres upon colony
survival, using data from all five and four time points, respectively. The effect of each factor, along with stock,
mite treatment, migration route, and their concordant interactions, was quantified. By tracking individual colo-
nies over time, in concert with their Varroa levels, and viral titres, we were able to determine factor effect sizes,
and the interactions leading to death or survival in February. February was chosen as the time point of interest,
as it fell immediately prior to almond pollination, and thus gave a representative, and commercially relevant,
measure of colony strength going into this system. As viral titre measures were taken for a subset of colonies,
separate analyses were conducted for these and Varroa measures, in order to preserve maximum sample sizes
in each case. These data were then used to inform subsequent predictive analyses, based on Varroa levels and
viral titres.
Predictive differences in Varroa levels and viral titres. To assess initial predictive differences in Varroa levels and
viral titres, across survival outcomes and stocks, we linked survival status in February to two predictive time
points: June, and September. Notably, the former of these encompassed the principle period of colony popula-
tion growth, and the latter, of honey harvesting, prior to colony overwintering. These points constitute key junc-
tures at which management decisions must be made, and thus are practically relevant as predictive benchmarks.
In analyses, colonies were classified by stock, or their status as being either alive or dead in February. Varroa
levels and viral titres were then compared between groups, thus representing a basic test of the usefulness of
single time point data in defining outcomes.
Prognostic power of Varroa levels and viral titres. To quantify the epidemiological significance of Varroa levels
and viral titres in determining colony survival, and therefore their predictive power, we conducted relative risk
(RR) analyses for these factors, utilising colony death by February as the outcome of choice. RR is an estab-
lished epidemiological measure, used to determine the probability of a given health outcome when exposed to
a specific risk factor, and thus compare risk m agnitudes120. RR analyses were conducted for both Varroa levels,
and viral titres, again for the predictive time points of June and September. Significant interactions were further
validated with attributable risk (AR) analyses, to provide a measure of effect size; and complementary Bayesian
RR analyses, to visualise the risk probability distribution. Analyses were pooled across stocks, in order to better
encompass the full range of infestation and infection strata. Additionally, they were stratified by Varroa level, to
determine how changes in infestation severity influenced the risk of colony death.
We then isolated the additive effect of viral titres as a predictive factor, independent of Varroa. We considered
this an important test of the stand-alone influence of Varroa-associated pathogens in Varroa-mediated colony
loss, as ordinarily, these factors are difficult to decouple. To achieve this, a subset of 60 colonies were matched by
September Varroa level (mean MPHB, < ± 0.1 between survival outcomes), and left unstratified in terms of viral
titres. September was chosen as the key matching point for this analysis, as colonies showed the highest Varroa
levels and viral titres at this stage, and thus these values were considered most relevant to overwinter survival
outcomes. Colonies were subsequently divided into alive and dead cohorts, based on their status in February, to
Scientific Reports | (2022) 12:4852 | https://doi.org/10.1038/s41598-022-08643-w 5
Vol.:(0123456789)www.nature.com/scientificreports/
produce groups that differed in their survival outcomes, and viral titres, but that had tightly coupled Varroa level
distributions. We then conducted RR analyses for this subset, examining viral titres in both June and September
as predictive factors for colony survival, hence constituting a measure of viral effects, decoupled from Varroa.
Varroa model. To demonstrate the relationship between Varroa level and colony mortality, and generate a pre-
dictive model for treatment prognoses in both stocks, we pooled all colony data into Varroa infestation strata,
derived from Varroa level in September, and assigned resultant percentage mortalities based on survival rates
in each stratum. We then fit curve models to the data for the two stocks, thus enabling a predictive mortality
outcome for the Varroa level and stock in question, based on an extensive empirical dataset.
Statistical analyses. For all pairwise comparison data in which analyses would assume a normal distribu-
tion, we performed Shapiro–Wilk tests to check for normality, and hence inform the application of appropriate
statistical tests. In all cases, the data were not normally distributed, and thus independent sample Mann–Whit-
ney U-tests were employed. For these analyses, we opted to report mean ranks, rather than medians, as based
on descriptive statistics, we did not assume identical frequency distributions between sample groups. Due to the
large sample sizes used, we also considered it important to include a measure of effect size, and this was achieved
via Eta-squared (η2) post hoc t ests121. Additionally, for analyses that were close to the threshold of significance
(0.05–0.06), we cross-verified results by applying parametric methods to transformed data. This occurred in one
case, and after transformation via reflection of the square root, the significance of the test was unaltered.
Cumulative colony and queen survival differences between stocks were assessed using mixed-effects Cox
proportional hazards models, via the R packages ‘coxme’122 and ‘multcomp’123. The proportional hazards assump-
tion was verified in each case by confirming independence between the Schoenfeld residuals and time, for both
the fixed factors and model, using the R package ‘survival’124.
To assess differences between stocks in colony population size and honey production, we utilised generalised
linear models (GLMs). The population size model used February as the response time point, while the honey
production model used September. Model selection was based on AIC, and validated using omnibus tests, along
with assessment of the deviance to degrees of freedom ratios.
To determine how Varroa levels and viral titres influenced colony survival outcome, and how stock, mite
treatment, and migration route modulated these interactions, we employed generalised linear mixed models
(GLMMs) with repeated measures. Separate models were generated for Varroa level and viral titre analyses, in
order to maximise sample sizes, and minimise model complexity. Varroa level measurements were repeated
over five time points, and viral titre measurements over four. Model selection was based on AIC, beginning with
the full model and interactions. In all cases, model fit was validated via evaluation of the binned standardised
residuals.
When testing the predictive power of Varroa levels and viral titres at single time points, we used relative risk
(RR) analyses. All RR analyses made use of an ‘outgroup’ for the epidemiological factor in question, and then
compared the mortality rate in this group to that of an ‘exposure’ group, to ascertain the relative change in risk.
The exposure group in all viral titre analyses was defined as colonies with titres ≥ 1 × 10⁷, a cut-off value indicative
of an epidemiologically severe infection1,96,98, while the outgroup was composed of colonies with titres < 1 × 10⁷.
The exposure groups in the Varroa level analyses were stratified to cover the range of MPHB levels present in
colonies, ≥ 1–2.5, > 2.5–5, > 5–7.5, and > 7.5, and the outgroup was maintained at < 1, thus providing a graded
measure of the change in risk with increasingly severe infestations. RR values greater than one indicated an
associated increase in mortality risk, while those less than one indicated an associated reduction. In accordance
with standard interpretation, RR values were deemed not significant if the resultant 95% confidence intervals
overlapped the value of o ne120. For significant RR values, we also calculated the AR, to demonstrate the magnitude
of absolute effect size, as is recommended for binary epidemiological outcomes125. Significant risk probability
distributions were then visualised via parallel Bayesian RR analyses, using the R package ‘brr’126. Across tests,
we confirmed requisite sample sizes to provide a minimum power (1 − β) of 0.80, at an alpha (α) of 0.05, using
standard deviation (σ) and mean difference (δ) values from the data. All statistical analyses were performed in
PASS (release v. 21.0.2), SPSS (release v. 25.0.0.0), and R (release v. 4.0.2)127.
Colony and queen survival over time. We used mixed-effects Cox proportional hazards models to assess dif-
ferences in colony and queen survival between the two stocks over the course of the study. These utilised stock,
mite treatment, and migration route as fixed factor predictors, and colony ID as a random factor. As sampling
occurred every two months, cumulative survival was updated on a bi-monthly basis, over a 10 month period.
Population size and honey production. The GLM assessing the effect of stock on colony population size used
frame-count of surviving colonies in February as a gamma response variable with a log link, and stock, mite
treatment, and migration route as fixed factor predictors. The GLM assessing the effect of stock on honey pro-
duction used net honey weight in September as a gamma response variable with a log link, stock and mite treat-
ment as fixed factor predictors, and omitted migration route as honey was extracted prior to transport.
Factors influencing colony survival. The GLMM assessing the effect of Varroa levels on colony survival used
colony survival status in February as a binomial response variable with a probit link, Varroa MPHB, stock, mite
treatment, and migration route as fixed factor predictors, their two-way interactions, and colony ID as a random
factor. The GLMM assessing the effect of viral titres on colony survival used colony survival status in February
as a binomial response variable with a logit link, log10 DWV-A titre, log10 DWV-B titre, log10 CBPV titre, log10
Scientific Reports | (2022) 12:4852 | https://doi.org/10.1038/s41598-022-08643-w 6
Vol:.(1234567890)www.nature.com/scientificreports/
a b c
Figure 2. (a) Survival proportions of colonies (solid lines), and queens (dashed lines), of each stock
(Commercial, grey; Pol-line, blue), across the course of the study (NCommercial = 193, NPol-line = 173). Dashed
vertical lines indicate the timings of management events (acaricide treatment, red; migration for overwintering,
grey). Arrows designate the timings of sampling (Varroa sampling, black; Varroa and pathogen sampling,
blue). Significant differences between stocks were present in colony survival (hazard ratio = 0.408, χ2 = 122.800,
d.f. = 1, N = 366, P < 0.001), and queen survival (hazard ratio = 0.355, χ2 = 234.388, d.f. = 1, N = 366, P < 0.001).
(b) Frames of adult bees in surviving colonies in February (NCommercial = 50, NPol-line = 103). Frame counts did not
differ significantly between the two stocks (χ21 = 2.272, N = 153, P = 0.131). (c) Honey production in September
(NCommercial = 141, NPol-line = 137). Honey production did not differ significantly between stocks (χ21 = 0.476,
N = 278, P = 0.490).
BQCV titre, stock, mite treatment, and migration route as fixed factor predictors, their two-way interactions,
and colony ID as a random factor.
Predictive differences in Varroa levels and viral titres. Independent sample Mann–Whitney U-tests were utilised
to compare differences in mean Varroa levels and viral titres, based on colony survival outcome and stock, for
June and September time points.
Prognostic power of Varroa levels and viral titres. To quantify the relative predictive powers of Varroa levels
and viral titres in June and September when determining colony mortality, and that of viral titres when matched
for Varroa level, we used RR, and AR, analyses. To visualise risk probability distributions, we used Bayesian RR
analyses, utilising a Poisson response, and the Jeffreys prior as an objective reference prior.
Varroa model. A curve estimation analysis was employed to fit curve equations to the Varroa model data, and
curve selection was evaluated via the resultant model outputs, based on F-values.
Results
Colony and queen survival over time. Percentage survival over time was significantly greater in Pol-
line colonies when compared to Commercial colonies (Mixed-effects Cox proportional hazards model, effect of
stock: hazard ratio = 0.408, χ2 = 122.800, d.f. = 1, N = 366, P < 0.001, percentage survivalPol-line = 59.884%, percent-
age survivalCommercial = 26.042%; Fig. 2a), and in colonies receiving the high mite treatment, as opposed to the low
mite treatment (Mixed-effects Cox proportional hazards model, effect of mite treatment: hazard ratio = 0.516,
χ2 = 25.192, d.f. = 1, N = 366, P < 0.001, percentage survivalhigh = 57.051%, percentage survivallow = 30.769%).
Additionally, cumulative survival differed significantly between migration treatments (Mixed-effects Cox
proportional hazards model, effect of migration route: χ2 = 10.854, d.f. = 2, N = 366, P = 0.004, percent-
age survivalStationary = 26.415%, percentage survivalCalifornia = 39.355%, percentage survivalMississippi = 50.000%).
This difference was explained by higher survival in the California (Mixed-effects Cox proportional hazards
model, Benjamini–Hochberg post hoc test: hazard ratio = 0.607, z = − 2.854, d.f. = 2, P = 0.004, percentage
survivalCalifornia = 39.355%, percentage survivalStationary = 26.415%), and Mississippi (Mixed-effects Cox propor-
tional hazards model, Benjamini–Hochberg post hoc test: hazard ratio = 0.570, z = − 3.206, d.f. = 2, P = 0.002,
percentage survivalMississippi = 50.000%, percentage survivalStationary = 26.415%) migration groups, when compared
to the Stationary migration group. Colony ID had a significant random effect (colony random effect: vari-
ance = 0.393, P < 0.001).
Percentage queen survival over time was also significantly greater in Pol-line colonies when compared to
Commercial colonies (Mixed-effects Cox proportional hazards model, effect of stock: hazard ratio = 0.355,
χ 2 = 234.388, d.f. = 1, N = 366, P < 0.001, percentage queen r etention Pol-line = 88.350%, percentage queen
retentionCommercial = 66.000%; Fig. 2a), marginally independent of mite treatment (Mixed-effects Cox proportional
Scientific Reports | (2022) 12:4852 | https://doi.org/10.1038/s41598-022-08643-w 7
Vol.:(0123456789)www.nature.com/scientificreports/
a b
Survived Died Commercial Pol-line
c
d
Scientific Reports | (2022) 12:4852 | https://doi.org/10.1038/s41598-022-08643-w 8
Vol:.(1234567890)www.nature.com/scientificreports/
◂Figure 3. (a,b) Varroa levels in colonies, divided by survival outcome (a), and stock (b), across the course of the
study (NCommercial = 193, NPol-line = 173). Each point represents a single measure of Varroa for the corresponding
month, and lines link repeated measures for the same colonies over time. Points are coloured based on stock
(Commercial, grey; Pol-line, blue), and colonies that died by the following sampling point are highlighted
(imminent failure, red). This latter designation is included to visualise the Varroa levels of colonies prior to
failure. Varroa level had a significant influence upon colony survival outcomes (F1,373 = 53.124, P < 0.001).
(c,d) Viral titres in colonies for each survival outcome (c), and stock (d), divided by target, across the course
of the study (NCommercial = 46, NPol-line = 42). Points represent single month measures of viral titre for colonies,
offset at each time point by survival outcome in February (survived, dark grey; died, light grey) (c), or stock
(Commercial, grey; Pol-line, blue) (d). Colonies that were dead by the following sampling point are highlighted
(imminent failure, red), and offset to their concordant group. This designation is included to visualise the viral
titres of colonies prior to failure. Solid lines indicate LOESS (locally weighted scatterplot smoothing) moving
averages, coloured according to their corresponding group. Shaded areas represent 95% confidence intervals.
Dashed lines designate the baseline Ct detection limits for each target, after transformation. Viral tires of
DWV-A (F1,66 = 1.026, P = 0.315), DWV-B (F1,85 = 0.206, P = 0.651), CBPV (F1,80 = 0.516, P = 0.475), and BQCV
(F1,69 = 3.142, P = 0.081), did not have significant effects upon colony survival outcomes.
hazards model, effect of mite treatment: χ2 = 3.603, d.f. = 1, N = 366, P = 0.058), and migration route (Mixed-effects
Cox proportional hazards model, effect of migration route: χ2 = 6.857, d.f. = 2, N = 366, P = 0.052). Colony ID again
had a significant random effect (colony random effect: variance = 0.852, P < 0.001).
Population size and honey production. The population size of surviving colonies in February did
not differ significantly between the two stocks (GLM, effect of stock: χ21 = 2.272, N = 153, P = 0.131; Fig. 2b),
or mite treatments (GLM, effect of mite treatment: χ21 = 0.735, N = 153, P = 0.391), with migration route being
the only significant factor (GLM, effect of migration route: χ22 = 8.935, N = 153, P = 0.011, mean frame-count-
Stationary = 3.240, mean frame-countMississippi = 4.597, mean frame-countCalifornia = 5.614). Specifically, this difference
was accounted for by higher frame counts in surviving colonies within the California migration group, when
compared to those in the Stationary migration group (GLM, Holm-Bonferroni post hoc test: t = 3.154, d.f. = 1,
P = 0.005, mean frame-countCalifornia = 5.614, mean frame-countStationary = 3.240). Similarly, honey production did
not significantly differ between stocks (GLM, effect of stock: χ21 = 0.476, N = 278, P = 0.490; Fig. 2c), or mite treat-
ments (GLM, effect of mite treatment: χ21 = 0.371, N = 278, P = 0.542).
Factors influencing colony survival. When examining the effect of Varroa level, survival status in Febru-
ary was significantly influenced by colony stock, mite treatment, migration route, and Varroa level (Fig. 3a,b)
(Table 1). Additionally, significant interactions occurred between stock and mite treatment, and stock and Var-
roa level, indicating the importance of stock as a modulating factor (Fig. 3b; Table 1). The interaction between
mite treatment and Varroa level was not significant (Table 1), suggesting that although Varroa level was reduced
by mite treatment, this did not alter its underlying relationship with colony survival.
Specifically, when examining the influence of Varroa, colonies were significantly more likely to die dur-
ing the course of the study, if they had higher Varroa levels (meandead = 2.698 MPHB, meanalive = 0.914 MPHB;
Fig. 3a,b), were in the low mite treatment group (mean s urvivallow = 0.212, mean survivalhigh = 0.645), were of
Commercial stock (mean s urvivalCommercial = 0.138, mean survivalPol-line = 0.666), and were in the Stationary or
California, rather than Mississippi migration group (mean survivalStationary = 0.184, mean survivalCalifornia = 0.315,
mean survivalMississippi = 0.541) (Table 1). Stock influenced the effect of mite treatment on survival, as Commercial
colonies benefitted from an additional mite treatment to a greater extent than did Pol-line colonies, exemplified
by their significantly reduced survival at low (mean survivalCommercial = 0.028, mean survivalPol-line = 0.625), but
not at high mite treatment levels (mean survivalCommercial = 0.559, mean survivalPol-line = 0.724) (Table 1). Stock
also influenced the effect of Varroa level on survival, as being of Pol-line stock significantly improved the prog-
nosis for any given Varroa level (Fig. 3b; Table 1), leading to better survival outcomes across infestation strata.
Colony ID had a significant random effect (Table 1), indicating a degree of unexplained inter-colony variability
in survival outcomes, as would be expected.
In contrast to Varroa levels, there was no significant influence of DWV-A, DWV-B, CBPV, or BQCV titres
upon colony survival status in February (Fig. 3c,d; Table 2). Additionally, when analysing the relationship
between viral titres and survival, no effect of stock, mite treatment, or migration route was present, as colonies
were selected based on an even distribution of stocks and migration routes across survival outcomes, to minimise
any confounding effects upon viral dynamics (Table 2). As with the Varroa data, colony ID had a significant
random effect (Table 2).
Predictive differences in Varroa levels and viral titres. Varroa levels were significantly higher in
colonies that died during the course of the study, when compared at both June (mean r ankdead = 204.520, mean
r ankalive = 144.590), and September time points (mean rankdead = 201.890, mean rankalive = 119.550) (Fig. 4a;
Table 3). Additionally, Pol-line colonies displayed significantly lower Varroa levels than Commercial colonies in
both June (mean r ankPol-line = 140.850, mean rankCommercial = 212.530) and September (mean r ankPol-line = 106.440,
mean rankCommercial = 215.200) (Fig. 4b; Table 3), indicating a predictive association between Varroa level, stock,
and colony survival.
Viral titres in June were not significantly different between colonies that died, or survived, for DWV-A
(mean rankdead = 40.680, mean rankalive = 46.790), DWV-B (mean r ankdead = 49.000, mean rankalive = 41.800), or
Scientific Reports | (2022) 12:4852 | https://doi.org/10.1038/s41598-022-08643-w 9
Vol.:(0123456789)www.nature.com/scientificreports/
Type Factor Statistic d.f P
Stock F = 49.233 1, 371 < 0.001
Mite treatment F = 24.385 1, 384 < 0.001
Migration route F = 3.337 2, 373 0.037
Fixed effect Varroa level F = 53.124 1, 373 < 0.001
Stock × Mite treatment F = 17.502 1, 375 < 0.001
Stock × Varroa level F = 18.912 1, 360 < 0.001
Mite Treatment × Varroa level F = 1.042 1, 430 0.308
Varroa level Coefficient = 0.123 373 < 0.001
Fixed coefficient
Pol-line × Varroa level Coefficient = -0.095 360 < 0.001
Mite treatment: low–high t = 5.940 378 < 0.001
Stock: commercial—Pol-line t = 8.106 381 < 0.001
Migration route: Stationary—Mississippi t = 3.563 382 0.001
Holm-Bonferroni Post Hoc Test Migration route:
t = 2.603 375 0.019
California—Mississippi
Low mite treatment: commercial—pol-line t = 7.477 387 < 0.001
High mite treatment: commercial—Pol-line t = 1.401 386 0.162
Random effect Colony ID Z = 9.608 – < 0.001
Table 1. Summary statistics for GLMM assessing the effect of Varroa levels on colony survival. Symbols
INDICATE factor interactions (×), pairwise comparisons (−), and groupings (:), d.f. are calculated via the
Welch–Satterthwaite approximation.
Type Factor Statistic d.f P
Stock F = 1.352 1, 64 0.249
Mite treatment F = 0.216 1, 67 0.644
Migration route F = 0.135 1, 56 0.715
Fixed effect DWV-A titre F = 1.026 1, 66 0.315
DWV-B titre F = 0.206 1, 85 0.651
CBPV titre F = 0.516 1, 80 0.475
BQCV titre F = 3.142 1, 69 0.081
Random effect Colony ID Z = 4.185 – < 0.001
Table 2. Summary statistics for GLMM assessing the effect of viral titres on colony survival. d.f. are calculated
via the Welch–Satterthwaite approximation.
CBPV (mean r ankdead = 45.440, mean rankalive = 43.940) (Fig. 4c; Table 4). However, June BQCV titres were
higher in colonies that died by February (mean rankdead = 53.200, mean rankalive = 39.280; Fig. 4c; Table 4). In
September, there were no significant differences between colonies that died, or survived, for any of the viral
titres measured (DWV-A: mean r ankdead = 43.000, mean rankalive = 35.880; DWV-B: mean r ankdead = 44.840, mean
rankalive = 34.800; CBPV: mean rankdead = 36.960, mean rankalive = 39.400; BQCV: mean rankdead = 41.140, mean
rankalive = 36.960; Fig. 4d; Table 4).
In June, Pol-line colonies showed significantly lower titres of DWV-A than did Commercial colonies (mean
rankPol-line = 37.700, mean rankCommercial = 50.710); however, there were no significant differences between stocks
in DWV-B (mean r ankPol-line = 39.430, mean rankCommercial = 49.130), CBPV (mean r ankPol-line = 44.230, mean
rankCommercial = 44.750), or BQCV titres (mean rankPol-line = 40.080, mean rankCommercial = 48.530) (Fig. 4e; Table 4).
In September, viral titres were significantly lower in Pol-line colonies for DWV-A (mean rankPol-line = 23.190,
mean rankCommercial = 54.640), DWV-B (mean rankPol-line = 23.370, mean rankCommercial = 54.450), and CBPV (mean
rankPol-line = 27.690, mean rankCommercial = 49.890) (Fig. 4f; Table 4), as would be expected based on their correlation
with Varroa levels (Fig. S1a–c). In contrast, however, September BQCV titres did not differ significantly between
stocks (mean r ankPol-line = 35.310, mean rankCommercial = 41.860; Fig. 4f; Table 4), and showed no correlation with
Varroa levels (Fig. S1d).
Prognostic power of Varroa levels and viral titres. In June, Varroa levels significantly increased the
relative risk of mortality by February if colonies fell into the ≥ 1–2.5 (RR, point estimate = 1.528, C I95% 1.256–
1.859, AR = 0.238, P < 0.001; Fig. 5), or > 2.5–5 (RR, point estimate = 1.669, C I95% 1.330–2.059, AR = 0.303,
P < 0.001; Fig. 5), MPHB infestation strata. However, the paucity of colonies with Varroa levels > 5 MPHB pre-
cluded significant prediction of mortality risk above this level (Fig. 5). In September, the initial risk threshold
was higher, as Varroa levels began to significantly increase the relative risk of mortality only at > 2.5–5 (RR, point
Scientific Reports | (2022) 12:4852 | https://doi.org/10.1038/s41598-022-08643-w 10
Vol:.(1234567890)www.nature.com/scientificreports/
a * b *
* *
c * d
e f * * *
*
Figure 4. (a,b) June and September differences in Varroa levels (June, NCommercial = 190, NPol-line = 167; September,
NCommercial = 167, NPol-line = 157). (c–f) June and September differences in viral titres (June, NCommercial = 46,
NPol-line = 42; September, NCommercial = 37, NPol-line = 39). Boxplots are coloured based on survival outcome in
February (survived, dark grey; died, light grey) (a,c,d), and stock (Commercial, grey; Pol-line, blue) (b,e,f).
Outliers (greater than 1.5 times the interquartile range from the median) are indicated with circles. Asterisks
indicate significant differences between groups (η2 > 0.060, P < 0.05).
Scientific Reports | (2022) 12:4852 | https://doi.org/10.1038/s41598-022-08643-w 11
Vol.:(0123456789)www.nature.com/scientificreports/
Response Factor Statistic N η2 P
June Varroa level U = 20,811.000 152, 205 0.082 < 0.001
Survival
September Varroa level U = 19,755.000 155, 169 0.193 < 0.001
June Varroa level U = 9,493.500 190, 167 0.120 < 0.001
Stock
September Varroa level U = 4,308.000 167, 157 0.337 < 0.001
Table 3. Summary statistics for Mann–Whitney U-tests comparing predictive differences in Varroa levels.
Eta-squared values indicate factor effect sizes (small, η2 ≥ 0.010- < 0.060; intermediate, η2 ≥ 0.060- < 0.140; large,
η2 ≥ 0.140).
Response Factor Statistic N η2 P
June DWV-A titre U = 781.500 55, 33 0.013 0.277
June DWV-B titre U = 1,056.000 55, 33 0.019 0.200
June CBPV titre U = 938.500 55, 33 0.001 0.789
June BQCV titre U = 1,194.500 55, 33 0.070 0.013
Survival September DWV-A titre U = 798.000 48, 28 0.021 0.175
September DWV-B titre U = 849.500 48, 28 0.048 0.056
√-x (September DWV-B titre) t = 1.951 48, 28 0.051 0.055
September CBPV titre U = 629.000 48, 28 0.003 0.643
September BQCV titre U = 746.000 48, 28 0.008 0.426
June DWV-A titre U = 680.500 46, 42 0.065 0.017
June DWV-B titre U = 753.000 46, 42 0.036 0.075
June CBPV titre U = 954.500 46, 42 < 0.001 0.923
June BQCV titre U = 780.500 46, 42 0.027 0.121
Stock
September DWV-A titre U = 124.500 37, 39 0.506 < 0.001
September DWV-B titre U = 131.500 37, 39 0.495 < 0.001
September CBPV titre U = 300.000 37, 39 0.252 < 0.001
September BQCV titre U = 597.000 37, 39 0.022 0.196
Table 4. Summary statistics for Mann–Whitney U-tests comparing predictive differences in viral titres. Eta-
squared values indicate factor effect sizes (small, η2 ≥ 0.010– < 0.060; intermediate, η2 ≥ 0.060– < 0.140; large,
η2 ≥ 0.140).
estimate = 1.594, CI95% 1.066–2.384, AR = 0.202, P = 0.024; Fig. 5), with the risk becoming sequentially greater
at > 5–7.5 (RR, point estimate = 2.326, CI95% 1.624–3.333, AR = 0.431, P < 0.001; Fig. 5), and > 7.5 MPHB (RR,
point estimate = 2.647, CI95% 1.916–3.658, AR = 0.536, P < 0.001; Fig. 5). Notably, no other factor significantly
influenced the relative risk of mortality. For a list of all factors and risk probability distributions, see (Fig. 5).
Varroa model. The relationship between Varroa level in September, and mortality, was explained by
a logarithmic function in Commercial colonies (Curve estimation test, F1,24 = 12.851, R2 = 0.349, P < 0.001;
Fig. 6), and a linear function in Pol-line colonies (Curve estimation test, F1,10 = 18.311, R2 = 0.647, P = 0.002;
Fig. 6). At a threshold of 3 MPHB, high mortality was predicted for both Commercial (Curve estimation
test, percentage mortalityCommercial = 72.618%; Fig. 6), and Pol-line colonies (Curve estimation test, percentage
mortalityPol-line = 52.210%; Fig. 6), although this was substantially lower in the latter case. Interestingly, the two
functions intersected at 10 MPHB, as despite considerable mortality, some commercial colonies were able to
survive with very high infestation levels, as reflected in the reduced explanatory power of the commercial model
(Fig. 6).
Discussion
Our results show that under migratory beekeeping conditions, Pol-line honey bees have significantly enhanced
colony and queen survival when compared to a standard commercial Italian stock (Fig. 2a). Additionally, the
productivity of Pol-line colonies appears equivalent to that of Commercial honey bees, as evidenced by compa-
rable honey production and population sizes among surviving colonies (Fig. 2b,c). This improved performance
is associated with lower Varroa levels (Figs. 3b, 4b), and concomitantly reduced titres of DWV-A, DWV-B, and
CBPV in September (Fig. 3d, 4f). Notably, the multiplicative effect of Varroa levels on colony survival is signifi-
cantly weaker in Pol-line colonies, leading to better survival prognoses at all but the highest infestation strata
(Figs. 3b, 6; Table 1). An ostensible explanation for this is the constant removal of infested brood by Pol-line
workers, as is characteristic of VSH behaviour48,54, and thus a subsequent dampening of Varroa growth dynam-
ics and viral transmission. Consequently, Pol-line colonies that received only one mite treatment demonstrated
Scientific Reports | (2022) 12:4852 | https://doi.org/10.1038/s41598-022-08643-w 12
Vol:.(1234567890)You can also read