A first glimpse at the Galactic plane with the ASKAP: the SCORPIO field
←
→
Page content transcription
If your browser does not render page correctly, please read the page content below
MNRAS 506, 2232–2246 (2021)                                                                                      https://doi.org/10.1093/mnras/stab1279
Advance Access publication 2021 May 12

A first glimpse at the Galactic plane with the ASKAP: the SCORPIO field
G. Umana ,1‹ C. Trigilio,1 A. Ingallinera ,1 S. Riggi,1 F. Cavallaro ,1,2 J. Marvil,3 R. P. Norris ,4,5
A. M. Hopkins,6 C. S. Buemi,1 F. Bufano,1 P. Leto ,1 S. Loru,1 C. Bordiu ,1 J. D. Bunton,4
J. D. Collier ,2,5 M. Filipovic,5 T. M. O. Franzen,7 M. A. Thompson ,8 H. Andernach ,9 E. Carretti ,10
S. Dai ,5 A. Kapińska,3 B. S. Koribalski ,4,5 R. Kothes,11 D. Leahy ,12 D. Mcconnell,4 N. Tothill5
and M. J. Michałowski 13

                                                                                                                                                          Downloaded from https://academic.oup.com/mnras/article/506/2/2232/6274685 by Macquarie University user on 24 August 2021
1 INAF-Osservatorio    Astrofisico di Catania, Via Santa Sofia 78, I-95123 Catania, Italy
2 The Inter-University Institute for Data Intensive Astronomy (IDIA), Department of Astronomy, University of Cape Town, Private Bag X3,
Rondebosch 7701, South Africa
3 National Radio Astronomy Observatory, Domenici Science Operations Center 1003 Lopezville Rd, Socorro, NM 87801, USA
4 CSIRO Astronomy & Space Science, P.Of. Box 76, Epping, NSW 1710, Australia
5 School of Science, Western Sydney University, Locked Bag 1797, Penrith, NSW 2751, Australia
6 Australian Astronomical Optics, Macquarie University, 105 Delhi Rd, North Ryde, NSW 2113, Australia
7 ASTRON: The Netherlands Institute for Radio Astronomy, PO Box 2, NL-7990 AA, Dwingeloo, the Netherlands
8 Centre for Astrophysics Research, Department of Physics Astronomy & Mathematics, University of Hertfordshire, College Lane, Hatfield,

Herts AL10 9AB, UK
9 Departamento de Astronomı́a, DCNE, Universidad de Guanajuato, Callejón de Jalisco s/n, Guanajuato, Mexico
10 INAF, Istituto di Radioastronomia, Via Gobetti 101, Bologna, Italy
11 Dominion Radio Astrophysical Observatory, Herzberg Astronomy and Astrophysics, National Research Council Canada, PO Box 248, Penticton,

BC V2A 6J9, Canada
12 Department of Physics and Astronomy, University of Calgary, 2500 University Dr.NW, Calgary, AB T2N 1N4, Canada
13 Astronomical Observatory Institute, Faculty of Physics Adam Mickiewicz University in Poznan, ul. Sloneczna 36, PL-60-286 Poznan, Poland

Accepted 2021 April 27. Received 2021 April 27; in original form 2021 January 19

ABSTRACT
In the broad context of the Australian Square Kilometer Array Pathfinder (ASKAP) early-science phase and preparation for the
related surveys, we report the first radio observations towards the Galactic plane. The targeted field was chosen to encompass
the entire SCORPIO survey, one of the several pathfinder projects for the Evolutionary Map of the Universe survey planned
with the ASKAP. The observations were carried out in 2018 January at a central frequency of 912 MHz, with 15 operational
antennas, and covered a total area of about 40 square degrees in three different pointings. The final image has a resolution of
24.1 × 21.1 arcsec2 and a median rms of 541 μJy beam−1 . We were able to extract 3545 candidate sources, 75 per cent of them
point sources. For a preliminary validation, a comparison with the 843 MHz Molonglo Galactic Plane Survey is presented.
Although the present observations were obtained with the ASKAP only partially deployed, its unique capability to map complex
sources, such as those inhabiting the Galactic plane, at different angular scales, is highlighted. Within the SCORPIO field all
the previously classified H II regions, Planetary Nebulae (PNe), and supernovae remnants (SNRs), previously known to be radio
sources, were detected. We also report new radio detections from several H II regions previously classified as ‘candidates’ or
‘radio quiet’ and from half of all the PNe in the SCORPIO field with robust classification. Most notably, we find numerous
unclassified, extended sources which constitute a promising sample of candidates H II regions and SNRs.
Key words: techniques: image processing – techniques: interferometric – surveys – stars: evolution – stars: formation – radio
continuum: general.

                                                                               et al. 2021) is transforming the way in which large radio surveys
1 I N T RO D U C T I O N
                                                                               have been so far conducted. Due to the wide-field phased array feed
A new era in radio astronomy has finally arrived. The Square                   (PAF) system (Chippendale, Hayman & Hay 2014) mounted on each
Kilometre Array (SKA) precursors have started their early-science              antenna, ASKAP is capable of a huge instantaneous field of view,
phase with impressive results that foreshadow their full operation.            ∼40 square degrees, which allows the coverage of large areas of
In particular the Australian SKA Array Pathfinder (ASKAP, Hotan                the sky in economical amounts of time (Leahy et al. 2019). The
                                                                               fully commissioned ASKAP has a survey speed of 220 deg2 per
                                                                               hour at a target sensitivity of 100 μJy beam−1 at 1.4 GHz, assuming
   E-mail: grazia.umanainaf.it

                                                                                                                                  C 2021 The Author(s)

                                                                           Published by Oxford University Press on behalf of Royal Astronomical Society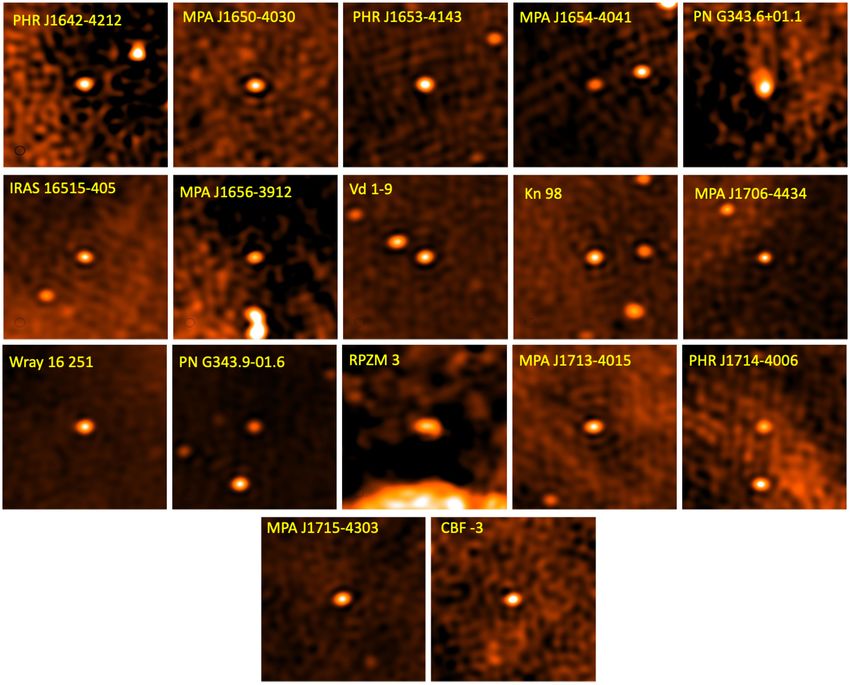
ASKAP            2233
a net bandwidth of 288 MHz and a resolution of 10 arcsec.1 The
ASKAP’s early-science phase started in 2016 October using 12 of
the 36 antennas present in the final design. As the commissioning
operations have progressed, other antennas have been added and, at
the time of the reported observations, 15 antennas were operational.
A number of different regions of the sky were selected for testing
the array in this phase: among these, one is centred towards the same
field of the ‘Stellar Continuum Originating from Radio Physics in
Ourgalaxy’ (SCORPIO) project (Umana et al. 2015; hereafter ‘Paper
I’). We will refer to this targeted observation as to the ‘ASKAP

                                                                                                                                                           Downloaded from https://academic.oup.com/mnras/article/506/2/2232/6274685 by Macquarie University user on 24 August 2021
SCORPIO observations’.
   SCORPIO is a survey of an approximately 2 × 2-deg2 area of sky
centred at Galactic coordinates l = 343.5◦ , b = 0.75◦ , conducted
with the Australia Telescope Compact Array (ATCA) between 1.4
and 3.1 GHz (see Paper I for further details). Besides its own
scientific goals, SCORPIO is used also as a technical test-bed for
the Evolutionary Map of the Universe survey (EMU; Norris et al.
2011), an all-sky (Dec. < +30 deg) ASKAP radio continuum sky
survey scheduled to start in 2021, in particular helping to shape the
strategy for its Galactic plane sections.                                  Figure 1. Comparison between the SCORPIO field coverage as observed by
   The Galactic plane has always been a formidable challenge for           ATCA and by the ASKAP. The ATCA limits are represented as a solid thick
                                                                           line. For the ASKAP we report the position of the 36 beams (dotted circles)
radio interferometers. A concentration of extended sources and the
                                                                           used for field A.
Galactic diffuse emission make it difficult to obtain a radio map
devoid of imaging artefacts. This hampers the imaging performance          Table 1. Total observing time for each field including overheads for the
of the instrument, reducing the quality of the final images (in terms      bandpass and flux calibrator. The SB column reports the scheduling block ID
of signal-to-noise ratio) and makes data reduction and analysis            for each data set. The observations of the field C are split in two different
a particularly demanding task. Many of these issues have been              parts because of a hardware problem that occurred during observations.
mitigated by using different approaches and algorithms tuned for
particular fields. However, because of the large quantity of data          Field                 Source                  SB                  Time
supplied by instruments such as the ASKAP, human intervention                                                                                 (h)
in every step of data reduction is infeasible and a general, though        A                    1934–638                5004                   8
flexible, approach must be used.                                                                SCORPIO                 5008
   In this work, we report the data reduction and analysis of the          B                    1934–638                5010                  12
ASKAP observations of the SCORPIO field, conducted with the                                     SCORPIO                 5011
array still partially deployed. In Section 2, we describe the instrument   C                    1934-638                5012                   7
set-up used and the data reduction pipeline. In Section 3, we focus                             SCORPIO                 5013
on the point and extended source extraction, comparing our results to                           SCORPIO                 5014                   4
                                                                                                1934–638                5015
other similar surveys. Investigations of typical Galactic populations
are also reported. A general discussion on the results and open
problems is reported in Section 4. Finally, Section 5 summarizes
this work and casts an outlook on future analysis and the ASKAP            total surveyed area covers ∼40 square degrees, which is larger by a
observations.                                                              factor 4.6 than the area covered in the previous ATCA observations
                                                                           (see Fig. 1). We refer to this as the ASKAP SCORPIO field in the
                                                                           rest of the paper.
2 O B S E RVAT I O N S A N D DATA R E D U C T I O N                           The observations were carried out in the so-called ‘closepack36’
                                                                           beam footprint (Hotan et al. 2021), consisting of three different
2.1 The ASKAP observations                                                 pointings spaced by 51 arcmin with a 45-deg rotation, to optimize the
The SCORPIO field was observed with the ASKAP in band 1 (from              sky coverage also at the highest frequency. The three pointings were
792 to 1032 MHz) in 2018 January using 15 antennas (of the 36              conducted on three different days, and hereafter we refer to them as
in the completed array) during the early-science phase. The array          fields A, B, and C. The total integration time was 31 h including the
configuration had a minimum baseline of 22.4 m and a maximum               observation of the standard bandpass and flux calibrator 1934–638
baseline of 2.3 km. This implies that the observations, at the central     (see Table 1).
frequency of 912 MHz, are sensitive to a minimum and maximum
angular scale of 29.5 arcsec and 50 arcmin, respectively.                  2.2 Data reduction
   All the antennas were equipped with the version Mk II of the PAF
specifically designed for ASKAP. Each PAF consists of 188 elements,        The data reduction process used the ASKAPSOFT package, based on
94 for each linear polarization. The data from each element are sent to    CASACORE and specifically optimized for managing the ASKAP data
the beamformer to create 36 independent beams, each one with a full        (Whiting et al. 2019). The data reduction procedure is managed
width at half-maximum (FWHM) of 94.2 arcmin at 912 MHz. The                by a pipeline that configures and launches a series of jobs running
                                                                           on the Galaxy supercomputer at the Pawsey facility in Perth. As a
                                                                           first step data are copied from the storage location to the working
1 https://www.atnf.csiro.au/projects/askap/config.html                     area and a CASA measurement set is created for each of the 36

                                                                                                                  MNRAS 506, 2232–2246 (2021)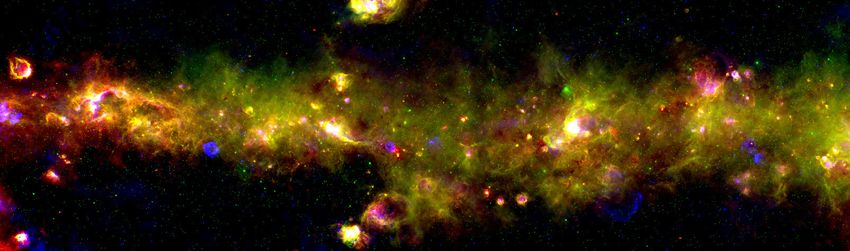
2234         G. Umana et al.

                                                                                                                                                                   Downloaded from https://academic.oup.com/mnras/article/506/2/2232/6274685 by Macquarie University user on 24 August 2021
Figure 2. The ASKAP image of the SCORPIO field at 912 MHz. The mosaic covers a square region of ∼40 deg2 . The synthesized beam is 24 arcsec × 21
arcsec and the background rms noise is 150–200 μJy beam−1 , increasing to 500–600 μJy beam−1 close to the Galactic plane. The observations are sensitive to
angular structures ≤50 arcmin. The silhouette of the Galactic equator is defined by a series of compact sources and bright H II regions. Several SNRs are also
visible. Outside the Galactic plane some large and bright structures are evident. Among these, the region on the top centre of the field, at about 2◦ north from
the Galactic plane, is the northern extreme of the Sco OB1 association, including the H II regions G345.45+1.50 and IC 4628. The other bright structure on the
left, at about 1◦ south from the Galactic plane, is the H II region RCW 117.

                                                                                             √
beams. Automatic flagging is performed on bandpass calibrator                      data with u2 + v 2  3344λ (corresponding to a baseline of 1100 m
and bandpass solutions are derived and applied to the target field.                at 912 MHz, or angular scale ࣠ 1 arcmin), a satisfactory value
This, in turn, is subsequently flagged for bad data and averaged                   that we found, after attempting the data reduction with a variety
in the channel. A final flagging procedure is performed on the                     of likely values. This step roughly filters out the extended emission
averaged data set. At this point, gain calibration solutions are                   while leaving point sources unaltered. The self-calibration is then
derived. As a standard ASKAP procedure, no gain calibrator was                     performed and the solutions applied to all the other baselines.
observed during the observations (McConnell et al. 2016), because                  The self-calibration procedure is iterated three times, the first one,
the PAF system requires an independent observation for each beam                   phase only, and then phase-amplitude self-calibration. The individual
resulting in significant observing overheads. To proceed in the data               beams are finally imaged and combined together in a mosaic.
reduction, a preliminary gain calibration is done using PKS 1934–                     The three fields were processed separately with the final aim to
638 as the calibrator, followed by several self-calibration iterations             merge all of them into a single map. However observations of fields
on automatically extracted bright sources present in the observed                  B and C are affected by strong RFI and other correlator issues, as
field. However this standard ASKAP reduction pipeline is best suited               revealed from plots of the visibilities, and about 25 per cent of the
for extragalactic fields, where many of the brightest sources are                  data needed to be flagged.
point-like (e.g. Norris et al. 2006), and it can fail or behave in                    The resulting images produced by the pipeline are therefore
unpredictable ways for the Galactic plane where the radio sky is                   heavily corrupted. Manual flagging was performed on these fields
dominated by resolved sources and diffuse emission. To overcome                    to recover as much data as possible using the manual mode in the
this problem, we modified the standard procedure as follows. We                    pipeline. The three fields were finally merged into a single image
restricted the self-calibration stage only to long baselines, selecting            using a linear mosaicking procedure. The final map is shown in

MNRAS 506, 2232–2246 (2021)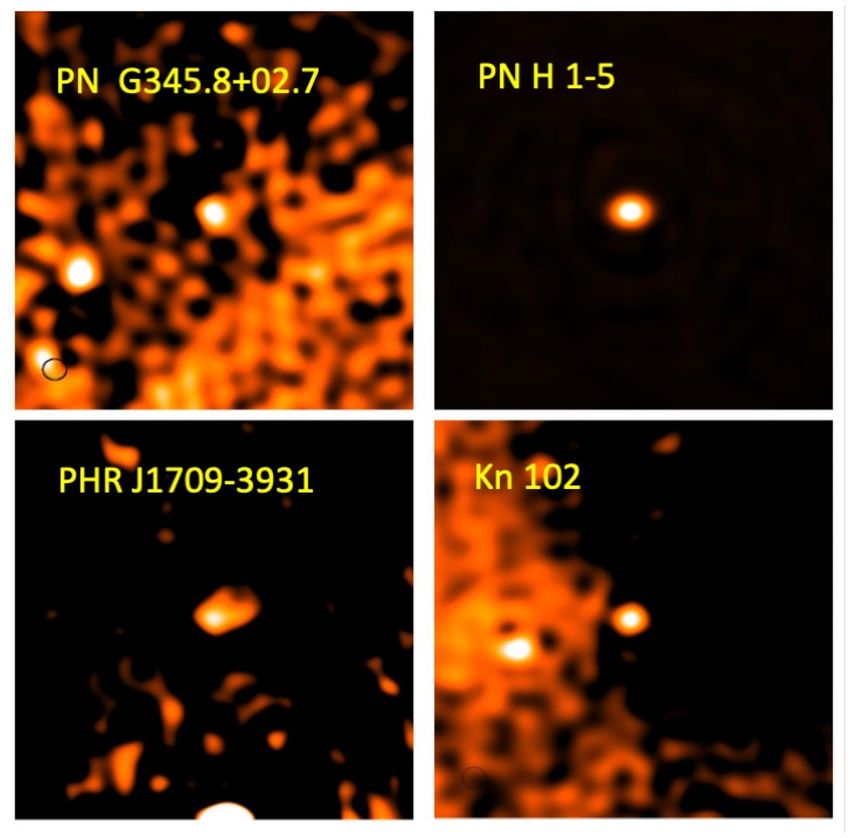
ASKAP             2235
Fig. 2. The synthesized beam is 24 × 21 arcsec2 FWHM, while

                                                                                   sr -1)}
the background noise, calculated as the standard deviation of back-
                                                                                                    3
ground pixel values, varies between ∼ 130 μJy beam−1 in regions

                                                                                   1.5
far from the Galactic plane or other prominent extended sources
                                                                                                   2.5
and ∼2 mJy beam−1 , with a median value of 541 μJy beam−1 .

                                                                                    x dN/dS (Jy
The increase in background noise is mostly due to the imperfect
                                                                                                    2
cleaning of bright extended sources and the Galactic diffuse emission,
which increases towards lower Galactic latitudes. With a maximum
                                                                                                   1.5
theoretical largest angular scale (LAS) of 50 arcmin at 912 MHz,
radio structures with larger angular scales are therefore not ade-
                                                                                                     1

                                                                                                                                                                    Downloaded from https://academic.oup.com/mnras/article/506/2/2232/6274685 by Macquarie University user on 24 August 2021
quately reconstructed and the image dynamic range is limited by

                                                                                   2.5
imaging artefacts. To quantify the impact of artefacts, the residual
                                                                                                   0.5

                                                                                    log {S
sidelobe pattern around bright components has been measured in                                                                ASKAP

                                                                                             10
different regions of the ASKAP map. The obtained values vary within                                                           obs. data (Norris+11)
few per cent with position, but, in general, the artefacts due to a non-                            0
                                                                                                                              obs. data fit
perfect cleaning determine a background noise of ∼ 0.2 per cent of
the peak at a distance of 10 arcmin from the central source and,                                  −0.5
within this distance, the dynamic range is worse than 500.                                            −5   −4   −3    −2      −1       0        1       2
                                                                                                                                        log (S/Jy)
                                                                                                                                              10

3 SOURCE DETECTION                                                              Figure 3. Differential source counts (red dots) observed with the ASKAP in

3.1 Compact source extraction and preliminary validation                        the Scorpio field, normalized by S−2.5 , as a function of the source flux density
                                                                                S. The ASKAP fluxes were extrapolated to 1.4 GHz (assuming an average
The last step of the ASKAPSOFT pipeline processing is an application
                                                                                spectral index α = −0.8) to be compared with data from Norris et al. (2011)
of the source finder algorithm SELAVY (Whiting & Humphrey 2012)                 (blue markers). The dashed line represents a sixth-degree polynomial fit of
to create a compact source catalogue. Default SELAVY parameters in-             the experimental data collection.
cludes the selection criteria considered in the FIRST survey (Becker,
White & Helfand 1995). The source finder algorithm was run on                     In the companion paper (Riggi et al. 2021), the entire catalogue
the final mosaic combining the three available fields. 3140 source              of the compact radio sources in the ASKAP SCORPIO field is
islands2 were extracted from the map with peak flux density >5σ ,               presented. The typical performance achieved in source detection and
where σ is the local rms derived from the computed noise map. Each              characterization as well as the ASKAP positional and flux density
detected island is first processed to determine the number of blended           scale accuracy are also discussed.
components and finally fitted with a number of Gaussian components
to estimate the integrated flux density. Among other Gaussian fitting
results, SELAVY provides, for each fitted component, the peak and               3.2 Extended sources
integrated flux densities, with their errors, the position angle, and the       To perform a first visual validation of the ASKAP map, we used the
major and the minor FWHMs of the Gaussian component, indicating                 second epoch Molonglo Galactic Plane Survey (MGPS-2) survey
both the fit and its deconvolved value, given the image’s restoring             (Murphy et al. 2007), conducted with the Molonglo Observatory
beam. After this procedure, 3545 source components are obtained                 Synthesis Telescope (MOST). We chose MGPS-2 because it covers
for the entire field.                                                           the entire ASKAP SCORPIO field and it is conducted at a comparable
   A continuum validation report3 is automatically generated at the             frequency (843 MHz). However, the uv-plane coverage is consider-
end of the pipeline processing, comparing the obtained source counts            ably different. MOST is characterized by baselines ranging from
to existing measurements and models reported in the literature. The             15 to 1600 m. As a consequence, the nominal resolution is around
comparison is done extrapolating the ASKAP data to a frequency                  45 arcsec and the maximum detectable LAS is approximately twice
of 1.4 GHz, assuming a spectral index α = −0.8 (S ∝ ν α ). The                  as large as that of the ASKAP.
result of this comparison is reported in Fig. 3. The red dots represent            For extended sources the comparison is therefore not straight-
the differential source counts (normalized by S−2.5 ) obtained with             forward, since differences in the angular scales probed by the two
the SCORPIO ASKAP data extrapolated to 1.4 GHz. The blue dots                   instruments heavily affect the reconstructed brightness and morphol-
correspond to a compilation of source counts measurements at                    ogy of the source. Nevertheless, some interesting considerations can
1.4 GHz (taken from Norris et al. 2011) fitted by a sixth-degree                be made by examining a few sample sources.
polynomial (dashed line).                                                          In Fig. 4, the supernova remnant SNR G343.1−0.7 imaged with
   A closer look at the plot shows that most of the SCORPIO sources             the ASKAP (panel c, right) is compared to the equivalent observation
are located above the fitted curve. This is again reasonable and                made with MOST (panel a, left). To validate the ASKAP image and
compatible with observations towards the Galactic plane where we                to check for consistency, in the central panel, (panel b), of Fig. 4,
do expect a source excess with respect to extragalactic fields (e.g.            the ASKAP image of SNR G343.1−0.7, convolved to the MOST
Cavallaro et al. 2018).                                                         beam, (θ = 0.9 arcmin), is shown. While the overall structure of the
                                                                                remnant is well recovered by both instruments, the ASKAP image
                                                                                is sharper and more sensitive, revealing additional source structure
2 By ‘island’ we denote a group of connected pixels with fluxes above a merge   and distinguishing unrelated background point sources that are not
threshold and around a seed pixel with flux above a detection threshold.        seen with MOST. We measured the integrated flux density of the
3 https://confluence.csiro.au/display/askapsst/Continuum+validation  + script   source, in the ASKAP map, through aperture photometry, applying

                                                                                                                           MNRAS 506, 2232–2246 (2021)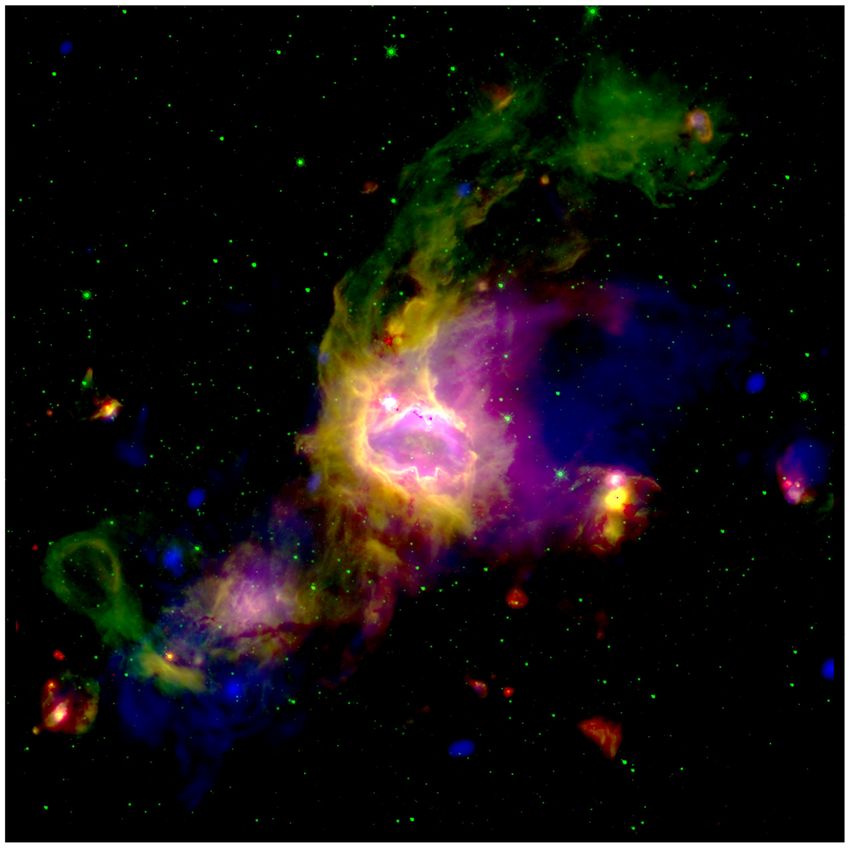
2236        G. Umana et al.

                                                                                                                                                              Downloaded from https://academic.oup.com/mnras/article/506/2/2232/6274685 by Macquarie University user on 24 August 2021
Figure 4. Images of SNR G343.1−0.7 as observed with MOST (left-hand panel) and with the ASKAP (right-hand panel). The ASKAP image of SNR
G343.1−0.7, convolved to the MOST beam is shown in the central panel. The overall structure of the remnant is fully recovered by both instruments but finer
details can be appreciated in the ASKAP map, where it is also possible to better distinguish sources unrelated to the remnant).

the background subtraction in a region surrounding the target, and              more extended material embracing the H II region, which is also rich
obtained Sint = 7.46 ± 0.01 Jy, where the error associated with the             in both warm and cooler dust as probed by mid-IR (Spitzer) and
integrated flux density is calculated according to σ int = RMS ×                far-IR (Herschel) observations (Fig. 6). These examples indicate the
(Nbeams)1/2 , where RMS is the noise of the map, measured outside               superior capability of the ASKAP, compared to other radio facilities
the SNR and Nbeams indicates the number of synthesized beams                    in the Southern hemisphere, to recover fainter extended features and,
contained within the area we calculated the integrated flux density.            at the same time, to highlight small angular scale details.
If we, instead, measure the integrated flux density associated to
the SNR but excluding the six point sources highlighted by the
ASKAP (see Fig. 4, panel c), we obtain Sint = 7.26 ± 0.01 Jy.
                                                                                3.3 Known Galactic sources
The difference in the integrated flux densities is small but significant
and for other supernovae remnants (SNRs) could be more extreme.                 The radio component of the Galactic plane consists of diffuse
Moreover, an accurate identification of point sources that are not              emission as well as of the contributions of discrete radio sources.
related to the observed SNR and whose nature is not recognized                  Major radio surveys (Condon & Kaplan 1998; Helfand et al. 2006;
would allow a more precise analysis of the spatially resolved radio             Wang et al. 2018) have indicated H II regions, PNe, and SNRs as the
spectra to identify spectral index changes within the SNR, to be used           brightest and more numerous populations of Galactic radio objects.
to probe different populations of relativistic electrons that produce           However, the census of each of these types of object is still incomplete
the observed radio emission (Egron et al. 2017). The ASKAP image                and has been hampered by a combination of issues, related to the
shows additional details not visible in the previous MOST image. In             capabilities of existing radio surveys, including limited frequency
particular, the brighter regions near the southern edges of the remnant         range, sky coverage, sensitivity, resolution, and uv-plane coverage.
have much greater spatial definition. These regions are potentially                In particular, for PNe, estimates from theoretical counts indicate
interacting with the local ISM and can be used to localize shocked              that there could be up to 46 000 PNe in our Galaxy but this number
regions.                                                                        could be strongly reduced to (∼6600) if it is assumed that only binary
   Another illustrative example is reported in Fig. 5, where we                 stars form a PN (Jacoby et al. 2010; Sabin et al. 2014). However,
compare the same field centred on the H II region [C06] S17                     our census of PNe is largely off the expected number as the most up-
(Churchwell et al. 2006) as observed with MOST, ASKAP, and                      to-date number of detected Galactic PNe is of only ∼3600 (Parker,
ATCA. The ATCA observations have already been presented and                     Bojičić & Frew 2016). There are populations of PNe completely
discussed in Paper I. Despite the great difference in terms of                  missed, probably those located very close to the Galactic plane,
instrument capabilities, the overall morphology of the source is                where the H α emission, which indicates the presence of a thermal
again well reconstructed by the ASKAP, which provides a good                    nebula, suffers from strong extinction (Ingallinera et al. 2016).
compromise between fine details and extended structures. All the                   In the case of SNRs only 294 are known in our Galaxy (Green
compact components and detailed edges of the inner region, as                   2019), while models predict about 1000 (Tammann, Loeffler &
detected in the ATCA image, are indeed present in the ASKAP                     Schroeder 1994). Existing surveys for SNRs are strongly biased
map. Additionally, all the extended diffuse emission detected in the            towards bright and extended objects and the missing population is
MOST map is also successfully recovered by the ASKAP, including                 probably comprised of the youngest (most compact) and of lowest
the new detection of diffuse, low-brightness features in the southern           surface brightness SNRs.
part of the nebula. To compare the morphology of S17 at multiple                   A complete sample of PNe and SNRs will constrain their density
wavelengths, we retrieved archival observations of the S17 region               and hence their formation rate and distribution in the Galaxy, with
from Spitzer/GLIMPSE and Herschel/HiGAL. The diffuse emission                   strong implications for models of both solar-type and massive stellar
recovered by the ASKAP appears to trace the ionized part of the                 evolution.

MNRAS 506, 2232–2246 (2021)
ASKAP 2237
Downloaded from https://academic.oup.com/mnras/article/506/2/2232/6274685 by Macquarie University user on 24 August 2021
Figure 5. Images of the H II region [C06] S17 as observed with MOST, ASKAP, and ATCA.
be accurately fitted by a small number of Gaussian components
(Whiting & Humphrey 2012).
3.3.1 H II regions
H II regions are found in star-forming sites, in the vicinity of high-
mass stars, where the gas is ionized by ultraviolet photons from the
central object. They are tracers of the current epoch star formation
and their continuum radio emission is due to thermal Bremsstrahlung
radiation. The most complete catalogue of Galactic H II regions has
been compiled by Anderson et al. (2014). To select H II regions,
the authors used mid-infrared (MIR) observations from the Wide-
Field Infrared Survey Explorer (WISE) satellite, taking advantage
of the typical morphology that H II regions show in the MIR. The
Anderson et al. (2014) catalogue has 8399 entries and consists
of 1524 sources with robust classification as true H II regions,
because they have measured RRL or Hα emission. The others
are classified as candidates, either with spatially coincident radio
continuum emission (1986 sources) or without a radio counterpart
(4124 sources). The latter are indicated in the catalogue as radio
quiet. Among the possible candidates, there are 115 with no radio
data available.
Within the ASKAP SCORPIO region, there are 382 sources,
Figure 6. An RGB false colour image of the field around S17 in both dust
and ionized gas. The colour-code is: green, from Spitzer/Glimpse (IRAC, catalogued by Anderson et al. (2014) as follows: 97 known H II
8 μm); red, from Herschel/Hi-GAL (PACS, 70 μm); and blue, from the regions (K), 38 candidates (C), 220 radio quiet (Q), 22 closely
ASKAP, 912 MHz. The image, 33 arcmin × 33 arcmin in size, is centred located to a known H II regions (G), and five without radio data
at l,b = 343.48◦ , 0.026◦ . The position of the S17 Bubble, as reported in available. From a visual inspection of the ASKAP SCORPIO field
Churchwell et al. (2006), is l,b = 343.482◦ , −0.044◦ . we conclude that all 97 known (K), all 38 candidate (C) and all
22 grouped (G) H II regions were detected. Furthermore, 99/220
of radio-quiet sources (Q) and all of the five sources, which were
In the following analysis, the detection of known radio H II regions, previously reported without radio data available, were also detected
PNe, and SNRs by our ASKAP observation are assessed by visual in our ASKAP observations, bringing the total number of detections
inspection at positions provided by relevant catalogues. to 261. Fig. 7 shows a portion of the ASKAP SCORPIO field with
As the purpose of this paper is a summary of the project focusing the H II regions from Anderson et al. (2014) highlighted.
on the potentiality of the ASKAP in the field of Galactic radio Ingallinera et al. (2019) present a catalogue of extended sources
astronomy, for each different category of Galactic sources considered detected with ATCA in the SCORPIO sub-field. They extracted 99
in this section, we will exclusively provide the source identification extended sources, including nine H II regions reported by Anderson
and, if present in the compact catalogue provided by SELAVY, the et al. (2014) as radio quiet and pointed out the presence of 18 H II
integrated flux density. As indicated in session 3.1, a source is regions, previously indicated as radio quiet, detected as point sources,
extracted by SELAVY if it satisfies the detection criterion (flux density without providing, however, their name or positions. Eight out of the
≥5σ , where σ is the local rms), and if its spatial structure can nine extended sources, reported by Ingallinera et al. (2019), are also
MNRAS 506, 2232–2246 (2021)2238 G. Umana et al.
Downloaded from https://academic.oup.com/mnras/article/506/2/2232/6274685 by Macquarie University user on 24 August 2021
Figure 7. A portion of SCORPIO field centred at position l,b = 343.8◦ , −0.2◦ . The H II regions defined by Anderson et al. (2014) are indicated as ‘C’
candidates, ‘K’ known, ‘G’ group, ‘Q’ quiet.
present in our sample of sources detected by visual inspection of our (Q) H II regions, detected and extracted by SELAVY , are shown. The
ASKAP image, but we were not able to check if any other sources angular size plotted in Fig. 8 is defined as θ = (θmax d )2 + (θ d )2 .
min
were in common. Our final sample of new detections consists of In general, radio-quiet H II regions appear to be fainter and more
the 5/5 with no radio observations available plus the 91 previously compact than known (K) H II regions and this corroborates the
reported as radio quiet, yielding a total of 96 new detections. hypothesis that previous non-detections were related to sensitivity
As anticipated in Section 3.3, we produce a catalogue for the limits of previous radio surveys. Similar result has been very recently
112 sources detected by visual inspection and extracted by SELAVY obtained by Armentrout et al. (2021), who performed sensitive 3 cm
(Table 2). The catalogue reports the object WISE name as in Ander- JVLA observations targeting a sample of infrared-identified ‘radio-
son et al. (2014), the coordinates (RA and Dec.), the classification quiet’ H II regions in the range 245◦ ≥ l ≥ 90◦ .
following Anderson et al. (2014), the integrated flux density and its Since no information on distance of our detected sample of sources
associated error, the angular dimensions of the source, FWHM of the previously classified as radio quiet is available, we are not able to
d d
major (θmax ) and the minor (θmin ) axes of the source, as determined reach a conclusion on their physical dimension. These H II regions
by the Gaussian fit, deconvolved by the synthesized beam. Table 2 is candidates are either close and compact, if they are in the early stage
truncated and its complete version is available in the online version of their evolution or more distant if more evolved.
of the paper. The detection of several sources previously classified as radio quiet
In the ASKAP image we detect 45 per cent of the sources indicates the high potential of ASKAP observations for Galactic
previously classified as radio quiet. Anderson et al. (2014) provide studies as a significant number of radio-quiet H II regions candidates
different hypotheses on the nature of these radio-quiet H II regions are possibly H II regions detected via their radio continuum near
candidates. Among them, the possibility that these sources, charac- 1 GHz. The ASKAP performance will improve even further when
terized in the MIR by the same morphology as H II regions, could the full 36 antenna array data will be used, allowing for more
be instead intermediate-mass stars that do not have the necessary sensitivity and higher angular resolution. Further investigations,
UV radiation to ionize the nebula surrounding the central object, using a wider sample of candidate radio-quiet H II regions detected
or perhaps H II regions in the very early or very late stage of their with the ASKAP in its final configuration, will allow us to further
evolution. These authors, however, provide a hint on the angular constrain the nature of these sources.
dimension of the infrared selected radio-quiet H II regions. When
considering the angular size distribution for WISE catalogue of H II
regions, all the known, candidates, and group samples share the same 3.3.2 Planetary nebulae
distribution while the radio-quiet sources are significantly smaller.
Since there is a relation between the dimension of the infrared and of Thermal radio continuum is also radiated by the ionized nebulae
the radio nebula (Bihr et al. 2016), we should expect to see different known as Planetary Nebulae (PNe). The PN is a short-lived (a few
angular size distributions for the known H II regions and radio-quiet 104 yr) evolutionary phase of stars with mass between 0.8 and 8
sources detected in our ASKAP image. In Fig. 8, the flux density and M . Objects in this phase are of high relevance in recycling matter
the angular dimension distributions for known (K) and radio-quiet in the universe. They are responsible for enriching galaxies with
MNRAS 506, 2232–2246 (2021)ASKAP 2239
Table 2. H II regions and H II regions candidates detected and extracted with SELAVY. This truncated table is intended to show its
content. The complete table is available in the online version of the journal.
SourceID Obj. name RA Dec. C S912 err d
θmax d
θmin
[ABB2014] WISE (mJy) (mJy) (arcsec) (arcsec)
J252.386-44.4413 G340.910+00.167 16:49:32.5 −44:26:28 K 407.62 4.17 170.6 165.6
J252.609-44.2916 G341.121+00.141 16:50:26.1 −44:17:29 Q 5.73 0.09 39.4 25.1
J253.083-44.4688 G341.207−00.232 16:52:20.0 −44:28:07 K 710.53 17.04 51.7 42.6
J252.505-44.0838 G341.238+00.335 16:50:01.1 −44:05:01 K 9.62 0.11 30.9 19.8
J253.177-44.4449 G341.271−00.265 16:52:42.4 −44:26:41 Q 35.74 0.25 29.1 20.9
−44:09:30
Downloaded from https://academic.oup.com/mnras/article/506/2/2232/6274685 by Macquarie University user on 24 August 2021
J252.734-44.1584 G341.286+00.159 16:50:56.2 Q 2.13 0.02 18.1 0
J252.726-44.1177 G341.314+00.190 16:50:54.3 −44:07:03 Q 20.84 0.11 12.6 4.8
J253.277-44.3868 G341.358−00.287 16:53:06.5 −44:23:12 K 82.14 1.29 76.5 65.6
J252.806-44.1087 G341.364+00.147 16:51:13.4 −44:06:31 Q 4.96 0.24 54.5 13.8
J252.637-43.9016 G341.438+00.383 16:50:32.8 −43:54:05 C 2.55 0.05 27.5 11.4
–
Figure 8. Flux density distribution (left-hand panel) and angular size distribution (right-hand panel) of H II regions, known, and radio quiet, detected with the
ASKAP and extracted with SELAVY (see Table 2).
elements produced by stellar nucleosynthesis and thus trace the a region with strong confusion, while the fifth is located in a region
Galactic chemical enrichment process (Kwok 2007). with a local rms of about 200 μJy. The last one is very weak and
Parker et al. (2016) have compiled the most recent catalogue of barely distinguishable from the noise.
Galactic Planetary Nebulae (HASH: Hong Kong/ AAO/ Strasbourg/ It is also worthwhile to underline our new detections of three
Hα). This catalogue is a unique data repository with a graphical likely and two probable Galactic PNe that, considering the 15 new
interface, and currently contains multiwavelength images, spectra, detections among our sample of true PNe, brings the total number of
positions, sizes, and morphologies of 3540 objects. For the following new detections to 20.
analysis we used the version as of 2016. These objects are classified All the results are summarized in Table 3, where the object name,
as 2401 true (T) Galactic PNe, based on their multiwavelength PN- in bold if it is a new detection, the coordinates (RA and Dec.), the
type morphologies and spectral features, 447 likely (L) Galactic Galactic coordinates, the classification as in Parker et al. (2016), the
PNe, based on the same parameters as for true PNe but with not integrated flux and its associated error, as determined with SELAVY,
completely conclusive imagery or spectroscopy, and 692 probable are reported. Four sources, detected by visual inspection, were not
(P) Galactic PNe, where the available spectroscopy and/or imagery extracted by SELAVY. This failure of the source finder algorithm is
is not conclusive because of very low S/N spectra or a very low probably related to a highly noisy background around these sources
surface brightness of the nebula. or to the fact that these sources do not fulfil all the imposed criteria.
Within the ASKAP SCORPIO region, there are 48 sources Fig. 9 shows these sources, while all the (other) new detections are
catalogued by Parker et al. (2016), comprising 35 T, 6 L, and 7 shown in Fig. 10.
P Galactic PNe. In the ASKAP map we detect 29/35 true PNe, 3/6
likely PNe, and 2/7 probable PNe, for a total of 34 radio sources. 3.3.3 Supernova remnants
In the case of true PNe, only 14 out of the 29 detected in the
ASKAP maps have been already detected in the radio (Parker et al. Other major polluters of the Galaxy are SNRs, the remains following
2016). We have therefore doubled the radio detections for these the explosion of their progenitor stars. By enriching the interstellar
robustly classified Galactic PNe. We have further inspected the field medium (ISM) in heavy elements and other nucleosynthesis prod-
of the non-detected true PNe. Four out of six of them are located in ucts, these stellar ejecta contribute to the chemical composition of
MNRAS 506, 2232–2246 (2021)2240 G. Umana et al.
Table 3. PNe detected in the ASKAP SCORPIO field. New detections are highlighted in bold. Sources for which
no flux density is reported are only detected by visual inspection. Column C indicates the classification following
Parker et al. (2016).
Obj. name RA Dec. l b C S912 err
(mJy) (mJy)
PHR J1642−4212 16:42:18.6 −42:14:45.20 341.723 +2.597 T 6.91 0.05
PN SuWt 3 16:44:24.1 −40:03:20.4 343.639 +3.733 T 3.68 0.04
Vd 1-3 16:49:32.9 −39:21:08.96 344.818 +3.432 T 2.48 0.04
MPA J1650−4030 16:50:20.2 −40:30:03.17 344.030 +2.582 T 5.5 0.05
−39:08:18.89 +3.439
Downloaded from https://academic.oup.com/mnras/article/506/2/2232/6274685 by Macquarie University user on 24 August 2021
Vd 1-4 16:50:25.3 345.091 T 3.23 0.03
Vd 1-5 16:51:33.7 −40:02:55.64 344.528 +2.690 T 4.99 0.06
PN H 1-3 16:53:31.3 −42:39:22.39 342.744 +0.752 T 35.18 0.14
PHR J1653−4143 16:53:55.3 −41:43:59.81 343.507 +1.277 T 14.59 0.07
Vd 1-6 16:54:27.3 −38:44:10.39 345.900 +3.086 T 14.35 0.13
MPA J1654−4041 16:54:43.2 −40:41:46.64 344.407 +1.814 L 9.53 0.06
PN G343.6+01.1 16:54:51.0 −41:43:49.91 343.618 +1.145 P 7.18 0.18
IRAS 16515−4050 16:55:00.4 −40:55:34.64 344.262 +1.627 T 8.72 0.03
PN G345.8+02.7 16:55:51.9 −39:00:20.95 345.862 +2.704 T
PM 1-119 16:56:34.0 −43:46:14.77 342.226 −0.380 T 107.05 0.36
MPA J1656−3912 16:56:40.1 −39:12:36.83 345.800 +2.454 T 3.75 0.03
PN H 1-5 16:57:23.7 −41:37:57.86 343.992 +0.835 T
IC 4637 17:05:10.5 −40:53:08.45 345.479 +0.140 T 233.11 0.62
Vd 1-9 17:05:38.9 −43:56:20.36 343.100 −1.775 T 9.54 0.10
PN Pe 1-8 17:06:22.6 −44:13:09.95 342.955 −2.049 T 83.62 0.39
Kn 98 17:06:19.6 −43:15:33.00 343.716 −1.463 L 7.19 0.07
MPA J1706−4434 17:06:49.3 −44:34:34.64 342.717 −2.327 T 8.32 0.07
PN H 1-6 17:06:59.1 −42:41:09.13 344.247 −1.215 T 34.85 0.12
Wray 16 251 17:07:30.6 −44:22:50.27 342.948 −2.308 T 37.89 0.29
PN G343.9−01.6 17:07:57.0 −43:09:04.93 343.980 −1.635 T 6.22 0.09
PHR J1709−3931 17:09:10.1 −39:31:06.50 347.030 +0.352 T
PN H 1-7 17:10:27.4 −41:52:49.40 345.277 −1.249 T 180.98 0.75
RPZM 3 17:11:25.2 −39:29:51.68 347.305 +0.015 P 30.43 0.41
PM 1-131 17:12:22.0 −42:30:41.26 344.976 −1.907 T 3.61 0.02
MPA J1713−4015 17:13:10.8 −40:15:56.09 346.883 −0.710 T 9.55 0.08
Kn 102 17:14:25.0 −41:44:34.00 345.822 −1.765 L
PHR J1714−4006 17:14:49.3 −40:06:08.96 347.199 −0.869 T 11.52 0.07
MPA J1715−4303 17:15:15.9 −43:03:53.78 344.838 −2.662 T 10.87 0.06
CBF-3 17:15:46.8 −42:24:06.12 345.434 −2.354 T 5.28 0.03
RPZM 8 17:15:51.6 −39:33:08.24 347.763 −0.711 T 9.35 0.09
the local ISM and therefore to the next generation of stars. Moreover, us to identify new SNRs and to perform detailed morphological and
SNRs release large amounts of energy, generating shock waves spectral characterization of the known ones. Indeed, both the age
that propagate in the immediate surroundings with evident effects and the environmental conditions can affect the emission processes
(shaping of ISM, triggering star-formation, etc.). in SNRs, and the study of a larger sample of objects is crucial to their
The most complete catalogue of Galactic SNRs is provided by wider understanding and classification.
Green (2019) on the basis of observations performed over the whole Due to the availability of very short baselines, ASKAP allowed
electromagnetic spectrum. The large majority of the classified SNRs us to reach an LAS of ∼50 arcmin at 912 MHz. This value,
(∼95 per cent) is identified as radio source. coupled with the high resolution, permits us to investigate SNRs
In the ASKAP SCORPIO region there are 14 SNRs reported in at different angular scales, providing sensitive and detailed maps
Green (2019) and two candidates from the literature (Whiteoak & of these extended and complex sources. In the ASKAP map at
Green 1996), whose classification as SNRs has been recently 912 MHz, we can study the morphological details of the 16 known
supported by Ingallinera et al. (2019). All of them are visually SNRs detected in the SCORPIO field. A 2.3 × 1.3 deg2 portion of
detected in the SCORPIO map, and their main characteristics the map, centred at l = 343.8◦ b = −0.2◦ , is shown in Fig. 11,
are summarized in Table 4. In the ASKAP map we also detect where four published SNRs (Green 2019) are highlighted with white
a further three SNR candidates, proposed by Ingallinera et al. circles and the three SNR candidates (Ingallinera et al. 2019) with
(2019), namely SCO J165948−420527, SCO J170029−421309, and green circles.
SCO J170105−420531. We stress here that the ASKAP mapping capabilities, illustrated in
SNRs are studied across the whole electromagnetic spectrum, Fig. 4 for the SNR G343.1−0.7, allow us to distinguish the unrelated,
but non-thermal radio emission remains their main identifier. The field sources from the remnant itself. This results in a significant
morphology and the spectral variations in the radio band are closely improvement in the estimation of the flux density of these SNRs with
related to the evolutionary phase and the interaction of the SNR with respect to previous images of these sources. Moreover, a previously
the surrounding material. The possibility to observe these sources classified SNR might be reclassified as S or C if observed with a
with high sensitivity and angular resolution in the radio band allows better sensitivity and higher resolution.
MNRAS 506, 2232–2246 (2021)ASKAP 2241
sources. This is particularly important for the Southern hemisphere,
where the lack of such surveys has prevented us from gathering
detailed information of the radio properties of different source
populations in the third and fourth Galactic quadrants. EMU, with
its high sensitivity and angular resolution coupled to excellent short-
spacing uv-plane coverage that provides high sensitivity to extended
structures, and the unique survey speed capability that characterizes
ASKAP, will allow us to create the most sensitive wide-field atlas of
Galactic continuum emission yet made in the Southern hemisphere.
We stress that while the analysis presented here refers to data
Downloaded from https://academic.oup.com/mnras/article/506/2/2232/6274685 by Macquarie University user on 24 August 2021
obtained with a partial deployment of ASKAP antennas, the tremen-
dous potential of ASKAP has been clearly evidenced. ASKAP will
be a revolutionary instrument for radio astronomy and therefore the
full potential of EMU for Galactic observations can be anticipated.
From this preliminary analysis of SCORPIO data, we have already
demonstrated the unique capability of ASKAP to map complex
sources, such as those that populate the Galactic plane, at different
angular scales and with high sensitivity.
The EMU survey of the Galactic plane will have a profound impact
on our understanding of star formation and stellar evolution, on
Galactic structure and the nature of diffuse emission, and will very
likely find new classes of objects.
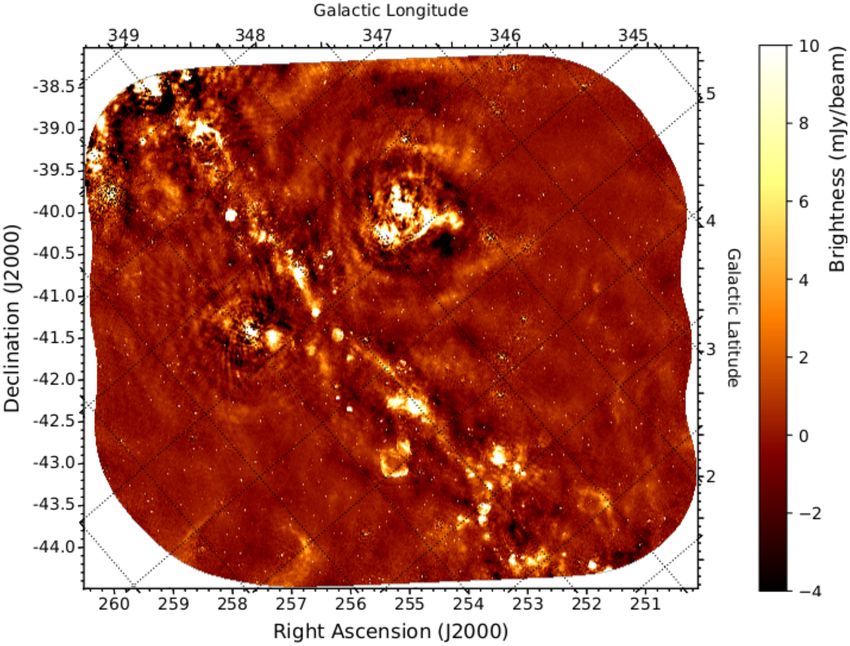
Figure 9. Maps of the detected PNe, including three new detections, which
were not extracted by SELAVY, with no flux density indications in Table 3. 4.2 The role of SCORPIO in the EMU design study
All the images are 400 arcsec × 400 arcsec in size and centred at the PN’s
position (RA, Dec.). Several pilot studies, closely matching EMU in sensitivity and
resolution, have been carried out to guide the design, operation,
In the radio, a large fraction of known SNRs present a typical and science of the EMU project, e.g. the ATLAS (Norris et al.
‘shell-like’ morphology, which is a strong indicator of their nature. 2006) and SCORPIO (Paper I) surveys. SCORPIO, covering an area
There are many extended sources in the SCORPIO field that satisfy of a few square degrees, is the only pilot study to focus on low
the morphological criterion for SNRs. Those sources constitute a Galactic latitude and is especially important for the characterization
very promising sample of SNR candidates. Observations at other of the Galactic sub-mJy population, providing a solid base-level
frequencies, such as those already planned for the SCORPIO field from which we can better design some aspects of EMU. Indeed
between 0.9 and 1.8 GHz in the very near future, will be necessary most of the ASKAP data processing techniques were optimized
to confirm the non-thermal origin of the radio emission. for extragalactic fields, and a special effort needs to be made to
adapt processing techniques to cope with the large-scale structure,
and strong confusing sources encountered in the Galactic plane.
4 T H E S C O R P I O P RO J E C T I N T H E C O N T E X T
Synthesis imaging in these areas of the sky is badly affected by the
O F E M U : L E S S O N S L E A R N T S O FA R
discrete and limited sampling of the uv-plane. In the image plane
this unavoidable imperfection arising from a lack of information in
4.1 The impact of EMU on Galactic science
the uv-plane translates first into imaging artefacts, which increase the
Radio surveys have provided a large number of unexpected dis- background noise in a non-random manner. It also likely results in
coveries, revealing different populations of radio-emitting objects incorrect reconstruction of the brightness distribution of extended
and allowing numerous and very successful follow-up studies. An sources. These problems are indeed detected in the ASKAP maps,
optimal radio survey of the Galactic plane needs to be carefully where extended sources and the Galactic diffuse emission are present.
designed to correctly probe both the compact, extended and diffuse However, the comparison with the MGPS and the ATCA observa-
kinds of emission that populate the plane of the Galaxy. With tions of SCORPIO reveals that the artefacts are not more severe than
previous and current radio facilities, this has been difficult to achieve what we might theoretically expect. Indeed, the comparison of the
in practice. The usual way to overcome this problem is the use same fields as observed by MOST, ASKAP, and ATCA demostrates
of interferometric arrays in different antenna configurations and/or how ASKAP, even in this early-science phase, provides the best
adding single-dish data. Up to now, existing interferometric radio compromise between fine details and extended structures and shows
continuum surveys of the Galactic plane cover a small portion of a superior capability, compared to other radio facilities, to recover
the Galactic plane (a few tens of square degrees), with high angular low-brightness diffuse emission up to angular scales comparable
resolution (arcsecs) and sensitivity (1–2 mJy) (MAGPIS, Helfand to its LAS, allowing us to efficiently probe different spatial scales
et al. 2006; CORNISH, Hoare et al. 2012; THOR, Wang et al. 2018; in complex regions. This is particularly advantageous for Galactic
GLOSTAR, Medina et al. 2019), or wider areas (several 100 square studies.
degrees) but with limited angular resolution (arcmins) and sensitivity A critical point in the ASKAP data reduction process is the
(several mJy) (IGPS, Taylor et al. 2003, 2017; McClure-Griffiths gain calibration, performed as stated earlier by self-calibrating on
et al. 2005; Stil et al. 2006). bright sources automatically extracted from the observed field.
There is therefore the necessity to have a well-designed survey of The presence of diffuse emission and extended sources may result
the Galactic plane, with a good compromise between sensitivity to in poorly determined gain solutions. To overcome this limit, we
extended diffuse emission and the ability to resolve more compact constrained the self-calibration to regions of the uv-plane far from its
MNRAS 506, 2232–2246 (2021)2242 G. Umana et al.
Downloaded from https://academic.oup.com/mnras/article/506/2/2232/6274685 by Macquarie University user on 24 August 2021
Figure 10. Maps of the new detected PNe, extracted by SELAVY (see Table 3). All the images are 400 arcsec × 400 arcsec in size and centred at the PN’s
position (RA, Dec.).
origin, i.e. restricting the analysis to long baselines (see Section 2.2). were confined to particular time intervals or frequency ranges.
Several attempts were made in order to find an optimal setting that Therefore, before merging the three fields, a manual flag for bad
allowed us to filter out as much extended emission as possible but, data improved imaging of fields B and C. However, this approach
at the same time, retain a sufficient number of baselines to derive is not straightforward because of the large amount of data (around
reliable gain solutions. The ASKAP standard data reduction pipeline 9 TB per each field) and will become totally impractical with the
needs to be refined and adapted to this gain calibration process when full ASKAP array, and when observing larger sky areas. We suggest
applied to data acquired in the Galactic plane. A possible way to that the ASKAP standard data reduction pipeline should improve
mitigate this problem is to design the EMU survey making sure the automated algorithm to mitigate and flag the RFI, taking also
to have a sequence of pointings, off the Galactic plane, alternating into account possible effects that the applied flagging methods could
to pointings in the Galactic plane. This observing strategy would have on extended bright sources as those populating the Galactic
provide a sufficient number of point sources to be used for self- plane (Bihr et al. 2016).
calibration. An important part of all the pilot studies in the pre-SKA era is
The ASKAP observations were performed with three different to acquire the experience in handling data from SKA precursors
pointings spaced by 51 arcmin, different from other fields observed that are representative of SKA. A significant challenge with these
with ASKAP in this early-science run. As reported in Section 2.2, huge data sets, beyond the data reduction itself, is to automatically
two of these pointings, fields B and C, are corrupted by RFI. The auto- find and classify radio sources. The size of SCORPIO field is still
matic flagging algorithm embedded in the pipeline (CFLAG) failed to small enough to allow source identification by visual inspection,
detect and flag these data. Another flagging utility (AOFLAGGER) as done in this paper, but it is also sufficiently large for testing
was tested with similar results. Some single data sets have been and training automated algorithms. Results from the human-driven
visually inspected with CASA to check in detail whether the RFI visual inspection can be used as a verification check of the automated
MNRAS 506, 2232–2246 (2021)ASKAP 2243
Table 4. Summary of the known SNR detected with ASKAP at 912 MHz in These new IR Galactic plane surveys are characterized by a few
the SCORPIO field, and related main characteristics. Type of the SNR: ‘S’ or arcsecs angular resolution, matching the ASKAP angular resolution,
‘C’ if the remnant shows a ‘shell’ or ‘composite’ radio structure. We report and have a very good sensitivity and sky coverage, to allow IR and
the frequency range within which each source has already been observed. radio counterparts to be efficiently identified and studied. Studies of
Source sizes are reported according to Green (2019).
this kind will be facilitated by visual analytics tools that have been
recently developed to assist scientists in managing, visualizing, and
Source name Type Frequency range Source size
(GHz) (arcmin2 )
analysing large amount of data (Vitello et al. 2018).
While Galactic H II regions and PNe populations can be in
G340.4−0.4∗ S 0.330–5 10 × 7 principle discriminated by using IR colours derived by photometric
G340.6+0.3 S 0.330–5 6×6 measurements (Anderson et al. 2012) or studying their local environ-
22 × 16
Downloaded from https://academic.oup.com/mnras/article/506/2/2232/6274685 by Macquarie University user on 24 August 2021
G341.2+0.9 C 0.330–1.425 ment (Irabor et al. 2018), in the case of H II regions and PNe, as well
G341.9−0.3 S 0.408–5 7×7 as for other classes of Galactic objects, robust classification can be
G342.0−0.2 S 0.408–5 12 × 9
achieved only by combining radio and IR information (Cohen et al.
G342.1+0.9 S 0.843–1.384 22 × 16
G343.1−0.7 S 0.843–8.55 27 × 21
2011).
G343.1−2.3 C? 0.330–8.46 32 × 32 The SCORPIO field, as observed by the ASKAP (see Fig. 2),
G344.7−0.1 C? 0.408–11.2 8×8 reveals the striking ‘bubbling’ appearance of the Galactic plane,
G345.1−0.2 S? 0.843–1.4 6×6 confirming what recent large-scale mid-IR surveys have revealed:
G345.1+0.2 S 0.843 10 × 10 the presence of hundreds of extended (scales from tens arcsec to
G345.7−0.2 S 0.843–5 6×6 arcminutes) gaseous and dusty nebulae ubiquitous in the Galactic
G346.6−0.2 S 0.408–5 8×8 plane. The term ‘bubbles’ is usually used to classify them, although
G347.3−0.5 S? 1.36 65 × 55 they can be the result of different astrophysical phenomena: a
G348.5+0.1 S 0.08–14.7 15 × 15 bubble can be the result of the expansion of a young H II region
G348.5−0.0∗ S? 0.333–5 10 × 10
into the ISM due to strong winds or radiation pressure from the
Note. ∗ This SNR is only partially detected at the edge of our ASKAP map. central stellar object/s (Churchwell et al. 2006) or indicate the
presence of circumstellar material, the signpost of instabilities that
often characterize the late stages of stellar evolution (Gvaramadze,
algorithms. The pilot survey of SCORPIO has been already used as a Kniazev & Fabrika 2010; Mizuno et al. 2010; Watcher et al. 2010).
test-bed for automated tools to extract sources, such as the CAESAR Such circumstellar envelopes (CSE) are often observed in PNe,
algorithm (Riggi et al. 2016, 2019) that extracts and parametrizes LBVs, WRs, and SNRs. Several authors have pointed out that with
sources from astronomical radio interferometric maps. enough resolution and sensitivity it is possible to classify Galactic
The task for identifying the most appropriate method of finding and bubbles, discriminating H II regions from evolved star CSEs, and
extracting sources, embedded in the diffuse emission expected at low among the latter low- and high-mass stars, just from the comparison
Galactic latitude, is still ongoing (Riggi et al. 2021). The performance of the observed morphology in the IR and in the radio (Watson et al.
of the most used source finding algorithms (SELAVY, CAESAR, 2008; Deharveng et al. 2010; Ingallinera et al. 2016). Indeed, for H II
and AEGEAN) has been tested and it is subject of an ongoing work regions or evolved stars, while the radio emission traces the ionized
(Riggi et al., in preparation). A major result is that the number of part of the circumstellar material, the emission observed in the IR
false detections, above a fixed detection threshold, is considerable traces emission from polycyclic aromatic hydrocarbons (PAH) and
regardless of the finder used. This is due to the overdeblending of hot dust (∼ 8 μm) or warm dust (∼ 24 μm) or cool dust (∼ 70 μm).
real diffuse emission and extended sources in the Galactic plane and In H II regions, the ∼ 8 μm emission is dominated by PAH, which
to the presence of artefacts, due to a non-perfect cleaning. Overall, cannot survive at the temperature of the inner region, where the
this represents a severe issue for future, large-scale radio surveys radio emission originates. Therefore, a strong (∼ 8 μm) emission
covering the Galactic plane such as those planned with ASKAP. ‘wrapping around’ the radio emission points towards an H II region
It is clear that with the new generation of large-scale surveys, classification (Deharveng et al. 2010; Ingallinera et al. 2019).
which will be produced by new instruments such as the SKA In the case of SNRs, there is evidence of dust signatures in several
and its precursors, it will be necessary to develop new automated of them (Chawner et al. 2020). However, the ratio of mid-IR to radio
algorithms able not only to extract both extended and compact continuum emission results to be much lower than the infrared to
sources but also to classify them. In the context of Galactic studies, radio ratio observed in H II regions (Pinheiro Goncalves et al. 2011).
exploiting the possibility of comparing different morphologies or This can be used as efficient diagnostics to discriminate between a
different properties that sources manifest at different wavelengths, thermal and a non-thermal emitting bubble. A similar anticorrelation
in automated methods and using data mining capabilities, could be between radio emission and 8 μm IR emission is also established
particularly useful. (Brogan et al. 2006; Anderson et al. 2017).
There are many extended sources in the ASKAP SCORPIO field
with a roundish or shell-like structure (bubbles) that satisfy the
4.3 Synergies with existing Galactic plane surveys
morphological criterion for SNRs but also for H II regions and
Our view of the plane of the Galaxy has been completely revolution- evolved stars. Fig. 12 is a composite image of a portion of the
ized by a new generation of Galactic plane surveys as summarized by ASKAP SCORPIO field, for 341◦ ≤ l ≤ 348◦ and |b| ≤ 1◦ in both
Hoare et al. (2012). Of particular interest are the surveys conducted at dust and ionized gas. Dust, as traced at 8 and 70 μm, and ionized
infrared and longer wavelengths, which can penetrate the extinction gas, probed by the radio, are cospatial at large scales in star-forming
in the Galactic plane, tracing stars and nebulae (VVV; Minniti regions associated with H II regions, while there is a clear lack of dust
et al. 2010; GLIMPSE, Churchwell et al. 2006), the cold (HiGAL; associated with the radio in the case of known SNRs. The extended
Molinari et al. 2010), the warm (MIPSGAL, Carey et al. 2009; WISE, sources detected in SCORPIO therefore constitute a very promising
Wright, Eisenhardt & Mainzer 2010), and hot dust (GLIMPSE).
MNRAS 506, 2232–2246 (2021)You can also read