PAREameters: a tool for computational inference of plant miRNA-mRNA targeting rules using small RNA and degradome sequencing data
←
→
Page content transcription
If your browser does not render page correctly, please read the page content below
2258–2270 Nucleic Acids Research, 2020, Vol. 48, No. 5                                                           Published online 16 January 2020
doi: 10.1093/nar/gkz1234

PAREameters: a tool for computational inference of
plant miRNA–mRNA targeting rules using small RNA
and degradome sequencing data
                           1
Joshua Thody                   , Vincent Moulton1,* and Irina Mohorianu1,2,*
1
 School of Computing Sciences, University of East Anglia, Norwich NR4 7TJ, UK and 2 Wellcome-MRC Cambridge
Stem Cell Institute, University of Cambridge, Cambridge CB2 0XY, UK

                                                                                                                                                              Downloaded from https://academic.oup.com/nar/article-abstract/48/5/2258/5707202 by guest on 16 March 2020
Received October 23, 2019; Revised December 17, 2019; Editorial Decision December 22, 2019; Accepted December 24, 2019

ABSTRACT                                                                        teractions by combining small RNA (sRNA) sequencing
                                                                                and messenger RNA (mRNA) quantification (1). These im-
MicroRNAs (miRNAs) are short, non-coding RNAs                                   provements have also led to the sequencing and annotation
that modulate the translation-rate of messenger                                 of different organisms’ genomes and facilitated functional
RNAs (mRNAs) by directing the RNA-induced silenc-                               studies outside of the context of model organisms (2). How-
ing complex to sequence-specific targets. In plants,                            ever, a vast proportion of our understanding of specific bi-
this typically results in cleavage and subsequent                               ological mechanisms is based on the study of model organ-
degradation of the mRNA. Degradome sequencing                                   isms, mostly due to their lower regulatory complexity and
is a high-throughput technique developed to cap-                                availability of extensive, varied, public sequencing datasets.
ture cleaved mRNA fragments and thus can be used                                Many computational methods designed for extracting in-
to support miRNA target prediction. The current                                 formation and features from sequencing data (e.g. sRNA
criteria used for miRNA target prediction were in-                              classification and target prediction) often summarize the
                                                                                data-mining results into rule-based models, derived from
ferred on a limited number of experimentally vali-
                                                                                experimental observations. However, this approach carries
dated A. thaliana interactions and were adapted to                              the risk of overfitting a model (e.g. set of thresholds or ac-
fit these specific interactions; thus, these fixed cri-                         cepted ranges) on specific sets of observations.
teria may not be optimal across all datasets (organ-                               Small RNAs are short, non-coding RNAs with impor-
isms, tissues or treatments). We present a new tool,                            tant roles in transcriptional and post-transcriptional gene
PAREameters, for inferring targeting criteria from                              regulation in eukaryotes (3). In plants, the latter mode
small RNA and degradome sequencing datasets. We                                 of action is achieved via a class of sRNAs, the microR-
evaluate its performance using a more extensive set                             NAs (miRNAs), which reduce the amount of mRNA avail-
of experimentally validated interactions in multiple A.                         able for translation by directing the RNA-induced silenc-
thaliana datasets. We also perform comprehensive                                ing complex (RISC) to their sequence-specific mRNA tar-
analyses to highlight and quantify the differences                              get(s) and inducing cleavage and subsequent degradation of
                                                                                the mRNA (4). The miRNA classification criteria were first
between subsets of miRNA–mRNA interactions in
                                                                                proposed by Ambros et al. (5) and Meyers et al. (6); how-
model and non-model organisms. Our results show                                 ever, more recently these criteria have been updated based
increased sensitivity in A. thaliana when using the                             on a substantial increase in publicly available sequencing
PAREameters inferred criteria and that using data-                              datasets and known miRNA annotations by Axtell et al. (7).
driven criteria enables the identification of additional                        For example, the new miRNA annotation criteria (7) de-
interactions that further our understanding of the                              creased the stringency in the number of allowed mismatches
RNA silencing pathway in both model and non-model                               and asymmetric bulges compared to the previous annota-
organisms.                                                                      tion model (5, 6). In this study, we investigate the applicabil-
                                                                                ity and portability of the current miRNA target interaction
                                                                                model.
INTRODUCTION                                                                       Most miRNA target prediction tools use fixed rule-based
Improvements to Next Generation Sequencing technolo-                            targeting criteria, majority of which are variations of the
gies have resulted in larger and more diverse experiments,                      rules inferred by Allen et al. (8) on experiment specific,
including ones that make use of multiple data types, for                        low-throughput validated A. thaliana miRNA–mRNA in-
example, to increase prediction accuracy of regulatory in-                      teractions. We briefly overview these tools, starting with ap-

* To   whom correspondence should be addressed. Tel: +44 1603 592607; Fax: +44 1603 593345; Email: iim22@cam.ac.uk; Email: v.moulton@uea.ac.uk


C The Author(s) 2020. Published by Oxford University Press on behalf of Nucleic Acids Research.
This is an Open Access article distributed under the terms of the Creative Commons Attribution License (http://creativecommons.org/licenses/by/4.0/), which
permits unrestricted reuse, distribution, and reproduction in any medium, provided the original work is properly cited.
Nucleic Acids Research, 2020, Vol. 48, No. 5 2259

proaches relying solely on sequence properties, specifically       tions in various organisms have shown that currently im-
sequence complementarity within the target duplex, and             plemented criteria do not capture all known and expressed
continuing with tools that incorporate degradome datasets          miRNA–mRNA interactions (e.g. in A. thaliana (30) and O.
into their model. The former category comprises three web-         sativa (31)). This is further borne out by our analysis, where
servers: (i) miRU (9), for which the predictions rely on a         we show that, by following a similar approach for manually
rule-based model that limits the number of mismatches,             inferring targeting criteria as Allen et al. (Supplementary
G:U pairs and asymmetric bulges; to reduce the false pos-          Table S1), we achieve a sensitivity increase of ∼15% when
itive rate, the miRU predictions are optionally subject to         evaluating on a more extensive set of experimentally vali-
a conservation analysis to filter those with predicted tar-        dated interactions in A. thaliana (Supplementary Table S2).
get sites existing in other genomes; (ii) psRNATarget (10),        In addition, the portability of current criteria across organ-
which uses two sets of criteria for prediction, V1 (10) and        isms and tissues has not yet been quantitatively evaluated.
V2 (11), the former uses the same scoring system as miRU           Furthermore, the sensitivity and precision of a set of predic-

                                                                                                                                     Downloaded from https://academic.oup.com/nar/article-abstract/48/5/2258/5707202 by guest on 16 March 2020
complemented with an analysis of the target site accessi-          tions may differ based on the size or characteristics of the
bility using the RNAup (12) program; the latter is based           input data. For example, the functional analysis of a spe-
on the V1 criteria with and increased size of the seed re-         cific miRNA may benefit from reduced precision, yet good
gion, from 2–8 nt to 2–13 nt based on a previous study             sensitivity, to increase the number of candidates for further
(13); (iii) Tapir (14), which uses the FASTA local alignment       investigations; whereas an analysis on the entire set of sR-
algorithm (15) to predict duplexes, which are then subject         NAs requires concerted high sensitivity and precision.
to hybridization analysis using RNAhybrid (16). Criteria              In this study, we propose a new tool, PAREameters,
similar to those postulated in Allen et al. (8) are imple-         for data-driven inference of plant miRNA targeting crite-
mented in TargetFinder (17) in which the rule-based scor-          ria. Using publicly available sequencing datasets, we illus-
ing system is used in conjunction with a Smith–Waterman            trate how PAREameters extracts information from paired
alignment algorithm in the FASTA package (15) to find              sRNA and degradome sequencing data, in conjunction with
valid miRNA–mRNA duplexes. One particularly promi-                 miRNA annotations (e.g. from miRBase (32)), to infer cri-
nent problem with fixed, sequence-based targeting criteria         teria that results in an increase in sensitivity when evaluated
are how they address miRNA–mRNA target sites that con-             in A. thaliana. We show that different subsets of miRNA–
tain central mismatches (7), e.g. psRNATarget classifies all       mRNA interactions, such as those containing conserved or
interactions containing central mismatches as translational        species-specific miRNAs, those found in monocots and di-
repression ones (10, 11). However, this contradicts the more       cots, and those identified in model and non-model organ-
refined set of potential outcomes illustrated in the literature,   ism, display variation in their target interaction properties.
namely that central mismatches can induce mRNA cleav-              The tool is freely available, open source and provided as part
age (8), act as target-mimics (18, 19), cause translational re-    of the UEA sRNA Workbench (33).
pression (20) or simply be non-functional (21). Thus, with-
out additional data it is difficult to predict miRNA function      MATERIALS AND METHODS
based solely on complementarity patterns.
                                                                   The PAREameters pipeline
   One such type of additional data is Parallel Analysis
of RNA ends (PARE) sequencing (22), also known as de-              In Figure 1, we present an overview of the PAREameters
gradome sequencing, which captures the 5 ends of down-            pipeline. The input consists of synonymous sRNA and
stream cleaved mRNAs and can be used to quantitatively             PARE samples; technical or biological replicates can be
predict miRNA–mRNA interactions (23). Tools for pre-               used for assessing technical variation and noise between
dicting miRNA targets that combine the Allen et al. crite-         samples or for the exclusion of spurious results. An an-
ria, with minor variations, and degradome sequencing data,         notated reference genome and transcriptome, and a set of
in chronological order, are CleaveLand4 (23), PAREsnip             known plant miRNAs (e.g. from miRBase (32)) are also re-
(24), sPARTA (25) and PAREsnip2 (26). The performance              quired. The tool’s output consists of miRNA predictions
of these tools on the model plant A. thaliana was recently         and their mRNA targets, based on a set of highly permis-
compared in a previous study (26), using an updated set of         sive parameters (Supplementary Table S1). PAREameters
low-throughput, experimentally validated interactions ob-          also provides a set of suggested targeting criteria, based on
tained by combining interactions previously published in           these predictions, but also provides the properties of these
the literature (24, 27, 28) and entries from miRTarBase (29)       interactions as individual outputs. In doing so, the user can
with any duplicates removed. The performance evaluation,           interpret the results manually to infer criteria that satisfy
over three biological replicates, demonstrated that even the       their sensitivity and precision requirements.
most sensitive tool, PAREsnip2, was only able to capture              The first stage of the pipeline is to remove low qual-
∼80% of the expressed and experimentally validated inter-          ity reads, sequencing errors or to identify sample outliers,
actions when using the Allen et al. criteria. Further analyses     PAREameters includes several optional filtering methods:
revealed that the remaining ∼20% were missed mostly due            (i) sequences containing ambiguous bases (e.g. Ns) are dis-
to discrepancies in the number or position of mismatches,          carded; (ii) a low sequence complexity filter is applied based
gaps, G:U pairs and the minimum free energy (MFE) ratio.           on the single, di- or tri-nucleotide frequencies (26), with
   These results suggest that the current target criteria may      set thresholds of 75%, 37.5% and 25%, respectively; (iii) all
be too stringent or over-fitted on a small set of organism, tis-   reads that do not align to the provided reference genome
sue or treatment specific experimentally validated miRNA–          are discarded. We now explain each of the other stages of
mRNA interactions. Analyses of miRNA–mRNA interac-                 the pipeline in more detail.
2260 Nucleic Acids Research, 2020, Vol. 48, No. 5
miRNA prediction
The miRNA candidates used as input for PAREameters are
obtained via two approaches: (i) with focus on conserved
miRNAs, the input sRNA samples are aligned (+/+ strand
only) to all known plant miRNA sequences, obtained from
miRBase (32), allowing up to two mismatches and no gaps.
The selected sequences are then used as input to miRPlant
(34). Candidates that fulfill the criteria for miRNA predic-
tion (default parameters) are then retained for the subse-
quent steps; (ii) with focus on all miRNAs (conserved and
new) as predicted using miRCat2 (35) (default plant pa-
rameters) with the whole sRNA sample as input. All data
Downloaded from https://academic.oup.com/nar/article-abstract/48/5/2258/5707202 by guest on 16 March 2020
pre-processing required to run the miRNA prediction tools,
such as building the bowtie index and organizing the se-
quencing data into non-redundant format, are handled by
PAREameters.
Target prediction using permissive criteria
Small RNAs that satisfy miRNA biogenesis criteria (as de-
scribed above) are provided as input to PAREsnip2 (26).
Also to compensate the stringent criteria of miRNA predic-
tion tools, the user can provide their own annotated miRNA
entries if they have an abundance ≥5 (user-defined param-
eter) but did not fulfill the criteria of the prediction tools.
The target prediction is then performed on the input data
using a set of highly-permissive, user-configurable, parame-
ters (Supplementary Table S1).
The miRNA–mRNA interactions predicted by PAREs-
nip2 are kept if the abundance of the peak of interest is
≥5 and are further classified into high-confidence (HC) or
low-confidence (LC). For the former, the peak is the high-
est across the whole transcript (i.e. category 0 or 1); for the
latter, the peak is not the highest on the transcript (i.e. cat-
egory 2 or 3). The categorization of miRNA–mRNA inter-
actions used for this study is based on the distribution of
abundances of the degradome reads aligned to each tran-
script, as previously described (23–26). Briefly, peaks of cat-
egories 0 to 3 correspond to reads with abundance >1: cat-
egory 0 peaks correspond to reads with maximum abun-
dance on a transcript where there is only one maximum;
similarly, category 1 peaks indicate the read with the max-
imum abundance on a transcript, for which there is more
than one maximum; category 2 and category 3 peaks corre-
spond to reads with abundance above and below the average
read abundance on the transcript, respectively. Peaks with
abundanceNucleic Acids Research, 2020, Vol. 48, No. 5 2261
jacent mismatches, the alignment score and the minimum cumulative distributions were directly compared using the
free energy (MFE) ratio. The algorithm then infers a set Kolmogorov–Smirnov test and the P-value was reported.
of targeting criteria that attempts to retain at least 85% The significance threshold for all statistical tests was set at
(user-defined parameter) of the valid miRNA–mRNA du- 0.05
plexes. We chose the default value of the retain rate parame-
ter based on the analysis of sensitivity gain against precision
loss of inferred criteria across an incremental range of retain Implementation of PAREameters
rate values on a benchmark leaf A. thaliana dataset com-
The PAREameters tool was implemented in Java (version
prising three replicates (26), presented in the results. The bi-
8); the code used to create the plots and perform the sig-
ological interpretation of the retain rate threshold is that a
nificance tests is implemented in R (version 3.5.1, Apple
higher degree of complementarity between a miRNA and
Darwin) and is invoked from the PAREameters pipeline us-
its target results in higher confidence that the interaction is
ing system calls, assuming a valid version of R is installed
Downloaded from https://academic.oup.com/nar/article-abstract/48/5/2258/5707202 by guest on 16 March 2020
genuine, whereas interactions with weaker complementarity
and correctly configured. All computational analyses and
may require further experimental validation.
benchmarking were performed on a desktop machine run-
Using a set of experimentally validated interactions as
ning Ubuntu 18.04 equipped with a 3.40GHz Intel Core
validation (26), we focused on HC interaction pairs at
i7–6800K six core CPU and 128GB RAM. PAREameters
known target sites with corresponding miRNAs (32). The
is optimized both in runtime and computational resource
validation classes, true positives (TP), false positives (FP)
usage; the analysis of a typical A. thaliana and T. aestivum
and positives (P) are used in a loose sense, i.e. TP consists
sample completes in ∼30 min and 1 day 10 h, with 6 and 10
of the predicted interactions with experimental validation,
GB memory (RAM) requirements, respectively. PAREame-
FP is the set of predicted interaction for which, currently,
ters is a user-friendly, cross-platform (Windows, Linux and
there is no experimental validation, and P is the set of ex-
MacOS) application that enables users to analyze sequenc-
perimentally validated interactions with corresponding HC
ing datasets without the need of specialized support or ded-
peaks. For each set of targeting rules, we present the sensi-
icated hardware.
tivity as Se = TP / P (proportion of predicted validated in-
teractions) and the precision as PPV = TP / (TP+FP) (pro-
portion of validated interactions, out of the total number of
Datasets
reported interactions). In our evaluation, we did not include
specificity as a measure of performance because the class of Three A. thaliana datasets were used comprising paired
true negatives (TN) cannot be accurately determined. The sRNA and PARE samples: (D1) wild-type leaf tripli-
set of TN comprises the interactions for which there is ex- cates (D1A, D1B and D1C), GSE90771 (sRNAs) (35) and
perimental evidence that interactions do not occur; since GSE113958 (PARE) (26); (D2) wild-type leaves in a growth
the current available information is based on positive events, time-series at 35 days (D2A), 45 days (D2B) and 50 days
i.e. experimental validation confirming the interaction hap- (D2C), GSE55151 (37); (D3) wild-type flower (D3A), leaf
pens within an experimental context, it is not possible to ob- (D3B), root (D3C) and seedling (D3D) of plants grown at
tain a comprehensive set of TN data. Moreover, degradome 15◦ C, NCBI BioProject PRJNA407271 (38). The genome
based miRNA target prediction tools are validation-driven, and transcriptome versions are TAIR10 and were obtained
i.e. they only report interactions that are predicted to be TP from The Arabidopsis Information Resource (39). The set
based on the defined criteria, which makes it impossible to of experimentally validated A. thaliana miRNA–mRNA in-
perform the specificity calculation as perceived TN results teractions were obtained from a previous study (26).
are not reported. In addition to the A. thaliana datasets, we exemplify the
In addition, PAREameters provides a summary of the in- usage of PAREameters on sRNA and corresponding PARE
teraction properties, enabling the manual curation of the re- datasets from A. trichopoda leaf (D4A) and opened female
sults and allowing the user to choose a set of targeting cri- flower (D4B) (GSE41811), G. max leaf (D5) (GSE76636)
teria that satisfies their choice of sensitivity and precision. (40), O. sativa inflorescence (D6) (GSE18251) (41) and T.
The significance of the distribution of properties with re- aestivum 2.2mm spikes (D7) (GSE36867) (42). The tran-
spect to a reference set of miRNA–mRNA interactions was scriptome and genome sequences for organisms other than
calculated using offset 2 tests and the contribution of each A. thaliana were obtained from EnsemblPlants Release 43
feature was assessed using individual Fisher exact tests (36) (43), namely, A. trichopoda genome version AMTR1.0, an-
(e.g. when comparing conserved versus species-specific in- notation version AMTR1.0, G. max genome version 2.1, an-
teractions, the former is considered the reference). The 2 notation version 2.1, O. sativa genome version IRGSP-1.0,
tests were used to assess the overall differences in distribu- annotation version IRGSP-1.0, T. aestivum genome version
tions, across all 21 positions, whereas the Fisher exact tests IWGSC (genome build accession GCA 900519105.1), an-
compared the values for each individual position, against notation version IWGSC.
the sum of values for all remaining 20 positions. Finally, the Summaries of each dataset, such as the number of raw
relative distributions of miRNA–mRNA duplex MFE ra- and unique reads and genome matching reads, are presented
tios (8, 26) were analyzed using Kolmogorov–Smirnov tests; in Supplementary Table S4. In addition, for the sRNA data,
briefly, the distributions were first sampled, without replace- we report the number of known miRNAs present (based on
ment, to the same number of entries (given the high number current miRBase (Release 22) (32) annotation) and for the
of measurement present in each of compared subsets, this PARE data, we also include the number of transcriptome
did not distort the original MFE distributions); next, the matching reads.2262 Nucleic Acids Research, 2020, Vol. 48, No. 5
RESULTS PAREameters on each dataset. The runtime of the pipeline
depends on the size of the input data (sequencing depth
Evaluation of inferred targeting rules in A. thaliana
of the sRNA and PARE samples and the size of the ref-
We first illustrate the differences in sensitivity and precision erence genome). On A. thaliana D1, D2 and D3 datasets,
between two sets of manually inferred criteria in A. thaliana. the runtime range was 16 min and 52 s to 1 h 4 min (this
These criteria are those previously defined by Allen et al. excludes the time taken to build the bowtie index as this is
and those we manually inferred on a more comprehensive only done once per species) and the memory usage varied
set of experimentally validated interactions (26). We then between 5GB and 8GB (Supplementary Table S6). The in-
highlight the advantages of the data-driven approach im- ference component of PAREameters is linear on the size of
plemented in PAREameters by presenting the increase in the sRNA and PARE input data.
sensitivity of the computationally inferred targeting rules
compared with the Allen et al. criteria when benchmarked Evaluation of data input size and retain rate on sensitivity
Downloaded from https://academic.oup.com/nar/article-abstract/48/5/2258/5707202 by guest on 16 March 2020
on multiple A. thaliana datasets. and precision. We now demonstrate that the increase in
Using the A. thaliana leaf dataset (D1), we employed sensitivity of the PAREameters inferred criteria when com-
two sets of targeting criteria, the Allen et al. criteria and pared to the Allen et al. criteria is not a result of overfit-
criteria we manually inferred from a set of validated A. ting on the input data by evaluating performance using a
thaliana miRNA–mRNA interactions (26) (Supplementary cross-validation approach. We then show how increasing
Table S1). These criteria were provided as input parame- the amount of training data may lead to a more accurate
ters for PAREsnip2 (26), which is highly configurable and representation of inferred targeting criteria. Finally, we as-
designed to handle the prediction of all sRNA targets from sess how the retain rate parameter impacts sensitivity and
sequencing data (paired sRNA and degradome). The evalu- precision of the PAREameters inferred criteria.
ation of these criteria showed an increase in sensitivity from Based on the properties of HC miRNA–mRNA du-
78.5–81.4% to 94.5–96.2%, with precision values of 88.7– plexes with cleavage signal confirmation in the PARE data,
92.1% and 82.1–85.9% for the Allen et al. criteria and the PAREameters inferred targeting criteria that increased the
manually inferred criteria, respectively (Supplementary Ta- sensitivity and retained precision versus existing fixed crite-
ble S2), over three biological replicates. Upon further in- ria when tested against the set of experimentally validated
spection, the majority of validated interactions that were interactions in A. thaliana. To avoid the overfitting of tar-
missed using the manually inferred criteria were due to hav- geting criteria based on characteristics of the input data,
ing an MFE ratio less than the selected cut-off value of we tested the stability of the inferred properties using a
0.65. The MFE ratio quantifies the hybridization strength cross-validation technique and the set of experimentally val-
between the miRNA and its target and thus a higher cut-off idated A. thaliana miRNA–mRNA interactions on the D1,
value may result in interactions more likely to cause cleav- D2 and D3 datasets. Specifically, we used the HC interac-
age being reported. tions with corresponding miRNA sequences in each dataset
The increase in performance of the manually inferred cri- as a starting point. We then randomly split the HC vali-
teria may be due to over-fitting on the larger set of inter- dated interactions in each dataset to form two groups: the
actions. In addition, due to the scarcity of validated inter- training group, containing 75% of the data, and the test-
actions (either as number of valid interactions or localiza- ing group, which contained the remaining 25%. PAREame-
tion of specific modes of action in different cell types (44)), ters was used to infer parameters on the training set and
these criteria may not be portable between various organ- these were employed by PAREsnip2 for target prediction
isms or tissues. Therefore, we used the PAREameters tool to on the test set. We then calculated the sensitivity and pre-
infer targeting criteria from the A. thaliana D1, D2 and D3 cision of the inferred parameters on the training set and
datasets. The resulting criteria (Supplementary Table S5) on the test set. The random cross-validation was repeated
were then utilized by PAREsnip2 for target prediction and 50× and the results (Supplementary Table S7) show that
the results evaluated and compared to the predictions ob- PAREameters is able to infer targeting parameters with a
tained using the Allen et al. criteria. The evaluation method median sensitivity of 77.5% (range: 67.0–81.3%) and pre-
used is identical to that of the manually inferred criteria. cision 83.2% (range: 75.0–100.0%) when evaluated on the
Specifically, for each dataset, the class of positive (P) data unobserved testing data.
included experimentally validated miRNA–mRNA interac- The decrease in sensitivity from our previous analysis
tions with HC transcript peaks and corresponding miRNA likely originates from the fact we are inferring criteria from
sequence with abundance ≥5. one set of miRNA–mRNA interactions and testing on a
The results, presented in Table 1, show that the computa- different set of miRNA–mRNA interactions. Whereas pre-
tionally inferred criteria provide increased sensitivity com- viously, we were inferring criteria from the whole set of
pared to the Allen et al. criteria, whilst also maintaining PAREameters predicted HC miRNA–mRNA interactions.
precision on most datasets. Over all datasets, PAREameters This further supports our hypothesis that miRNAs may
inferred criteria with a median sensitivity of 88.5% (range: have different modes of action or target complementar-
82.8–89.4%) versus 81.4% (range: 75.6–84.6%) for the Allen ity requirements and demonstrates that using just one set
et al. criteria. The median precision for the PAREame- of fixed criteria may not be sufficient when performing
ters inferred criteria was 91.3% (range: 80.1–96.8%) ver- miRNA target prediction.
sus 91.4% (range: 83.8–97.5%) for the Allen et al. criteria. To investigate further how increasing the amount of
We also evaluated the time and memory performance of training data may lead to a more accurate representationNucleic Acids Research, 2020, Vol. 48, No. 5 2263
Table 1. Comparison of sensitivity and specificity between the Allen et al. criteria and the PAREameters inferred criteria on the A. thaliana datasets
# Allen Inferred Inferred Inferred Allen Inferred PPV
Dataset miRNAs #V V V Allen NV NV Allen Se Se PPV PPV Se gain difference
D1A 37 129 105 112 9 8 81.4% 86.8% 92.1% 93.3% 5.4% 1.2%
D1B 38 131 109 116 11 10 83.2% 88.5% 90.8% 92.0% 5.3% 1.2%
D1C 35 121 95 107 12 14 78.5% 88.4% 88.7% 88.4% 9.9% -0.3%
D2A 40 140 117 125 14 29 83.5% 89.3% 89.3% 81.1% 5.8% -8.2%
D2B 38 137 113 121 13 30 82.4% 88.3% 89.6% 80.1% 5.9% -9.5%
D2C 40 144 117 120 3 4 81.2% 83.3% 97.5% 96.7% 2.1% -0.8%
D3A 32 79 64 68 4 7 81.0% 86.1% 94.1% 90.6% 5.1% -3.5%
D3B 29 70 57 58 11 13 81.4% 82.8% 83.8% 81.6% 1.4% -2.2%
D3C 36 111 84 98 6 7 75.6% 88.2% 93.3% 93.3% 12.6% 0.0%
D3D 35 104 88 93 3 3 84.6% 89.4% 96.7% 96.8% 4.8% 0.1%
Downloaded from https://academic.oup.com/nar/article-abstract/48/5/2258/5707202 by guest on 16 March 2020
The PAREameters inferred criteria lead to an increased sensitivity; the apparent loss in precision may be due to the incomplete characterization (and
validations) of regulatory interactions and can only increase as more experimentally confirmed interactions become available. V = validated interactions,
NV = non-validated interactions, Se = sensitivity and PPV = precision.
of inferred targeting criteria, we evaluated the computation- Se/PPV ratio2264 Nucleic Acids Research, 2020, Vol. 48, No. 5
Downloaded from https://academic.oup.com/nar/article-abstract/48/5/2258/5707202 by guest on 16 March 2020
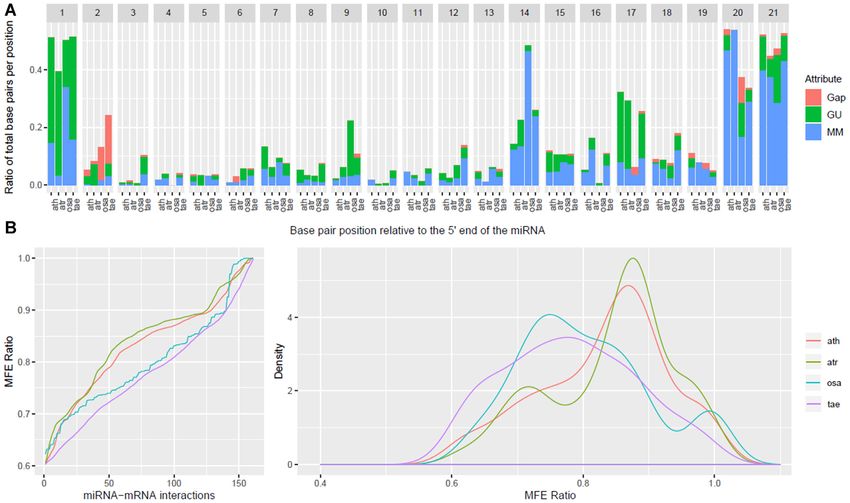
Figure 2. Side-by-side comparison of property distributions for conserved and species-specific miRNAs in A thaliana. Using experimentally validated
miRNA–mRNA interactions as input, we calculated the position-specific properties (A) and the MFE ratio distribution (B) for the conserved and species-
specific miRNA–mRNA interactions; the former are presented as proportions out of all interactions for each category and the latter as a cumulative
distribution. The significance of the differences in the localization of gaps, G:U pairs and mismatches were assessed using offset 2 tests and the contribution
of individual categories was evaluated using Fisher exact tests. The first position and the 8–10 range, important for the cleavage ability of the miRNA,
showed significant/marginal significant differences; in addition, positions 14 and 16 illustrated the divergence in properties between these subsets. The
similarities in the distributions of the MFE ratios were evaluated using the Kolmogorov–Smirnov test, which reported a P-value of 8.57 × 10⁻¹⁰ , the
distributions of MFE ratios were different both in location of the mode and the shape of the distributions.
positions 5, 8 and 9, in addition to the canonical position miRNAs and their targets than that of species-specific
10 of the miRNA. miRNAs.
To evaluate whether the differences in properties be- To investigate the portability between criteria inferred ex-
tween specific-specific and conserved miRNA interactions clusively on conserved or species-specific miRNA interac-
in A. thaliana are significant, we performed 2 tests of sig- tions, we evaluated the inferred rules of each set of inter-
nificance using the conserved properties as the expected actions (all four pairwise combinations: conserved rules on
distribution and the species-specific properties as the ob- conserved interactions, conserved rules on species-specific
served distribution. Additionally, we use the Fisher’s ex- interactions and the similar pairs on the species-specific
act test to determine the specific property at each position rules), using PAREsnip2. The results, presented in Table 3,
responsible for the significance of the differences. The re- show a consistent decrease in sensitivity for both the con-
sults of the significance analysis for the position-specific served and species-specific miRNAs when inferring criteria
property distributions are presented in Table 2. Based on on the other subset of miRNA–mRNA interactions. Specif-
the 2 tests, significant differences between properties can ically, a decrease from 82.1% to 65.7% and 76.1% to 56.0%
be found at positions 1, 5, 8, 14, 16 and 21. Based on for the conserved and species-specific miRNA–mRNA in-
the Fisher’s exact test, position 16 has significant differ- teractions, respectively. Further investigation into these dif-
ences in both proportions of mismatches and G:U pairs, ferences support our previous observation regarding the
positions 5, 8, 14, 20 and 21 have significant differences differences in MFE ratio of conserved and species-specific
in proportion of mismatches and positions 1 and 13 have miRNA interactions, with the inferred values being 0.75
significant differences in the proportion of G:U pairs. We and 0.68, respectively, further supporting our previous ob-
also analyzed the differences in MFE ratio distributions servation regarding an increased complementarity require-
between conserved and species-specific miRNAs, shown in ment for conserved miRNAs. Another intriguing difference
Figure 2B, and the significance of the differences were eval- between the inferred criteria is an allowed mismatch or G:U
uated using a Kolmogorov–Smirnov test, which reported pair at position 10 of the species-specific miRNAs.
a P-value of 8.57 × 10⁻¹⁰ . These results may suggest a The differences between the properties of conserved and
higher complementarity requirement between conserved species-specific miRNA–mRNA interactions highlight theNucleic Acids Research, 2020, Vol. 48, No. 5 2265
Table 2. 2 and Fisher’s exact test significance results on the position- matches and gaps, and Figure 3B shows the MFE ratio dis-
specific properties for conserved and species-specific miRNA–mRNA in- tributions for the miRNA–mRNA duplexes from flower tis-
teractions in A. thaliana. The contribution of specific properties, such as sue across organisms in A. thaliana, A. trichopoda, O. sativa
mismatch (MM), G:U pair and gap is assessed using Fisher exact tests. The and T. aestivum. Similar plots for leaf tissue in A. thaliana,
first position and the 8–10 nt region (which is important for inducing cleav-
A. trichopoda and G. max are presented in Supplementary
age) are either significant or marginally significant, indicating a potential
divergence in the type of interactions of either conserved or species-specific
Figure S2.
miRNAs The distributions of position-specific properties in flower
tissue show interesting variations between species. To eval-
2 MM G:U Gap uate whether the non-model organism distributions differ
1 0.00 0.08 0.01 1.00 from the A. thaliana distributions, we used the offset 2
2 0.58 1.00 0.36 0.72 test and a localized Fisher’s exact test (Table 5). The former
3 0.71 1.00 0.62 1.00 show significant differences at position 1, positions 1, 2, 9,
Downloaded from https://academic.oup.com/nar/article-abstract/48/5/2258/5707202 by guest on 16 March 2020
4 0.13 1.00 0.06 1.00 14, 17 and 20, and positions 2, 3 and 20, for A. trichopoda, O.
5 0.02 0.03 0.11 0.99
6 0.71 0.99 0.27 0.99
sativa and T. aestivum, respectively. The results of the local-
7 0.77 1.00 0.43 1.00 ized Fisher’s exact test show significant differences between
8 0.01 0.00 1.00 1.00 mismatches at position 1, positions 1, 14, and 20, and po-
9 0.34 0.11 0.53 0.99 sitions 14 and 20, for A. trichopoda, O. sativa and T. aes-
10 0.18 0.11 0.21 0.99 tivum, respectively, supporting the conclusion that species
11 0.56 0.43 0.62 1.00
12 0.76 0.49 0.99 1.00 specific, data driven criteria could facilitate a better descrip-
13 0.10 0.25 0.10 1.00 tion of the miRNA–mRNA interactions. Additionally, the
14 0.02 0.00 1.00 0.68 tests show significant differences between G:U pairs at po-
15 0.99 1.00 0.99 1.00 sitions 1, 7, 9 and 17 in O. sativa and significant differences
16 0.00 0.00 0.00 1.00
17 0.36 0.48 0.43 0.27
in gaps at position 2 for both O. sativa and T. aestivum.
18 0.59 0.74 0.49 0.62 In addition to the position-specific properties, the MFE
19 0.42 0.19 0.68 1.00 ratio was also investigated as a discriminative feature (Fig-
20 0.10 0.04 0.59 1.00 ure 3B); the Kolmogorov–Smirnov test was used to eval-
21 0.00 0.00 0.81 1.00 uate differences between distributions of different species.
The distribution of MFE ratios and results of the statistical
test, presented in Supplementary Table S12, illustrates the
need for customization in the set of criteria used for describ- differences between monocots and dicots, with significant
ing and capturing miRNA–mRNA interactions when con- differences only reported when comparing different groups.
served or species-specific miRNAs are involved. The differences observed between conserved and specific-
specific miRNAs in A. thaliana prompted a similar inves-
tigation in other, non-model organisms. Similarly, as for
Evaluation of miRNA targeting criteria in non-model organ-
A. thaliana miRNA interactions, we classified the miR-
isms
NAs that had HC predicted interactions, as reported by
Current miRNA targeting rules, inferred on interactions, PAREameters, into conserved or species-specific for each
mostly consisting of conserved miRNAs from A. thaliana of the non-model organisms. Specifically, miRNAs present
(8), have been applied to other species for target prediction only in an individual clade, based on current miRBase
(45–48). However, to the best of our knowledge, no compre- annotations (Release 22) (32), were considered species-
hensive investigation into the suitability of these fixed tar- specific; otherwise they were classified as conserved. The
geting criteria has been performed in non-model organisms. conservation analysis was done against the current miRNA
The characterization of miRNA–mRNA interactions has variants from miRBase, allowing up to two mismatches (on
been facilitated by both the increased complexity of exper- any positions) and no gaps. If a miRNA predicted on a non-
iments involving non-model plant species and through the model organism dataset did not match any miRNA vari-
analysis of RNA degradation profiles (PARE (22) sequenc- ant in miRBase or aligned only to a known species-specific
ing and more recently NanoPARE (49)), which despite tech- miRNA, then it would be classified as a species-specific,
nical limitations (e.g. sequencing bias (50)) can provide re- otherwise the miRNA was classified as conserved. The sum-
liable high-throughput pseudo-validation of microRNA- maries of the position-specific properties distributions and
mediated cleavage sites. MFE ratio distributions for each of the non-model organ-
To investigate the suitability and portability of the fixed isms are presented in Supplementary Figures S3–7. The re-
Allen et al. criteria on non-model organisms and eval- sults of the significance tests comparing the conserved and
uate the scope for customized, organism-specific rules, species-specific properties are presented in Supplementary
we conducted an exploratory analysis using as input the Tables S13–17.
HC degradome-supported miRNA–mRNA interactions To illustrate the impact of the differences between target-
reported by PAREameters. We compared the inferred rules ing properties and subsequently inferred targeting criteria
for flower and leaf tissues in several organisms to pro- in non-model organisms, we focus on the results in T. aes-
duce a quantitative summary of the variation ranges of tivum (Wheat), presented in Supplementary Figure S7 and
thresholds for the selected rules. Table 4 shows these sum- Supplementary Table S17. Out of the 21 positions analysed,
maries of inferred criteria per organism; Figure 3A illus- 9 had significant differences based on the 2 tests (the con-
trates the position-specific distributions of G:U pairs, mis- served properties were considered the expected distribution2266 Nucleic Acids Research, 2020, Vol. 48, No. 5
Table 3. Sensitivity on cross pairwise comparisons for criteria inferred on conserved or species-specific miRNAs for the validated A. thaliana interactions.
The targeting criteria were inferred using a retain rate of 0.85; a considerable decrease in sensitivity was observed for the mismatched pairs i.e. training on
conserved and testing on specific and the symmetric pair, highlighting the impact of data-inferred targeting criteria.Parameter
Inferred interactions Evaluated interactions Possible Captured Sensitivity
Conserved Conserved 201 165 82.1%
Specific Conserved 201 132 65.7%
Specific Specific 184 140 76.1%
Conserved Specific 184 103 56.0%
Downloaded from https://academic.oup.com/nar/article-abstract/48/5/2258/5707202 by guest on 16 March 2020
Figure 3. Side-by-side comparison of flower miRNA–mRNA interaction property distributions in monocots and dicots. The position-specific properties
(A) and MFE ratio distribution (B) of miRNA–mRNA interactions from flower tissues in A. thaliana, A. amborella, O. sativa and T. aestivum. The position-
specific properties showed significant differences at certain positions and there is a clear separation in the MFE distributions between monocots and dicots.
The differences in properties for particular organisms from the current A. thaliana inferred criteria (e.g. MMs at position 1 for A. amborella, G:U pairs at
position 9 for O. sativa, and almost perfect complementarity at positions 16–17 for O. sativa) and the distinction observed for the MFE ratios support the
hypothesis that species or tissue specific, and data-inferred criteria may reveal a more accurate set of miRNA–mRNA regulatory interactions.
Table 4. Overview of data-inferred thresholds inferred using PAREameters on model and non-model organisms in flower and leaf tissue. Differences in
reported thresholds are observed both between organisms (e.g. monocots versus dicots) and between tissues
Flower tissue Leaf tissue
A. thaliana A. trichopoda T. A. thaliana A. thaliana A. trichopoda
(D3A) (D4B) O. sativa aestivum (D1A) (D2B) (D4A) G. Max
Allow MM at Yes No No Yes Yes Yes No Yes
position 10
Allow MM at Yes Yes No Yes Yes Yes Yes Yes
position 11
Max # adjacent MM 0.00 0.00 0.00 0.00 0.00 0.00 0.00 0.00
in CR
Max # MM in CR 1.00 1.00 1.00 1.00 1.00 1.00 1.00 1.00
Max score 4.50 4.50 4.00 5.00 4.50 5.00 4.50 4.50
Max # MM 3.00 3.00 3.00 3.00 3.00 3.00 3.00 3.00
Max # G:U 2.00 2.00 2.00 2.00 2.00 2.00 2.00 2.00
Max # adjacent MM 1.00 1.00 0.00 1.00 1.00 1.00 1.00 1.00
MFE ratio cut-off 0.72 0.72 0.70 0.66 0.69 0.65 0.71 0.69Nucleic Acids Research, 2020, Vol. 48, No. 5 2267
Table 5. 2 and Fisher’s exact test significance results on the position-specific properties for non-model organisms versus A. thaliana in flower tissue. The
first position and the ninth suggest that subtle differences do exist between A. thaliana and other organisms in key positions that determine the selection
and mode of action for miRNAs
Species A. trichopoda O. sativa T. aestivum
Position 2 MM GU Gap 2 MM GU Gap 2 MM GU Gap
1 0.03 0.00 1.00 1.00 0.00 0.00 0.00 1.00 0.99 1.00 1.00 1.00
2 0.66 1.00 0.37 1.00 0.03 0.62 0.36 0.02 0.00 0.36 1.00 0.00
3 1.00 1.00 1.00 1.00 0.95 0.99 1.00 0.99 0.05 0.21 0.06 0.99
4 0.95 1.00 0.62 0.99 0.79 0.62 1.00 1.00 0.91 0.99 1.00 1.00
5 0.92 0.62 1.00 0.99 0.64 0.68 0.36 0.99 0.94 1.00 1.00 1.00
6 0.79 1.00 1.00 0.62 0.39 1.00 0.21 1.00 0.61 0.44 0.36 0.99
7 0.38 0.53 0.25 1.00 0.18 0.61 0.05 1.00 0.55 0.53 0.40 1.00
Downloaded from https://academic.oup.com/nar/article-abstract/48/5/2258/5707202 by guest on 16 March 2020
8 0.68 1.00 0.44 1.00 0.91 1.00 0.72 1.00 0.94 1.00 0.56 0.99
9 0.56 0.99 0.36 1.00 0.00 0.99 0.00 1.00 0.12 0.72 0.06 1.00
10 0.79 0.62 1.00 1.00 0.71 0.62 1.00 1.00 0.79 1.00 0.36 0.99
11 0.84 0.72 1.00 1.00 0.38 0.21 1.00 1.00 0.79 1.00 0.62 1.00
12 0.93 1.00 1.00 1.00 0.9 1.00 0.49 0.99 0.15 0.08 0.72 1.00
13 0.73 0.68 0.36 0.99 0.61 0.33 0.68 1.00 0.92 1.00 1.00 1.00
14 0.22 0.83 0.04 0.99 0.00 0.00 1.00 1.00 0.19 0.04 1.00 1.00
15 0.98 0.99 0.79 0.99 0.33 0.40 0.21 1.00 0.50 0.56 0.25 1.00
16 0.10 0.05 0.44 1.00 0.43 0.21 1.00 1.00 0.53 0.56 0.44 1.00
17 0.95 0.61 1.00 1.00 0.00 0.40 0.00 0.62 0.51 .001 0.16 0.99
18 0.49 0.79 0.36 1.00 0.12 0.13 0.21 1.00 0.18 0.49 0.11 1.00
19 0.37 0.79 0.36 0.62 0.59 1.00 0.21 1.00 0.53 0.53 0.99 0.62
20 0.16 0.39 0.11 0.62 0.00 0.00 0.14 0.08 0.02 0.01 0.99 0.62
21 0.44 0.88 0.23 1.00 0.28 0.10 0.43 0.62 0.83 0.77 0.65 1.00
Table 6. Intersection analysis of interactions predicted using either the Allen et al. rules or the PAREameters inferred rules on various datasets. The number
of interactions reported by PAREsnip2 using the Allen et al. criteria and the PAREameters inferred criteria on the non-model organisms varies between
organisms and tissues; the number in brackets represents the miRNAs and interactions specific to the criteria used and could be used to approximate the
accuracy of the prediction on non-model organisms. The exact sensitivity and precision values cannot be computed on non-model organisms due to the
lack of a large enough set of validated interactions
Dataset Allen et al. miRNAs Allen et al. interactions Inferred miRNAs Inferred interactions
D4A 70 (3) 203 (9) 72 (5) 210 (16)
D4B 66 (2) 174 (4) 68(4) 182 (12)
D5 143 (6) 2118 (64) 143 (6) 2243 (189)
D6 42 (9) 149 (34) 33 (0) 115 (0)
D7 91 (2) 1257 (50) 99 (10) 1417 (210)
and the species-specific properties were the observed distri- tions from 33 miRNAs using the inferred rules with an over-
bution), with three of these differences in the miRNA core lap of 100%. The larger number of interactions reported for
region (positions 2, 3 and 12). Also showing a significant the D5 (G. max) and D7 (T. aestivum) datasets when com-
difference were the MFE ratio distributions, evaluated using pared to D4 (A. trichopoda) and D6 (O. sativa) may have
the Kolmogorov–Smirnov test, which reported a P-value of arisen from number of repeat regions or duplicated tran-
0. Also, other non-model organisms showed significant dif- scripts present within the current genome annotation.
ferences within the miRNA core region, for example, A. tri- We then investigated the overlap between the miRNAs
chopoda flower (Supplementary Figure S4 and Supplemen- and their interactions for each set of criteria, presented in
tary Table S14) and O. sativa inflorescence (Supplementary Table 6, and concluded that, except for D6 (O. sativa), a
Figure S6 and Supplementary Table S16). Moreover, signif- higher number of miRNAs and their interactions were spe-
icant differences between the MFE ratio distributions are cific to the inferred criteria, highlighting yet again the dis-
observed in A. trichopoda flower (Supplementary Figure S4 tance from the Allen et al. criteria. For this analysis, we used
and Supplementary Table S14) and G. max leaves (Supple- the default retain rate of 0.85. To explore its effect on the
mentary Figure S5 and Supplementary Table S15). overlap between the Allen et al. criteria and the inferred cri-
teria, we repeated the analysis using a retain rate value of 1,
Employing data-driven targeting criteria on non-model or- to capture all PAREameters reported HC interactions. All
ganisms. To evaluate the differences in number and iden- of the captured interactions using the Allen et al. criteria
tity of predicted miRNA targets when using the Allen et al. were a subset of the interactions captured by the PAREame-
and PAREameters inferred criteria on the non-model or- ters inferred criteria when using a retain rate of 1 (Supple-
ganisms, we performed target prediction using PAREsnip2. mentary Table S18); the increase in miRNAs with targets
The inferred criteria were able to capture a larger number of varies between 4 (D6) and 102 (D7) and the increase in re-
interactions; the only exception was observed for the D6 (O. ported interactions varies between 12 (D6) and 783 (D7),
sativa) dataset for which 149 interactions from 42 miRNAs depending on the organism/dataset in question. These re-
were found using the Allen et al. criteria and 115 interac- sults further suggest that the Allen et al. criteria may have2268 Nucleic Acids Research, 2020, Vol. 48, No. 5
been too stringent, or inadequately calibrated for the spe- properties of genuine miRNA–mRNA interactions will be
cific organism or miRNAs in question. consistent between biological replicates. To investigate this,
we re-ran the analysis of the A. thaliana dataset D1 dataset,
allowing both HC and LC interactions to be reported, and
DISCUSSION
compared the results, across replicates, using the same sta-
In this paper, we describe PAREameters, a novel approach tistical evaluations, as described in the methods.
and tool that enables data-driven inference of plant miRNA The outcome of these analyses, presented in Supplemen-
targeting criteria. Through refining the targeting criteria, tary Figures S8 and S9, show a consistent decrease in the
the discovery and characterization of new miRNA–mRNA number of LC interactions reported compared to the num-
interactions per tissue or organism (both model and non- ber of HC interactions and a higher variability in distribu-
model) becomes possible. When evaluating the perfor- tions of properties, across replicates, for the LC interactions.
mance of the PAREameters inferred criteria, we observed This remark supports our previous observation that gen-
Downloaded from https://academic.oup.com/nar/article-abstract/48/5/2258/5707202 by guest on 16 March 2020
an increase in sensitivity compared to the Allen et al. crite- uine miRNA cleavage signals are likely to have the strongest
ria over all the A. thaliana datasets, whilst also maintaining signal (category 0 or 1) on transcripts. The consistency of
precision on most datasets, when benchmarked against a set the MFE ratio distributions and the position-specific prop-
of experimentally validated miRNA–mRNA interactions. erties of HC interactions between replicates is remarkable,
The comparison of validated miRNA–mRNA interac- with no significant differences in properties reported (Sup-
tion properties between conserved and species-specific miR- plementary Table S19), supporting our previous hypothesis
NAs in A. thaliana highlighted interesting and perhaps pre- that genuine miRNA cleavage sites are conserved between
viously unknown differences. When investigating the fea- biological replicates. Conversely, when comparing the prop-
tures of conserved miRNA interactions, we observed sim- erty distributions of LC interactions between replicates, we
ilar patterns to that of Allen et al. (8) regarding comple- observe a higher variation in the proportions of interactions
mentarity in the core region of the miRNA (2–13) and at with specific properties, with some positions having signif-
the canonical position 10. This observation is further sup- icant differences reported by the statistical tests (Supple-
ported by a recent study of highly conserved miRNAs in mentary Table S20). We speculate that the cause of these
N. benthamiana (19), where it was shown that a single mis- variations is due to the higher proportion of putative false
match at the 5 end of miR160 significantly diminished tar- positive predictions, i.e. the category 2 and 3 interactions
get site efficacy, and two or more consecutive mismatches comprise a combination of genuine target sites and random
at the 5 end fully abolished it. Furthermore, the authors degradation illustrated by the lower abundance of the tran-
highlighted that a single-nucleotide mismatch at positions script degradation signals.
9 and 10, in addition to combinations of mismatches at po- In this study, we also highlighted that targeting criteria
sitions 9, 10 and 11 led to the complete elimination of the re- inferred on non-model organisms or subsets of interactions
sponsiveness of miR164. However, the species-specific miR- are less compatible with current fixed criteria and often lead
NAs tended to tolerate more flexibility at these positions. to a decrease in sensitivity. Given the current, limited un-
These results motivated a similar analysis in non-model or- derstanding of the miRNA–mRNA interactions in various
ganisms and the results of which did mirror the trends ob- species, it is difficult to propose a biological interpretation
served in A. thaliana. However, it is important to emphasize of these variations, however, based on the side-by-side anal-
that these result from a series of predictions, and are sub- ysis of various datasets, we can conclude that a customized
ject to changes from additional, low throughput validations. selection of parameters may result in a higher precision out-
Nonetheless, this output highlights, yet again, the poten- put that could facilitate a more detailed overview of regu-
tial differences in the range of suitable thresholds used for latory interactions and an in-depth assessment of the un-
predicting targets for subsets of miRNAs and reiterate the derlying regulatory networks. Furthermore, the differences
remark that one set of fixed criteria for inferring miRNA– observed in the flower tissue between monocots and dicots
mRNA targets may not be sufficient. emphasize the usefulness of data-inferred, species and tissue
Throughout this study, we used exclusively the HC in- specific thresholds. We have demonstrated that PAREame-
teractions, reported by PAREameters, for all comparative ters is applicable for a wide variety of experimental designs
analysis. This is in part because the strongest degradation in both model and non-model organisms and could enable
signal on a transcript is likely a result of miRNA cleav- further understanding of the subtle variations in miRNA–
age and focusing on this subset of interactions increases mRNA interactions in different species, tissues and treat-
the confidence in the prediction results. However, it has ments. In addition, this novel data-driven approach may en-
been shown that weaker/lower abundance degradation sig- able new discoveries, i.e. regulatory sequences or modes of
nals may also be caused by miRNAs; these can be cap- action, within the RNA silencing pathways.
tured during target prediction, albeit with lower prediction
confidence. These lower abundance signals may be a result
of lower miRNA expression, reduced cleavage efficiency or
DATA AVAILABILITY
even sequencing bias (50). Indeed, it is also possible that
the degradation fragments may not be caused by miRNA PAREameters is available as part of the UEA sRNA
cleavage but instead are a result of noise or random degra- Workbench (33); it can be downloaded from http://srna-
dation of the transcript. It has been shown that real miRNA workbench.cmp.uea.ac.uk/. The source code has been re-
cleavage sites tend to be conserved across biological repli- leased on GitHub and is accessible at https://github.com/
cates and therefore, we further tested the hypothesis that the sRNAworkbenchuea/UEA sRNA Workbench/.Nucleic Acids Research, 2020, Vol. 48, No. 5 2269
SUPPLEMENTARY DATA 19. Liu,Q., Wang,F. and Axtell,M.J. (2014) Analysis of complementarity
requirements for plant microRNA targeting using a Nicotiana
Supplementary Data are available at NAR Online. benthamiana quantitative transient assay. Plant Cell, 26, 741–753.
20. Iwakawa,H.O. and Tomari,Y. (2013) Molecular insights into
microRNA-mediated translational repression in plants. Mol. Cell, 52,
ACKNOWLEDGMENTS 591–601.
21. Li,J., Reichel,M. and Millar,A.A. (2014) Determinants beyond both
We thank members of the Dalmay group for the challeng- complementarity and cleavage govern microR159 efficacy in
ing and pertinent discussions during the conception of this Arabidopsis. PLos Genet., 10, e1004232.
method. 22. German,M.A., Pillay,M., Jeong,D.H., Hetawal,A., Luo,S.,
Janardhanan,P., Kannan,V., Rymarquis,L.A., Nobuta,K.,
German,R. et al. (2008) Global identification of microRNA–target
FUNDING RNA pairs by parallel analysis of RNA ends. Nat. Biotechnol., 26,
941.
Biotechnology and Biological Sciences Research Council 23. Addo-Quaye,C., Miller,W. and Axtell,M.J. (2008) CleaveLand: a
Downloaded from https://academic.oup.com/nar/article-abstract/48/5/2258/5707202 by guest on 16 March 2020
[BBSRC BB/L021269/1 to V.M.; BB/M011216/1 to J.T.]. pipeline for using degradome data to find cleaved small RNA targets.
Funding for open access charge: UEA Article Processing Bioinformatics, 25, 130–131.
24. Folkes,L., Moxon,S., Woolfenden,H.C., Stocks,M.B., Szittya,G.,
Fund. Dalmay,T. and Moulton,V. (2012) PAREsnip: a tool for rapid
Conflict of interest statement. None declared. genome-wide discovery of small RNA/target interactions evidenced
through degradome sequencing. Nucleic Acids Res., 40, e103.
25. Kakrana,A., Hammond,R., Patel,P., Nakano,M. and Meyers,B.C.
REFERENCES (2014) sPARTA: a parallelized pipeline for integrated analysis of
1. May,P., Liao,W., Wu,Y., Shuai,B., McCombie,W.R., Zhang,M.Q. and plant miRNA and cleaved mRNA data sets, including new miRNA
Liu,Q.A. (2013) The effects of carbon dioxide and temperature on target-identification software. Nucleic Acids Res., 42, e139.
microRNA expression in Arabidopsis development. Nat. Commun., 26. Thody,J., Folkes,L., Medina-Calzada,Z., Xu,P., Dalmay,T. and
4, 2145. Moulton,V. (2018) PAREsnip2: a tool for high-throughput prediction
2. Fourounjian,P., Tang,J., Tanyolac,B., Feng,Y., Gelfand,B., of small RNA targets from degradome sequencing data using
Kakrana,A., Tu,M., Wakim,C., Meyers,B.C., Ma,J. et al. (2019) configurable targeting rules. Nucleic Acids Res., 46, 8730–8739.
Post-transcriptional adaptation of the aquatic plant Spirodela 27. Srivastava,P.K., Moturu,T.R., Pandey,P., Baldwin,I.T. and
polyrhiza under stress and hormonal stimuli. Plant J., 98, 1120–1133. Pandey,S.P. (2014) A comparison of performance of plant miRNA
3. Mallory,A.C. and Vaucheret,H. (2006) Functions of microRNAs and target prediction tools and the characterization of features for
related small RNAs in plants. Nat. Genet., 38, S31. genome-wide target prediction. BMC Genomics, 15, 348.
4. Brodersen,P. and Voinnet,O. (2009) Revisiting the principles of 28. Ding,J., Li,D., Ohler,U., Guan,J. and Zhou,S. (2012) Genome-wide
microRNA target recognition and mode of action. Nat. Rev. Mol. search for miRNA-target interactions in Arabidopsis thaliana with an
Cell Biol., 10, 141. integrated approach. BMC genomics, 13, S3.
5. Ambros,V., Bartel,B., Bartel,D.P., Burge,C.B., Carrington,J.C., 29. Huang,H.Y., Lin,Y.C.D., Li,J., Huang,K.Y., Shrestha,S., Hong,H.C.,
Chen,X., Dreyfuss,G., Eddy,S.R., Griffiths-Jones,S.A.M., Tang,Y, Chen,Y.G., Jin,C.N. and Yu,Y. (2019). miRTarBase 2020:
Marshall,M. et al. (2003) A uniform system for microRNA updates to the experimentally validated microRNA–target interaction
annotation. RNA, 9, 277–279. database. Nucleic Acids Res., 48, D148–D154.
6. Meyers,B.C., Axtell,M.J., Bartel,B., Bartel,D.P., Baulcombe,D., 30. Brousse,C., Liu,Q., Beauclair,L., Deremetz,A., Axtell,M.J. and
Bowman,J.L., Cao,X., Carrington,J.C., Chen,X., Green,P.J. et al. Bouché,N. (2014) A non-canonical plant microRNA target site.
(2008) Criteria for annotation of plant MicroRNAs. Plant Cell, 20, Nucleic Acids Res., 42, 5270–5279.
3186–3190. 31. Zheng,Y., Li,Y.F., Sunkar,R. and Zhang,W. (2011) SeqTar: an
7. Axtell,M.J. and Meyers,B.C. (2018) Revisiting criteria for plant effective method for identifying microRNA guided cleavage sites from
microRNA annotation in the era of big data. Plant Cell, 30, 272–284 degradome of polyadenylated transcripts in plants. Nucleic Acids
8. Allen,E., Xie,Z., Gustafson,A.M. and Carrington,J.C. (2005) Res., 40, e28.
microRNA-directed phasing during trans-acting siRNA biogenesis in 32. Kozomara,A., Birgaoanu,M. and Griffiths-Jones,S. (2018) miRBase:
plants. Cell, 121, 207–221. from microRNA sequences to function. Nucleic Acids Res., 47,
9. Zhang,Y. (2005) miRU: an automated plant miRNA target prediction D155–D162.
server. Nucleic Acids Res., 33, W701–W704. 33. Stocks,M.B., Mohorianu,I., Beckers,M., Paicu,C., Moxon,S.,
10. Dai,X. and Zhao,P.X. (2011) psRNATarget: a plant small RNA Thody,J., Dalmay,T. and Moulton,V. (2018) The UEA sRNA
target analysis server. Nucleic Acids Res., 39, W155–W159. Workbench (version 4.4): a comprehensive suite of tools for analyzing
11. Dai,X., Zhuang,Z. and Zhao,P.X. (2018) psRNATarget: a plant small miRNAs and sRNAs. Bioinformatics, 34, 3382–3384.
RNA target analysis server (2017 release). Nucleic Acids Res., 46, 34. An,J., Lai,J., Sajjanhar,A., Lehman,M.L. and Nelson,C.C. (2014)
W49–W54. miRPlant: an integrated tool for identification of plant miRNA from
12. Gruber,A.R., Lorenz,R., Bernhart,S.H., Neuböck,R. and RNA sequencing data. BMC Bioinformatics, 15, 275.
Hofacker,I.L. (2008) The vienna RNA websuite. Nucleic Acids Res., 35. Paicu,C., Mohorianu,I., Stocks,M., Xu,P., Coince,A., Billmeier,M.,
36, W70–W74. Dalmay,T., Moulton,V. and Moxon,S. (2017) miRCat2: accurate
13. Axtell,M.J. (2013) Classification and comparison of small RNAs prediction of plant and animal microRNAs from next-generation
from plants. Annu. Rev. Plant Biol., 64, 137–159. sequencing datasets. Bioinformatics, 33, 2446–2454.
14. Bonnet,E., He,Y., Billiau,K. and Van de Peer,Y. (2010) TAPIR, a web 36. Mohorianu,I., Stocks,M.B., Wood,J., Dalmay,T. and Moulton,V.
server for the prediction of plant microRNA targets, including target (2013) CoLIde: a bioinformatics tool for CO-expression based small
mimics. Bioinformatics, 26, 1566–1568. RNA Loci Identification using high-throughput sequencing data.
15. Pearson,W. (2003) Finding protein and nucleotide similarities with RNA Biol., 10, 1221–1230.
FASTA. Curr. Protoc. Bioinform., 4, 3–9. 37. Thatcher,S.R., Burd,S., Wright,C., Lers,A. and Green,P.J. (2015)
16. Krüger,J. and Rehmsmeier,M. (2006) RNAhybrid: microRNA target Differential expression of miRNAs and their target genes in senescing
prediction easy, fast and flexible. Nucleic Acids Res., 34, W451–W454. leaves and siliques: insights from deep sequencing of small RNAs and
17. Fahlgren,N. and Carrington,J.C. (2010) miRNA target prediction in cleaved target RNAs. Plant Cell Environ., 38, 188–200.
plants. In: de Folter,S (ed). Plant MicroRNAs:Methods and Protocols. 38. Gyula,P., Baksa,I., Tóth,T., Mohorianu,I., Dalmay,T. and Szittya,G.
Vol. 592, pp. 51–57. (2018) Ambient temperature regulates the expression of a small set of
18. Ivashuta,S., Banks,I.R., Wiggins,B.E., Zhang,Y., Ziegler,T.E., sRNAs influencing plant development through NF-YA2 and YUC2.
Roberts,J.K. and Heck,G.R. (2011) Regulation of gene expression in Plant Cell Environ., 41, 2404–2417.
plants through miRNA inactivation. PLoS One, 6, e21330.You can also read