A First Look into the Structural Properties and Resilience of Blockchain Overlays - Incognito
←
→
Page content transcription
If your browser does not render page correctly, please read the page content below
A First Look into the Structural Properties and Resilience of
Blockchain Overlays

Blockchain (BC) systems are highly distributed peer-to-peer networks that offer an alternative to centralized
services and promise robustness to coordinated attacks. However, the resilience and overall security of a BC
system rests heavily on the structural properties of its underlying peer-to-peer overlay. Despite their success,
BC overlay networks’ critical design aspects, connectivity properties and network-layer inter-dependencies
are still poorly understood.
 In this work, we set out to fill this gap and study the most important overlay network structural properties
and robustness to targeted attacks of seven distinct BC networks. In particular, we probe and crawl these BC
networks every two hours to gather information about all their available peers, over a duration of 28 days.
We analyze 335 network snapshots per BC network, for a total of 2345 snapshots. We construct, at frequent
intervals, connectivity graphs for each BC network, consisting of all potential connections between peers.
 We analyze the structural graph properties of these networks and compare them across the seven BC
networks. We also study how these properties associate with the resilience of each network to partitioning
attacks, i.e., when peers are selected, attacked and taken offline, using different selection strategies driven by
the aforementioned structural properties. In fact, we show that by targeting fewer than 10 highly-connected
peers, major BCs such as Bitcoin can be partitioned into disjoint, i.e., disconnected, components. Finally, we
uncover a hidden interconnection between different BC networks, where certain peers participate in more
than one BC network, which has serious implications for the robustness of the overall BC network ecosystem.

1 INTRODUCTION
The widespread adoption of Bitcoin helped the further development of numerous cryptocurrencies
and distributed ledger platforms, also known as blockchains (BC). In fact, the unique features of BC’s
have increased this technology’s visibility and are expected to bring disruptive innovation to many
sectors that traditionally rely on centralized, trusted third-parties. This, in turn, raises the question
of whether their transport layer infrastructure ensures sufficient resilience and performance.
 BCs use structured or unstructured peer-to-peer (P2P) networks that employ stateful connections.
Such P2P overlays are easily constructed, enable fast distribution of information, and exhibit
highly dynamic network topologies. BC-based applications are highly depended on these overlay
networks. The overlay network’s properties define the level of security, scalability, and resilience
of the BCs. It is therefore important to analyze these networks to unveil possible limitations and
vulnerabilities. Unfortunately, BC networks are not sufficiently documented by the various BC
development teams. Though previously suggested methods had substantial accuracy in topology
inference [15, 24, 38, 41, 43], they were usually accompanied by ethical issues since they involved
fabrication of double-spending, or otherwise fake transactions that could influence a BC network
and have a negative impact on real users’ transactions. In addition, frequent changes in the code-
base of BC reference clients render past methods for inferring BC network topologies impractical.
Similarly, works that rely on simulators [42, 44] are also affected by code-base changes, since the
simulation parameters are often tied to the specific implementation.
 In summary, prior work focusing on the specific subject of topology inference has the following
drawbacks: a) they largely rely on undocumented subtleties of the reference client; b) they require
the monitoring node to be highly connected in the network; c) the monitoring entity has to bear
the induced costs of fabricated transactions; d) the current state of BC networks may have changed
significantly since a study was done1 ; e) they have not studied in-depth the structural properties
1 e.g., number of reported reachable Bitcoin peers has increased roughly by 70% from 2016 to 2020 [6, 18]

Author’s address:

 , Vol. 1, No. 1, Article . Publication date: February 2021.
2

of BC network layers. Therefore, we identify a first urgent need to study BC networks’ structural
properties due to their impact on the viability of their BC applications, but this study must be done
in a practical, ethically correct, and accurate fashion.
 Indeed, the ability to infer the connectivity between BC nodes with sufficient accuracy is required
to analyze a network’s properties. Yet, due to security concerns, BC networks are built in a way
that hides their topology. In fact, knowledge of the topology can enable deanonymization of user
transactions, node eclipsing attacks [26, 34], network partition attacks, and create distrust in the
system. Past work on BC attacks assessed the vulnerabilities stemming from BC nodes being
colocated in just a few Autonomous Systems (AS) or Internet Service Providers (ISP) [2, 47]. This
spatial concentration of nodes within an AS or an ISP makes them vulnerable to routing attacks
such as BGP hijacking. Such attacks target specific nodes in order to cause significant delays or
partition them from the rest of the network.
 These attacks have gained attention and are quite practical, since they do not depend on the BC
topology. Nevertheless, the success of such attacks requires a powerful adversary, with sufficient
hashpower, or the ability to control an AS or ISP. Thus, we identify a second urgent need, i.e., the
systematic study of BC overlay networks’ topological robustness. Such study involves identifying
several critical BC nodes whose removal can cause major disruption. Using partial knowledge of
the topology and its structural weak points, an informed adversary may be able to disrupt the BC
networks’ operation at a relatively low cost.
 Motivated by these two urgent needs outlined earlier, our present study focuses on the following
three main Research Question (RQ) clusters:
RQ1: What are the structural and network characteristics of BC overlay networks? Are all BC
 networks structured similarly? Do they exhibit properties similar to well-known networks?
RQ2: Are there network entities (peers, links) that participate in more than one network, concur-
 rently? What are their properties in comparison to entities appearing in only one network?
RQ3: What are the implications of networks’ properties with respect to resilience against targeted
 attacks? How do concurrent network entities affect network resilience to such attacks?
 With this work, we make the following contributions:
 • We propose an alternative method for studying the topology of BC networks. Our imple-
 mentation does not require high connectivity in each network and is free of transaction
 processing costs, allowing for greater scalability. Similar to [38], our work does not interfere
 with transactions and only uses information made available by the network peers.
 • We use our methodology to measure and analyze the network characteristics of seven different
 BC overlay networks for a period of 4 weeks.
 • Our results show that the studied BC networks are not structured in the same way and are
 highly dynamic in nature. They belong to the general exponential family of graphs, but do
 not relate considerably to well-known networks like the Internet topology, the Web or social
 networks and don’t resemble random networks either.
 • Our results also indicate a significant amount of nodes participating in more than one BC, at
 the same time. We refer to them as overlapping nodes, and show that their presence is high,
 consistently through time and across major BC. Overlapping nodes constitute 10-40% of any
 BC network, forming a potential vulnerability in the BC ecosystem, as attackers could focus
 their effort on the overlapping nodes to disrupt multiple networks simultaneously.
 • We also investigate the topology robustness of each BC network. We find that by removing
 just the 5 top central nodes, we get a significant shrinking of the largest connected component
 in major BCs, suggesting that network partitions can be easily performed by a motivated
 adversary. We also observe a noticeable increase of the network diameter and dramatic

, Vol. 1, No. 1, Article . Publication date: February 2021.
A First Look into the Structural Properties and Resilience of Blockchain Overlays 3

 decrease in largest connected component’s size when removing less than 10% of peers.
 Therefore, a powerful DDoS attack, targeting a few hundred nodes, can lead to the collapse
 of major BC networks.

2 BACKGROUND ON BLOCKCHAIN NETWORKS
This section introduces the seven BC networks considered in our study (Sec. 2.1). It also provides
background information on how the two most prominent Blockchain overlay networks are formed
(Bitcoin, Sec. 2.2 and Ethereum, Sec. 2.3).

2.1 Studied Networks
We chose seven BC networks for our study. All are consistently included in the top 50 cryptocur-
rencies by market capitalization, according to [9] for the past year. We list them alphabetically:
 (1) Bitcoin [40] was the first cryptographic currency to gain widespread adoption.
 (2) Bitcoin Cash [5, 49] is a hard fork of Bitcoin with an increased block size, aiming at increasing
 transaction throughput and reducing clearance delays in comparison to Bitcoin.
 (3) Dash [20] is another fork of Bitcoin. It employs a two-tiered network, consisting of mining
 nodes and master nodes (peers or nodes are used interchangeably in the rest of the paper).
 This architecture enables very fast transaction confirmation times.
 (4) Dogecoin [36, 56] is a fork of Litecoin (see below), that yields faster (only one minute) block
 generation times. Although it initially started as a joke to satirize the hype surrounding
 cryptocurrencies, it has gained visibility and high market capitalization [46].
 (5) Ethereum [7] is tailored to executing smart contracts for decentralized applications. It
 is the most well known cryptocurrency after Bitcoin and has the second highest market
 capitalization. The main difference with Bitcoin, and its most prominent feature, is the use of
 a Turing-complete programming language that allows the creation of smart contracts.
 (6) Litecoin [32] is one of Bitcoin’s first forks. Its differentiating functions include a decreased
 block generation time of 2.5 minutes and use of a distinct hashing algorithm, Scrypt [45].
 (7) Zcash [27] is a cryptocurrency focused on user privacy and anonymity based on zero
 knowledge proofs for transaction processing.
 With the exception of Ethereum, the aforementioned BCs are descendants of Bitcoin using very
similar overlay implementations. Next, we explain the fundamentals of the overlay network of
Bitcoin and Ethereum.

2.2 Bitcoin Overlay Network
In the Bitcoin overlay network, nodes communicate through non-TLS TCP connections to form an
unstructured P2P network. Bitcoin’s security heavily depends on the global consistent state of the
BC, which relies on its Proof-of-Work based consensus protocol. The communication protocol is
largely undocumented, so we look into previous studies and the Bitcoin Core reference client for
its specifications. Next, we describe how the Bitcoin network is formed.
 When a node joins the network for the first time, it queries a set of DNS seeds that are hardcoded
in the reference client (Bitcoin Core). The response to this lookup query includes one or more IP
addresses of full nodes that can accept new incoming connections. Once connected to the network,
a node receives unsolicited addr messages from its connected peers, that contain IP addresses and
port numbers of other peers in the network. Additionally, the client can send to peers getaddr
messages to gather additional peers. The transmitting node can use those IP addresses to quickly
update its database of available nodes rather than waiting for new unsolicited addr messages. The
reply to a getaddr message has limited entries and may contain up to a 1000 peer addresses. All

 , Vol. 1, No. 1, Article . Publication date: February 2021.
4

known addresses are maintained in an in-memory data structure, and are periodically dumped
to disk, in the peers.dat file. Bitcoin Core keeps a record of known peers in a persistent on-disk
database which allows it to connect directly to those peers on subsequent startups without having
to use DNS seeds.
Bitcoin peer address management. For each address in the local database, the client, through
the address manager (ADDRMAN), maintains the peer’s IP address, port number, last time seen and
timestamp of the last connection. If a peer is unreachable, this is marked by the address manager. If
multiple attempts to the same peer are unfruitful, the peer is marked as terrible [11] and is not tried
again. Furthermore, if a peer misbehaves, e.g., by sending invalid blocks, it is also marked as terrible.
Terrible peers are not included in addr messages. In order to help neighbor selection, all peers are
added into buckets. There are two types of buckets: for tried and new addresses. Peers to which
a client had at least one inbound or outbound connection in the past are sorted in tried buckets.
Peers that are known to a client, but either: a) no connection between them has ever existed, or b)
were evicted from a tried bucket, are sorted in new buckets. There are 256 tried buckets and 1024
new buckets. The maximum capacity of each bucket is 64, limiting the total number of peers in the
database to 81920.
Topology Inference Risks. To hinder attacks that utilize topology inference, Bitcoin Core devel-
opers implemented a series of changes in the network protocol. To address the adversarial methods
proposed by Miller et al. [38], nodes stopped updating the timestamp field in the address manager,
making it impossible to infer most recent, i.e., active connections. Delgado-Segura et al. [15] used
transaction relay information to infer topology, so the reference client now makes two additional
outbound connections that are only used for block relay. This is because inferring network con-
nectivity from the relay of blocks, or block headers, is much more expensive for an adversary. To
shield the protocol from node eclipsing attacks, unsolicited ADDR messages from incoming peers
are now ignored and are not added to the peer’s database, nor relayed to other peers. To further
reduce the efficacy and impact of eclipsing, peers are selected in a random fashion and updated in
fixed time intervals.

2.3 Ethereum Overlay network
Peer protocols. Ethereum’s network communication comprises three distinct protocols. RLPx
serves as a transport protocol and is used for node discovery and establishment of secure commu-
nication. DEVP2P is used to create the application session. Last, the Ethereum application-level
protocol (eth sub-protocol) facilitates the exchange of BC information between peers, like transac-
tions and blocks. DEVP2P is not meant to be specific to Ethereum; other BC or network applications
can be built on it. It supports discovery of other participants and secure communication among
them, on top of the RLPx transport protocol. All protocols are documented in Ethereum’s official
documentation [19].
Node Discovery. Ethereum’s node discovery takes place over UDP, while the rest of communication
is done through TCP TLS channels. RLPx implements node discovery based on the routing algorithm
of Kademlia, a distributed hash table (DHT) [37]. In Ethereum, each peer has a unique 512-bit
node ID. A bitwise XOR is used to compute a distance between two Node IDs. Nodes maintain 256
buckets, each containing a number of entries. Each node assigns known peers to a bucket, according
to the XOR distance from itself. In order for a new node to find peers, it first adds a hard-coded set
of bootstrap node IDs to its routing table. It then sends to these bootstraping nodes a FIND_NODE
message that specifies a random target node ID. Each peer responds with a list of 16 nodes from its

, Vol. 1, No. 1, Article . Publication date: February 2021.
A First Look into the Structural Properties and Resilience of Blockchain Overlays 5

own routing table that are closest to the requested target. Subsequently, the node tries to establish
a number of connections (typically between 25 and 50) to other peers in the network.
 After the peer nodes have discovered other peers through RLPx and a secure TCP connection is
established, they use the DEVP2P protocol for communication. Upon exchange of HELLO messages,
nodes may use any of the application layers’ sub-protocols to communicate. Peers in the Ethereum
chain use the eth63/64/65 protocol for exchange of blockchain data after an initial handshake.
Ethereum’s Node Discovery protocol specification does not allow for repeated discovery messages
from the same peer. The Ethereum client implementations impose a 4 second delay between
successive FIND_NODE messages from the same node.

3 RELATED WORK
BC Topology Inference. Miller et al. [38] were the first to attempt to infer Bitcoin’s public network
topology. They discovered links between nodes by leveraging the timestamps included in ADDR
messages. Before this work, peers responded to GETADDR messages, including a timestamp for each
IP address. The timestamp’s role was to ensure that terminated nodes were not propagated in the
network anymore. The nodes regularly refreshed timestamps. Thus, by issuing GETADDR messages
to all reachable nodes in the network and analyzing the timestamps, Miller et al.managed to obtain
a map of connections. In their work, as in ours, they also find indications that the Bitcoin network
is not purely random.
 Grundmann et al. [24] explored two mechanisms for Bitcoin topology inference. Their first
approach exploits the accumulation of multiple transactions before their announcement to other
peers but results in a low inference quality. Their second approach exploits the fact that clients drop
double–spending transactions. Using this information, they accurately infer a peer’s connections.
However, this method was not intended to perform full network topology inference due to high
cost: with current transaction fees, inferring the connections of a single peer would cost around
$78 [21]. Both methods of [24] require maintaining connections to all reachable peers and crafting
distinguishable transactions, one for each reachable peer. Due to ethical reasons, their validation
was performed against Bitcoin’s testnet.
 Delgado-Segura et al. [15] devised a different method to infer Bitcoin’s network topology, using
orphaned transactions. Their method relies on subtleties of Bitcoin’s transaction propagation
behavior. It involves fabricating double–spending transaction pairs and sending them to a part
of the network. Since their method could interfere with ordinary transactions, they have only
performed measurements in Bitcoin’s testnet. Their results also indicate that Bitcoin’s testnet does
not resemble a random graph. Using this method with current Bitcoin prices and 11,000 reachable
bitcoin nodes would require more than $5,700 in transaction fees and more than 12 hours to cover
the whole network [21].
 Neudecker et al. [43] performed a timing analysis of the propagation of transactions to infer the
network topology. In contrast to Miller et al., Neudecker et al. use transaction propagation delays,
as observed by a highly connected monitor, to infer topology. By observing timestamps of reception
of certain transactions and utilizing a propagation delay model, they infer the path of transaction
and, thereby, connections between peers. This approach requires the monitoring node to actively
create transactions if it cannot determine the transaction originator. Furthermore, changes made to
the propagation mechanism of Bitcoin Core reference client render this method impractical.
 By exploiting block relay mechanisms, Daniel et al. [13] presented a passive method to infer
connections of mining nodes and their direct neighbors in the ZCash network. Biryukov et al. [4]
focused on deanonymizing Bitcoin users by suggesting a method for topology discovery by sending
fake marker IP addresses to remote peers. Neudecker and Hartenstein [44] surveyed the network

 , Vol. 1, No. 1, Article . Publication date: February 2021.
6

layer of permissionless BCs, simulated a passive method to infer the network topology with
substantial accuracy, and emphasized how network topology hiding is an intermediate security
requirement. Decker et al. [14] measured the rate of information propagation through-out the
network and showed, among other findings, that delays in block propagation are highly correlated
to chain forks. Finally, work from Dotan et al. [17] presents a structured overview of BC P2P overlay
networks. Their work highlights differences and commonalities with traditional networks and
identifies open research challenges in network design for decentralized distributed systems.
Node Eclipsing and Partitioning Attacks. Heilman and Kendler presented an eclipse attack on
Bitcoin’s P2P network [26]. They demonstrate how an adversary controlling a large number of IP
addresses can monopolize all connections to and from a victim node and exploit it to mount attacks
on Bitcoin’s mining and consensus. A similar attack has been demonstrated by Marcus et al. [35].
It is applicable to the Ethereum BC, and was further optimized in [34]. Saad et al. [47, 48] explore
various partitioning attacks of the Bitcoin network. Neudecker [42] also explores the feasibility
of partitioning attacks through a simulated analysis. Partitioning of the Bitcoin network through
BGP hijacks was studied by Apostolaki et al. [2]. Such works rely on the spatial concentration of
nodes within an AS or an ISP, which makes them vulnerable to routing attacks. More recently,
Tran et al. [51] proposed a stealthier version of a partitioning attack.
Summary. Despite previous efforts, very little is known regarding the structure and topological
properties of BC overlay networks. Instead, past studies focused on methods for inferring the
well–hidden topology of Bitcoin, either against the whole network or a specific peer. With the
exception of [38], these studies were validated against the Bitcoin testnet [15], or against selected
nodes [24, 43].
 Topology inference in BC networks remains an unsolved problem. Most suggested methods are
either not applicable anymore due to changes in the reference clients, infeasible due to transaction
fees, or impractical to run against multiple BC networks since they require maintaining connections
to a high number of peers. Furthermore, Bitcoin core developers are constantly updating protocol
subtleties to prevent any leakage of information that would ease topology inference in any way.
Contributions. To the best of our knowledge, this is the first study that focuses on various BC
networks’ structural properties. As we show in Sec. 4.2, we circumvent the challenges of topology
inference and build a simple network monitor that can probe seven different BC networks in parallel.
We are the first to study these networks in–depth for their network characteristics and properties.
Furthermore, we investigate the resilience of these networks against random and targeted attacks.

4 METHODOLOGY
In this section, we explain the methodology used for crawling the aforementioned BC networks
(Sec. 4.1), how we assessed efficacy of our methodology (Sec. 4.2), and the final datasets collected
and experimental setup used (Sec. 4.3).

4.1 Crawling Process
To discover the nodes of the overlay networks, we modified the crawler maintained by the popular
site Bitnodes.io [6] to meet our needs [55]. The required changes included featutes that enable:
a) crawling multiple chains using distinct processes; b) storing the mapping of each node to its
known-peers; c) and synchronizing the processes to dump the collected data for each BC at the
same timestamp. For Ethereum, which uses a completely different communication protocol, we
built our crawler around the open source Trinity client [52]. Our main goal is to scrape the contents
of any reachable node’s ADDRMAN for its outgoing connections, and to build a connectivity graph of
any possible connections that could be realized in the overlay network.

, Vol. 1, No. 1, Article . Publication date: February 2021.
A First Look into the Structural Properties and Resilience of Blockchain Overlays 7

 Each BC to be crawled is assigned to a process that creates hundreds of user-level threads.
Intermediate data collected during crawling are maintained in an in-memory key-value store, each
process having its own instance. Following the communication protocols described in Sections 2.2
and 2.3, each process connects to its assigned BC network and recursively asks each discovered
node for its known peers. Each new discovered node is stored in a pending set of the in-memory
instance. The threads constantly poll their pending set for a new node, initiate a connection and
retrieve the list of the node’s known peers.
 Upon a successful connection to a peer, its entry is moved from pending to the tried set.
Additional data for the peer are collected through the protocol’s VERSION message, including
provided services, the peer’s latest block height, the client’s software version, and the peer’s P2P
protocol version. If a node fails to reply or the connection times out, it is moved into the failed
set. On each received reply to a GETADDR message, the program makes an entry, mapping the
originating node ( ) to the peer list it knows of: → { 0, 1, ..., }, where 0− are the peers
included in ’s reply. This entry is stored in the edges set.
 When the pending set becomes empty, the crawler moves all entries from tried to the pending,
and starts over. The edges set remains intact and is updated in subsequent rounds. Replies from
nodes that are already mapped in the edge set, are appended to the respective entry. After a
period of approximately two hours, all processes synchronize and dump their edge set to storage.
Subsequently, after the dump, all sets are emptied and each process restarts and repeats the same
procedure. Note that in our implementation, we do not accept incoming connections and we probe
only IPv4 peers. Because Bitcoin descendant BC networks share their communication protocol
semantics with Bitcoin, only a few constant parameters have to be changed in order to be compatible
with our implementation.
Note: The latest version of Bitcoin Core includes changes that affect the proposed approach. The
latest version employs cached responses to GETADDR requests. For a period of 24 hours, all GETADDR
requests from any peer are served by a fixed ADDR reply containing up to 1000 peers. This further
impedes the collection of the contents of ADDRMAN [12]. Inspecting our collected data, we found
that replies from the same peer vary significantly, with a Jaccard similarity ∼0.1 of consecutive
replies. An aggregated count of a node’s neighbors indicates that up to 15% of its peers are more
frequently relayed. As our extended analysis on collected snapshots revealed (see Fig. 2), the vast
majority of collected nodes are unreachable. Since we rely on reachable nodes to collect data, we
would expect a reduction in both the size and density of the synthesized graphs, narrowing the
view extracted by the proposed methods. Nevertheless, the basic aspects of our approach remain
valid and we believe its complete efficacy can be restored with further modifications to the crawler.
 Implementing an Ethereum crawler is substantially different. We fork a full client that disables
all BC-related processing. We only implement those parts of the protocols necessary to instantiate
connections to Ethereum peers and take part in the discovery process. Since a discovery message in
Ethereum provides us with up to 16 addresses, we repeat the discovery process for each discovered
peer after a 5 second interval, each time generating a new random target (see Sec. 2.3 for details). We
note that it is more time-consuming to scrape the DHT contents of each Ethereum peer compared
with other BCs.

4.2 Methodology Assessment
We evaluate the efficacy of our method as follows. We setup an unmodified Bitcoin reference
node using the official Bitcoin core implementation[10]. After the initial deployment, we allowed
the reference node to perform its initial bootstrap of the BC for one week. Subsequently, every
ten minutes we retrieve the following information from the reference node: a) all inbound and

 , Vol. 1, No. 1, Article . Publication date: February 2021.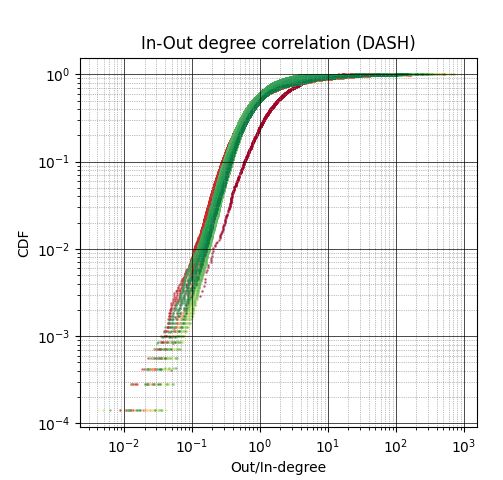
8

outbound connections, b) a copy of the peers.dat file, containing all known peers, and c) the ADDR
reply to a GETADDR probing message. Looking into the collected data, we found:
 • After more than one week of operation, the peers.dat file of the reference client contained
 41k IP addresses.
 • Some peers are more frequently included in ADDR replies than others. By sending 20 GETADDR
 messages, we were able to retrieve 17k unique peers, instead of the expected 20k (1k per
 message), meaning that a group of nodes appears more frequently than others.
 • The number of outgoing connections of the reference client was between 8 and 12. Despite
 their small number, the IP addresses of most outgoing connections were included in the
 node’s replies.
Imtiaz et al. [28] studied churn in the Bitcoin network and showed that the majority of peers stays
online for less than a day, and more than 95% of nodes stay online for less than a week. Accordingly,
in Figure 1, we plot the true positives (recall) of outgoing connections being included in an ADDR
reply for four consecutive days. On average, the recall is higher that 0.8. We note that for this
calculation, we filter out transient connections, i.e., connections that last for less than 2 hours.
From the above, we conclude that our earlier proposed method can repeatedly retrieve a good
representation of a node’s outbound connections. The resulting graphs, synthesized by the edge
sets collected, contain the outbound connections of each node with high probability and may be
considered as graphs of the overlay network topology. The actual true connections of active nodes
would then be spanning sub-graphs of the synthesized graphs, containing all vertices but less edges.

 Fig. 1. Recall of discovered outbound connections of the reference node.

4.3 Datasets & Experimental Setup
We crawled the selected BC networks from the datacenter of a European University. The monitoring
server has an 8-core/3.2GHz CPU, 64GB RAM, and 2.1TB of HDD storage. The crawling operations
were done for a period of about one month (26/06-22/07/2020). At the end of the crawling period,
we had collected 335 network snapshots for each BC network, or 2345 graphs in total. We denote
as the set of BC networks ( ∈ ) that are crawled:
 = { , ℎ, ℎ, , ℎ , , ℎ}
At the end of every two-hour period, we have seven different edges sets, one per BC in . All such
edge sets are annotated with the timestamp of their crawl. Each set of edges corresponds to a
graph, denoted as , representing a snapshot of BC network , at timestamp . We construct the
graphs using the edge sets collected, as follows. For each entry → { 0, 1, ..., } in the set,
we create a directional graph with nodes { , 0, 1, ..., } and add outgoing edges from to

, Vol. 1, No. 1, Article . Publication date: February 2021.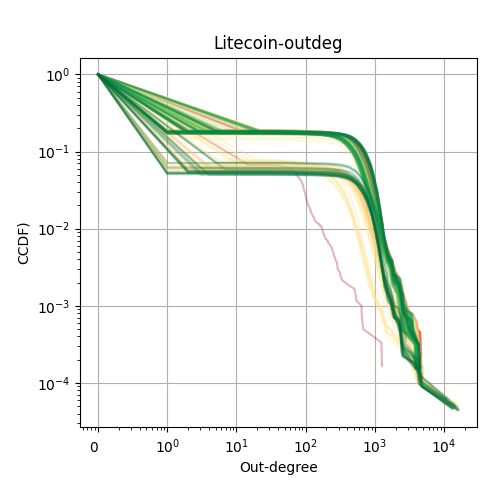
A First Look into the Structural Properties and Resilience of Blockchain Overlays 9

nodes 0, 1, . . . , . We synthesized and analyzed these graphs using the SNAP library [31] and
the NetworkX package for network analysis [25].
Summary. In this section, we introduced the methods used to crawl the BC network and to
synthesize the collected data into a series of graph snapshots. As described in Section 3, previous
methods are either no longer applicable, too costly to perform, or require high connectivity within a
network. To be able to explore various networks concurrently, we chose a simpler crawling method
that does not require strong presence in a network and does not induce high transaction processing
costs. In fact, we performed measurements on seven distinct BC networks from a single server. Our
method produces acceptable representations of the real BC overlays. However, we acknowledge
that our work will be impeded by changes introduced in the latest Bitcoin Core reference client.

5 RESULTS
In this section, we present the analysis of the collected data per BC network. We begin by analyzing
the network properties of the derived graphs and their topological resilience (Sec. 5.1). Furthermore,
we investigate whether BC network nodes participate in more than one network simultaneously,
and their properties (Sec. 5.2). We study the BC networks’ resilience to targeted attacks on specific
nodes (Sec. 5.3). Finally, we summarize our findings in Sec. 5.4.

Table 1. Basic network graph metrics per BC network. ConnCmpSz: Size of largest connected component (%
of total graph); SConCmpSz: Size of largest strongest connected component (% of total graph).

 Network: Bitcoin Bitcoin Dash Dogecoin Ethereum Litecoin Zcash
 Cash
 Nodes 50016 23013 8485 1214 11887 8205 1457
 Edges 4793847 169020 7312276 116376 59297 741502 106890
 ConnCmpSz 0.99 0.99 1 1 0;99 1 1
 SConCmpSz 0.11 0.04 0.82 0.27 0.04 0.16 0.16
 Diameter 4 4 4 3 6 4 4
 Density 0.0019 0.0003 0.1035 0.0805 0.0006 0.0112 0.0617
 Avg. Degree 92.8 7.12 802.12 74.97 4.3 104.04 56.96
 Assortativity -0.2 -0.64 -0.06 -0.13 -0.02 -0.01 -0.22
 Reciprocity -0.06 0.05 0.16 0.34 0 0.09 0.47
 Clustering 0.0489 0.011 0.166 0.28685 0.0022 0.07345 0.30939
 Av. Shortest Path 2.55 2.82 1.93 1.77 3.78 1.96 1.72

5.1 Networks Structure
This section is driven by Research Question 1. In particular, we are interested in answering the
following questions: a) What are the structural properties and network characteristics of BC overlay
networks? b) Are they all structured in a similar manner? c) Do they share common properties? d)
Do they have properties that relate to other well-known networks such as the Internet topology,
the Web, and social networks, or do they resemble random networks?
Basic network properties. The basic properties of the derived graphs are summarized in Table 1.
The metrics were computed individually on each graph and were then averaged.
 All networks appear to be well–connected given the size of their largest connected component
and low diameters. Most networks have a diameter equal to 4. Exceptions are Ethereum having a
diameter of 6 and Dogecoin having the smallest diameter equal to 3. Bitcoin is the largest network

 , Vol. 1, No. 1, Article . Publication date: February 2021.
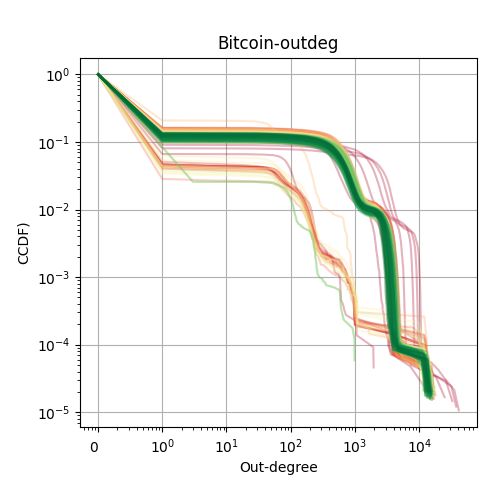
10

with more than 50K nodes. Bitcoin Cash and Ethereum follow, having sizes of 23K and 12K nodes,
respectively. Dash and Litecoin have similar sizes, close to 8K nodes. The two smallest networks
are Zcash and Dogecoin with less than 1.5K nodes.
 Moreover, we observe that Dash is markedly the most dense network and is almost fully connected.
It has a strongly connected component2 comprising 82% of the total network nodes. The large BC
networks have a smaller strongly connected component compared to the smaller ones. Table 1
reports the average values of all snapshots. Values extracted from our datasets match reported
values in related measurement works [13, 16, 29]. Indicatively, on each day, our monitoring node
was able to discover 120081 nodes in Bitcoin, 19543 in Ethereum, and 4132 in Zcash (reporting
median values). On average, the monitoring node performed more than 1.3 requests per day,
covering all BC networks.
Degree Distributions. The degree (number of links with other nodes) distribution affects many
network phenomena, like network robustness and efficiency in information dissemination [3]. In
addition, random networks have binomial degree distributions, while in real systems we usually
encounter highly connected nodes that the random network model can not account for. In Figure 2,
we plot the complementary cumulative distribution (CCDF) of the out-degree of all collected
snapshots for all BC networks studied.
 We color the snapshots according to their timestamp. Our first observation is that networks
such as Bitcoin and Ethereum manifest considerable variability in degree distribution between
snapshots. On the contrary, degree distributions in Dash and Dogecoin have less variability (seen
by the distance between snapshots). Another interesting observation is that in most BC networks,
we have a high fraction of unreachable nodes, either because they are offline or behind NATs.
This observation confirms the findings of Wang and Pustogarov [54] who studied the prevalence
and deanonymization of unreachable peers. Our results also suggest that these BC network have
heavy-tailed degree distributions. We further discuss their best distribution fit and their scale–
free property in a following paragraph. Finally, we observe significant deviations from the BC
protocols. In Bitcoin for instance, one would expect that reachable nodes would have at least 1K
out-degree, since Bitcoin clients with the default parameters are set to respond with 1K known
peers. Conversely, we observe a number of nodes with out-degree less than 100.
Degree Assortativity. In general, a network displays degree correlations if the number of links
between the high and low-degree nodes is systematically different from what is expected by chance.
In some types of networks, high-degree nodes (or hubs) tend to link to other such hubs, while in
other types, hubs tend to link to low-degree nodes, i.e., what is known as a hub-and-spoke pattern.
Assortativity, or assortative mixing is a preference for nodes in a network to attach to others that
are similar in some property; usually a node’s degree.
 The assortativity coefficient, , is the Pearson correlation coefficient of degree between pairs of
linked nodes, and lies in the range −1 ≤ ≤ 1. A network is said to be assortative ( tends to 1)
when high-degree nodes tend to link to each other and avoid linking to small-degree nodes, while
low-degree nodes tend to connect to other low-degree nodes. A network is said to be disassortative
( tends to -1) when the opposite happens. A random network has close to zero and can be
characterized as neutral. The addition of this characteristic to network models approximates better
the behaviors of many real world networks.
 Correlations between nodes of similar degree are often found in the mixing patterns of many
observable networks. For instance, social networks tend to be assortative, while technological and
biological networks typically show disassortative mixing, as high-degree nodes tend to attach to
2 Thestrongly Connected Component of a directed graph is a subgraph in which every vertex is reachable from every
other vertex.

, Vol. 1, No. 1, Article . Publication date: February 2021.
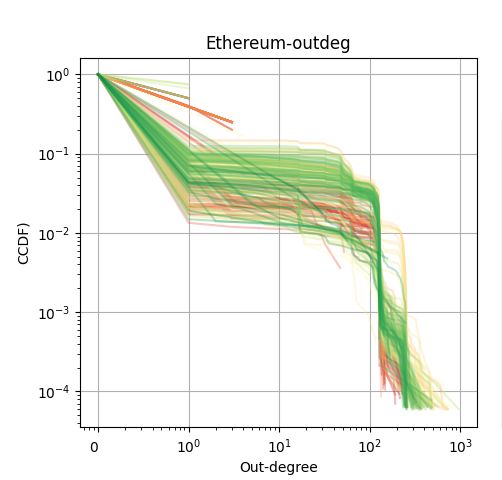
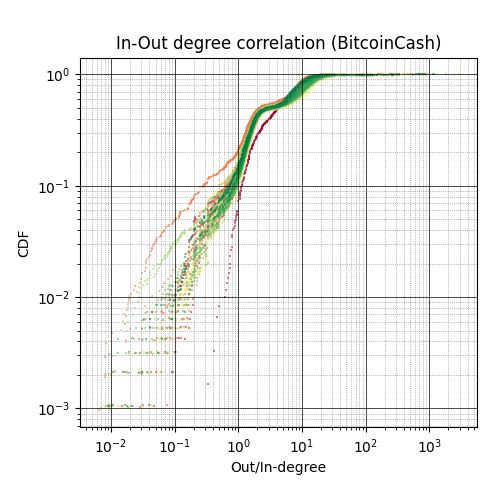
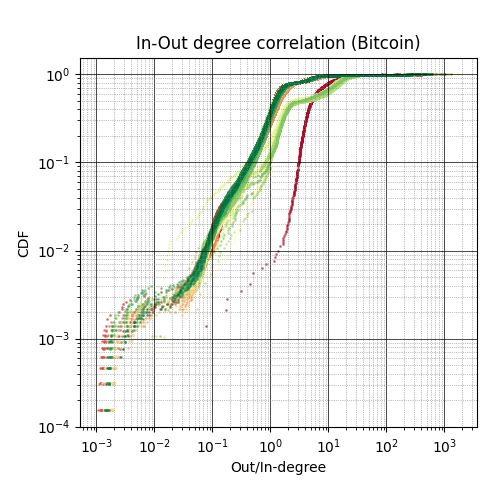
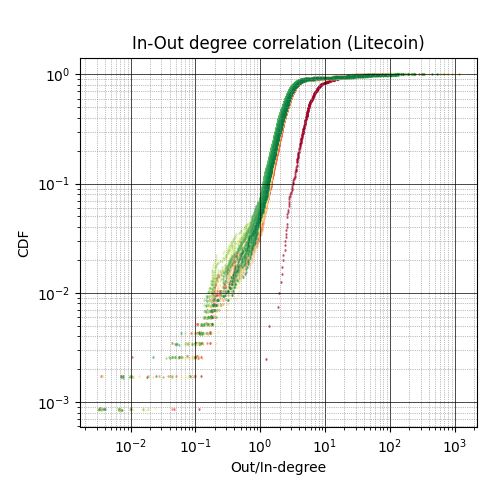
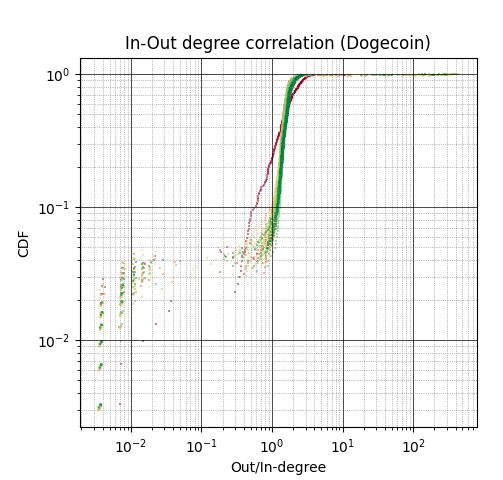
A First Look into the Structural Properties and Resilience of Blockchain Overlays 11

 (a) Bitcoin (b) Bitcoin Cash (c) Dash (d) Colorbar

 (e) Dogecoin (f) Ethereum (g) Litecoin (h) ZCash

Fig. 2. Out-degree complementary cumulative distribution function of BC networks studied. Snapshots are
colored according to the colorbar.

low-degree nodes. We compute the assortativity coefficient for each snapshot of BC network and
report the average value over all snapshots in Table 1. We find that Dash, Ethereum, and Litecoin
have neutral assortativities. Conversely, Bitcoin Cash, Zcash, and Bitcoin are more dissasortative.
Negative assortativity reveals a hub-and-spoke structure of these networks, and hints to the
existence of central peers that are important in the network.
Out/In Degree Ratio. Link analysis using the in-degree and out-degree distributions has proven
very powerful in identifying authoritative and central nodes in the Web and social networks [30].
We computed the out-degree over in-degree ratio of individual nodes for all snapshots and use it to
compare the structure of BC networks to the Web and social networks. In the Web, most nodes
have considerably higher out-degrees than in-degrees ( > 1), while a small fraction of nodes

fave significantly higher in-degrees than out-degrees ( < 1). Social networks have substantial
correlation between in-degree and out-degree and most nodes have an in-degree within 20% of their
out-degree [39]. In Figure 3, we show the cumulative distributions of the outdegree-to-indegree
ratio for nodes in all networks. Dogecoin marginally resembles a social networks with 45% of
its nodes having a good correlation, within 20%. This can be explained by the high number of
symmetric links, since Dogecoin has the largest reciprocity (see Table 1). In Bitcoin and Bitcoin
Cash, most nodes have considerably higher out-degree than in-degree, while a small fraction of
nodes have significantly higher in-degree than out-degree, a characteristic similar to the Web. Their
resemblance to the Web can be further strengthened by their dissassortative nature (see Table 1).
In Dash, we cannot observe any correlations, with half the nodes having higher out-degree and the
other half having higher in-degree. This indicates that half of the nodes in Dash are frequently
online in contrast with the other half that participate periodically. Closer inspection confirms
this indication but is omitted due to space considerations. In Litecoin and Zcash, we observe a

 , Vol. 1, No. 1, Article . Publication date: February 2021.
12

 (a) Bitcoin (b) Bitcoin Cash (c) Dash

 (d) Dogecoin (e) Ethereum (f) Litecoin (g) Zcash

Fig. 3. Cumulative Distribution Function (CDF) of / ratio per BC network studied. Snapshots are
colored according to 2.

concentration of nodes having higher out-degrees. Compared with their assortativity, this indicates
that these nodes tend to connect to lower degree nodes. In Ethereum, due to its distinguished
discovery mechanism, the vast majority of nodes have a very high out- over in-degree ratio.
Reciprocity. Moreover, we measure the reciprocity property, which is a measure of likelihood of
vertices in a directed graph to be mutually linked. It has been shown to be critical in modeling and
classification of directed networks [23]. Table 1 lists the average reciprocity across all snapshots for
each BC network. Zcash, Dogecoin, and Dash have significantly higher reciprocity values. We can
attribute this finding to a similar explanation on size and clustering. Closer examination also reveals
that these networks have a considerable number of nodes that are frequently online. Nodes that
are frequently connected are more likely to connect to nodes that are also frequently connected,
driving reciprocity higher.
Clustering Coefficient ( ). The local clustering coefficient measures the density of links in
node ’s immediate neighborhood: = 0 means that there are no links between ’s neighbors,
while = 1 implies that each of ’s neighbors link to each other as well. In a random network, the
local is independent of the node’s degree, and average , i.e., , depends on the system’s
size with respect to nodes, . In contrast, measurements indicate that for real networks, e.g., the
Internet, the Web, Science collaboration networks, the decreases with the node’s degree and is
largely independent of the system size [3]. The local in a random network ( ) is calculated
as the average degree < > over , i.e., = . The average degree of a network is equal

, Vol. 1, No. 1, Article . Publication date: February 2021.
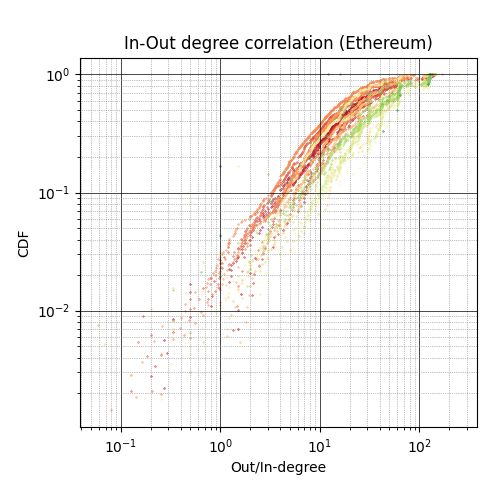
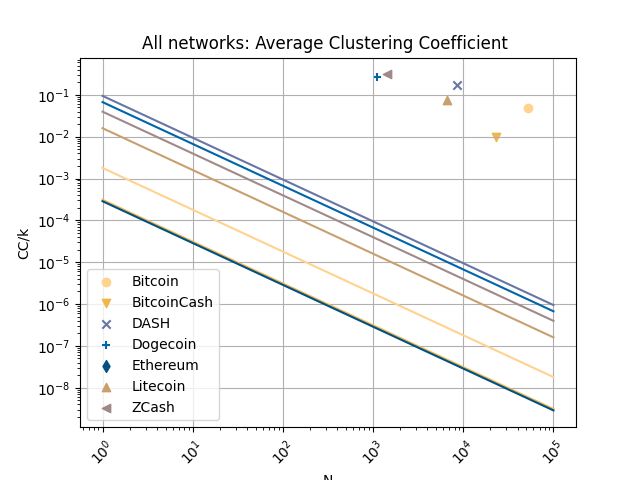
A First Look into the Structural Properties and Resilience of Blockchain Overlays 13

to 2
 , where is the number of links. The average of a real network is expected to be much
higher than a random graph.
 In Figure 4(a), we compare the average of the BC networks with the expected for random
networks of similar size. As in other real networks, we observe higher than expected for a
random network, further indicating that BC networks deviate significantly from random networks.
In Figures 4(b)-(c), we plot the dependence of the on the node’s degree for two of the BC
networks under study, where we make some remarkable observations. Although the empirical
rule from [3] states that higher degree nodes have lower , in Bitcoin we observe a significant
fraction of high degree nodes with high . The same finding was observed in Ethereum and Zcash
networks as well. Another deviation from the same empirical rule is observed in Dash, where
all nodes appear to have an almost constant , independent of node degree. We attribute this
behavior to its temporal characteristics, previously discussed in results related to Fig. 2. Further
inspection reveals that Dash has a very low churn, and most nodes are always online. The observed
 distributions indicate that BC networks are, in general, governed by rules rarely encountered
in other known networked systems.

 (a) All Networks (b) Bitcoin (c) Dash

Fig. 4. Analysis of Clustering Coefficient (CC) results.
(a)
 vs. BC network size; Size and CC averaged across snapshots ∀ ∈ . Markers correspond to the
networks of Table 1. Lines correspond to the prediction for random networks, = , with constant
< > and varying size . Similar to other known networks, the average appears to be independent of
the network size . (b)-(c) The dependence of the local on the node’s degree for each network. ( ) is
measured by averaging the local of all nodes with the same degree (showing results of aggregating all
snapshots of a given BC network). Horizontal lines correspond to the average of the network. Other BC
networks are omitted due to space limitations.

Scale-free property. One network property, tightly related with the degree distribution of a
network, is the scale-free property. A scale-free network is defined as a network whose degree
distribution follows a power law, i.e.,having a probability distribution ( ) ∝ − . Exponent is
known as the scaling parameter, and typically lies in the range 2 < < 3. The scale-free property
strongly correlates with the network’s robustness to random failures and has received tremendous
attention in the scientific literature (e.g., see [3]). Many real-world networks have been reported to
be scale-free, although their prevalence is questioned [8]. To test how well the degree distribution
of each BC network snapshot can be modeled by a power-law ( ), log-normal ( ), power-law with
exponential cutoff ( ) or stretched exponential ( ), we calculate the best fit using the powerlaw
package available by Alstott et al. [1].
 In Table 2, we report the number of times each type of distribution was the best fit, for all
snapshots of the same BC network The calculated results indicate the dynamic nature of BC

 , Vol. 1, No. 1, Article . Publication date: February 2021.
14

networks. Such BC networks that change over time may fit different distributions depending on the
snapshot collected, something that is also visible in Figure 2. The results suggest that BC networks
are not structured in the same way. Nevertheless, their degree distributions, in general, belong
to the exponential family of distributions. According to sources [14, 15, 17] Bitcoin’s network
formation procedure is intended to induce a random graph. Surprisingly, we find that BC networks
are substantially different to random networks, confirming past research [15, 38].

Table 2. Degree distributions of BC networks best-fit for different types of exponential distributions.
 :power-law; : log-normal; : power-law with exponential cutoff; : stretched exponential.

 Disrtibution Bitcoin Bitcoin Dash Dogecoin Ethereum Litecoin Zcash
 Cash
 LN 6.29% 76.90% - 49.40% 21.90% 40.10% 0.60%
 PL 0.60% 16.20% 1.80% 4.80% 24.60% 12.60% 18.90%
 PLEC 93.11% 6.90% 57.20% - 18.30% 46.40% -
 SE - - 41% 45.80% 35.30% 0.90% 80.50%

Small-world Property. The small-world phenomenon states that if you choose any two individual
nodes of a small-world graph, the distance between them will be relatively short, and definitely
orders of magnitude smaller than the size of the network. We examined all collected snapshots
to see if they satisfy the small-world property, by calculating the metric proposed in [50]. The
metric is defined as = − where and are the average shortest path and average clustering
coefficient of the snapshot, respectively. is the average shortest path for an equivalent random
network and is the average clustering coefficient of an equivalent lattice network. The value of
 ranges between −1, when the network has lattice characteristics, to +1 when the network has
random graph characteristics, with values near 0 interpreted as evidence of small worldliness.
 We did not find evidence that the networks under study satisfy this property. Although we observe
low average distances in all BC networks, they do not have high enough clustering coefficients to
be considered as small-world. Indicatively, the values we calculated are greater than 0.5 for Dash
and Zcash. The rest of the networks have values greater than 0.8

5.2 Overlapping Network Entities
In this section, we address the second research question RQ2: Are there network entities (peers,
links) that participate in more than one BC network, concurrently? What are their properties in
comparison to entities appearing in only one network?
Overlaps across time. We define as overlapping nodes those nodes that participate in more than
one networks at the same timestamp. The intuition of our analysis is as follows. In each snapshot,
we compare the set of overlapping nodes with all the other nodes, in order to draw insights on
overlapping nodes’ properties. Before describing the details of our study, we outline our mathemat-
ical notation to help explain our analysis. As mentioned earlier, the set of BCs studied is , and
the set of all timestamps crawled is . A snapshot of BC network , at timestamp is denoted as
 . We define the set S as our collected data-set, that consists of all snapshots . We denote as
the subset of S that contains all networks at timestamp . Subsequently, for each snapshot ∈
 ′ ′
we define two groups, and , such that = − . The first set, , is constructed such
that ∀ ∈ , ∉ \
 . That is, set contains the nodes that participate only in blockchain at

 ′
timestamp . Conversely, set contains the overlapping nodes; those that participate in blockchain
 ′
 and at least one other blockchain ∈ \ , at the same timestamp .

, Vol. 1, No. 1, Article . Publication date: February 2021.
A First Look into the Structural Properties and Resilience of Blockchain Overlays 15

Table 3. Edge and Node overlaps (aggregated). : number of networks where a unique entity (node or edge)
was found to be overlapping, regardless of time

 =2 =3 =4 >=5
 Nodes 34814 3909 1489 779
 Edges 143577 11034 1958 222

 A first approach in finding overlaps between BCs is by looking into our aggregated data-set,
S and count how many nodes and edges (i.e., pairs of endpoints), appear in more than one BC
network, regardless of time. Table 3 shows the summary of these results. Evidently, there exists a
significant number of network entities (both nodes and edges) that reside in more than one BC
network.
 A second step is to investigate whether overlapping entities occur frequently or sporadically
across time. For this, we focus on the nodes and count all overlapping nodes in each . In Figure 5a,
 ′
for each BC network , we plot the ratio of | | over | |, i.e., the number of overlapping nodes in
snapshot over the total number of nodes in the snapshot. We observe that in all BC networks,
there is almost a constant percentage of overlapping nodes that join more than one BC network.
Therefore, from this and the previous results, we can state that overlaps exist between BC networks,
they are significant and occur systematically through time.

 (a) Overlaps (b) KS-Test results

Fig. 5. a) Percentage of nodes that were found in more than one BC network at the same timestamp. X-axis
indicates the timestamp. b) Percentage of snapshots where the KS-test indicates a significant distance between
the distributions of the overlapping and non-overlapping nodes.

Structural Properties of Overlapping Nodes. In this paragraph, we study the properties of
overlapping nodes, compared to the rest of the network. The main idea is to check for any differences
 ′
between sets and that can be supported with statistical significance. For the following analysis,
we focused on the graph metrics presented in Sec. 5.1. Specifically, and for each BC network, we
compared distributions of in-degree, out-degree, betweenness centrality, clustering coefficient, and
page-rank. Since we already found that some of these metrics (degree distributions) are highly
skewed (see scale-free property fitting paragraph), we perform a normality test on all metrics to
decide on the statistical method to be used for the comparison. The normality test confirmed that
the distributions of all metrics are in fact not normal. Normality was checked by performing the

 , Vol. 1, No. 1, Article . Publication date: February 2021.
16

Shapiro-Wilk test, provided by the SciPy package [53]. Since we wish to compare distributions
of non-normal data, a non-parametric test is needed. Using the same package, we performed the
2-sample Kolmogorov-Smirnov test (KS-test) between all pairs of and ′ , for all ∈ and ∈ .
The KS-test returns the test statistic, , which is the maximum distance between the cumulative
distributions of the two samples. It also returns the p-value for the hypothesis test. If the test
statistic is small, or the p-value is higher than the selected statistical level (e.g., 0.05), then we
cannot reject the null hypothesis that the distributions of the two samples are the same. Our results
indicate that in all networks, there is a significant distance between the metrics’ distributions
 ′
among groups and . Interested to see if there exist a metric that describes this difference
better than the others, we looked into our results for the metric that gives significant values
consistently. In Figure 5b, we plot the percentage of all snapshots of a given BC network where
the p-value of the test is small enough, i.e., p-value< 0.05, and > 0.1. The plot indicates that
the distributions between the two groups are often non-equal. We can also observe that in most
networks the in-degree and page-rank metrics are the ones found more frequently, meaning that
 ′
these metrics capture the differences between and , more often than the other metrics. We
also found that the CDFs of overlapping nodes are lower than non-overlapping nodes, meaning
that the metrics of overlapping nodes are statistically higher. An exception in this finding was the
Dash network (indicated with an * in Fig. 5b), where the opposite is true: in Dash, overlapping
nodes have lower metrics than the rest. A key takeaway from this test is that overlapping nodes are
in fact different from other nodes. Although this test cannot serve as a proper classifier, it answers
our question that overlapping nodes have in fact different properties from the rest of the nodes in a
BC network.

5.3 Network Resilience to Attacks
In this section, we try to answer the third research question, RQ3: What are the implications of
networks’ properties with respect to their resilience against targeted attacks? How do shared
(overlapping) network entities affect network resilience to such attacks? To start this investigation,
we first describe the attack model. Then, we define four strategies that an attacker could employ to
partition a BC network, and we evaluate the efficacy of each strategy.
Attack Model. An adversary may have various incentives to attack a BC system. In this work, we
specifically study attacks on the underlying topology of BC networks with the goal to impair the
network’s main functions. Specifically, we define the following two goals of the attacker.
 (1) Network partitioning: to force the BC network into two or more network partitions. A
 network partition is the decomposition of a network into independent subnets, so that no
 information flow between the partitions is possible due to the absence of links between
 nodes.
 (2) Disturb the information propagation mechanisms by introducing intolerable delays. Such
 delays can typically increase the time to reach consensus among all participants and create a
 split in the application layer of a BC system. In fact, propagation delays are known to be key
 contributors towards BC forks [14].
Such attacks would impair a BC network’s main functions, potentially causing a decline in users’
trust in the system. Attackers with external incentives would be highly motivated to perform such
attacks. To measure the efficacy of each goal, we use two metrics: a) the size of the largest weakly
connected component, b) the number of connected components, and c) the network diameter. To
this end, we take into consideration the following attack strategies:
 (1) Attack minimum-cut edges, in order to partition the network by removing edges that are
 positioned in key places in the graph.

, Vol. 1, No. 1, Article . Publication date: February 2021.
A First Look into the Structural Properties and Resilience of Blockchain Overlays 17

 (2) Targeted attacks on unique nodes, based on a selected network metric. We test out-degree
 and betweenness centrality, but others can be employed.
 (3) Targeted attacks on nodes overlapping across more than one BC network. Nodes are ranked
 on their betweenness centrality.
 (4) Random attacks using random node removals emulate failures that can occur in the network
 in random fashion and are used as a baseline.
Minimum Edge Cuts. To compute the minimum edge cuts, we used the algebraic connectivity
of the derived graphs. The algebraic connectivity of a graph is defined as the second smallest
eigenvalue of its Laplacian matrix , 2 ( ) and is a lower bound on node/edge connectivity [22].
Since calculating the algebraic connectivity of a graph is computationally very expensive (i.e., >3
compute hours per snapshot), we analyse one snapshot per BC network. Using the computed
eigenvector, we count how many edges are required to be removed to split the network in two
parts, and compute their sizes and ratio of the two subnets (cut-ratio, computed as largest subnet
over the total). Results are presented in Table 4. Most cuts are heavily unbalanced. Bitcoin Cash has
an almost perfect cut, albeit by removing a high fraction of edges (6.5% of edges or 10k edges out of
total). Bitcoin and Zcash are somewhat affected, by removing less than 0.5% of their network edges.
Overall, targeting minimum cut edges does not have a significant effect in the networks’ state and
would require the removal (or disruption) of a considerable number of edges connecting nodes.

Table 4. Resilience of BC networks in edge and node removal. Critical Threshold: percentage of nodes that
reduce the largest component to 1% of its initial size.

 Bitcoin Bitcoin Dash Dogecoin Ethereum Litecoin Zcash
 Cash
 Edges 5545 10603 1451 581 2220 544 363
 Removed (0.1%) (6.5%) (0.02%) (0.44%) (2.71%) (0.08%) (0.33%)
 Network 9964/ 11367/ 46/ 11/ 436/ 37/ 258/
 Split 43949 11895 8556 1069 15345 6576 1231
 Cut Ratio 0.815 0.511 0.995 0.990 0.972 0.994 0.827
 Nodes rem.(%)
 50% ConCmpSz 5 4 - - 300 - 25
 Nodes rem.(%)
 #ConCmp> 2 5% 3% - - 4% - -
 Critical
 Threshold 6.5% 4% >12% >12% 5.50% >12% >12%

Targeted Node Attacks: Individual BC Networks. We do not study targeted link removals since
their removal is usually less effective and more difficult to mount. However, the removal of a node
simultaneously cuts all its adjacent links, and thus, is more efficient from the attacker’s point of
view. Here, we focus on how to remove nodes in the most efficient way in order to minimize the
amount of node removals necessary to cause a disruption. The way a node can be actually removed
from the network is out of scope. We follow a static procedure, in the sense that each node is given
a priority of removal once and for all, based on a chosen metric. For instance, when using the
out-degree metric, the higher the degree, the higher the importance of the node to be attacked.
After a node is removed, priorities are not recalculated. Nodes are removed from the network one
by one, following the given priority. After each node removal, we calculate the size of the largest
weakly connected component and the approximate diameter of the resulting graph. We report

 , Vol. 1, No. 1, Article . Publication date: February 2021.
You can also read