A Graphical Analysis of "The Geographer" - Heldermann-Verlag
←
→
Page content transcription
If your browser does not render page correctly, please read the page content below

Journal for Geometry and Graphics
                                                                Volume 26 (2022), No. 1, 115–124

   A Graphical Analysis of “The Geographer”
                                         Noriko Sato

                      Tokyo University of the Arts, Tokyo, Japan and
                  Joshibi University of Art and Design, Kanagawa, Japan
                                sato14004@venus.joshibi.jp

     Abstract. This research conducts a graphical analysis of The Geographer, a
     seventeenth-century painting by Dutch artist Johannes Vermeer. Produced in
     1669, it creates a contrast between light and shadow by depicting a close-up view
     in dark tones with a long-distance view on a bright floor. This contrast creates a
     sense of depth in the painting’s virtual space. A rectangle like the seat of a backless
     chair at the bottom right of the screen creates a difference in height with respect
     to the floor in the back, and functions as a motif to give a sense of depth to the
     picture. This sense of depth would be lost without the bright flooring. Vermeer
     painted the flooring when The Milk Maid was created, which would indicate that
     the flooring configuration was done in the early stages of his career. However,
     The Geographer belongs to the latter period. Furthermore, checkered tiles were
     brilliantly placed on the floor of the interior paintings produced before and after
     1669. Nevertheless, the flooring in this work does not constitute tiles. Therefore,
     this study analyzes whether the backless chair depicted in the foreground of this
     work was a part of the tiled floor that Vermeer intended to depict. As a result,
     the seat of this backless chair was equivalent to two square tiles. And if we assume
     that the construction method for those tiles that cover the floor of this painting
     was the first step, it suggests that a trigonometric ratio may have been used there.
     From this analysis, a hypothesis is formulated about Vermeer constructing floors
     of checkered tiles.
     Key Words: geometric aspects of technical art, seventheenth-century painting,
     perspective technique, golden ratio, drawing tiles
     MSC 2020: 51N05 (primary), 00A66

1 Introduction
The Geographer and The Astronomer have a typological composition in which a male model
is depicted alone in the picture. In both pictures, a carpet is nonchalantly placed on a table
whose legs are not visible. This placement of a chair or table whose legs are not visible in

ISSN 1433-8157/$ 2.50 © 2022 Heldermann Verlag
116                   N. Sato: A Graphical Analysis of “The Geographer”

the foreground creates a sense of depth with relation to the front wall. This composition
is characteristic of Vermeer’s paintings of interior scenes. It is important to note that the
backless chair in the foreground is similar to that used by the painter in The Art of Painting.
The rectangle depicted in the fore-ground in The Geographer may be a chair. Furthermore,
considering the age of production, it should have been possible to draw a floor with tiles;
however, there is a sense of discomfort in the flooring’s composition. Therefore, the assump-
tion is that the seat of the backless chair was a tile that Vermeer had intended to depict.
In this study, the hypothesis stated was based on the analysis of results from determining
the relationship between the composition and distance points located outside the canvas, in
determining the gradual reduction rate of the tiles.

2 Composition and the golden ratio
Robert Wald, a conservator, analyzed The Art of Painting in 2010. He reported that the
ratio of the length from the visual center (Vc ) to the edge of the picture (Q2 ) and from Q2 to
the distance point (D2 ) is the golden ratio [5, pp. 312–321]. He also stated that this finding
“may be a coincidence.” However, this study supports the probability that this finding may
not be a coincidence.

                    Figure 1: An Analytical Diagram of The Art of Painting.
        The Art of Painting, 120 cm × 100 cm, Kunsthistorisches Museum, Vienna.

    As shown in Figure 1, if we divide the line from the visual center (Vc ) to distance point
(D2 ) according to the golden ratio, the point (Q2 ) overlaps the edge of the canvas at the
division point. Moreover the division point can be set at the height of the line of sight
(HL), by dividing the area between the edge connecting the front wall to the ceiling and the
boundary line of the floor (OP ) according to the golden ratio. Furthermore, the dotted line
(O1 P1 ) is created when between the dotted line (OP ) and the dotted line (O2 P2 ) when it is
divided according to the golden ratio. When extended, OT converges at D1 and overlaps the
border of the drawn tile.
    In The Music Lesson and The Young Woman Standing at a Virginals, the relationship
between the golden section point from the visual center to the distance points and the com-
N. Sato: A Graphical Analysis of “The Geographer”                              117

position has already been analyzed [4, pp. 176–184]1 . At that time, The Geographer’s compo-
sition and golden ratio were not the subject of analysis. However, we investigated the golden
section of the width of the screen in The Art of Painting, but there were many possibilities to
ponder on. Nevertheless, as a result of The Geographer’s analysis, the following possibilities
can be considered.

3 Analysis of The Geographer
The model in The Geographer is in the midst of spreading something like a map on a desk and
measuring with a divider in one hand. However, his gaze is not focused on the hand holding
the tool and seems to be looking out of the closed window and thinking about something.
Similarly, the model in The Astronomer sits in a chair and stretches his right hand forward
to touch a celestial globe on a desk. Our line of sight is naturally guided towards the globe,
following the model’s line of sight and the direction of his arm. One theory states that the
model in both paintings was Antonie van Leeuwenhoek 1632–1723, who was born in Delft
and is considered a pioneer in microscopy [2, p. 104]2 .

3.1 A Comparison of the Composition in The Geographer and
    The Astronomer
When analyzing The Geographer’s visual center (VC1 ), we expected it to overlap around the
hand holding the divider, but actually it is located on the front wall behind the model. From
the window rail and the depth of the chest of drawers, we derive that VC1 is located between
the picture in the picture and the chest of drawers, as shown in Figure 2.
    In The Geographer, the position of VC1 is determined from the chest of drawers and the
chair on the right side of the picture. Here, the bottom of the chest is indicated by a gray
rectangle. There seems to be a space of approximately one window between the chest of
drawers and the model. Subsequently, the viewpoint can be obtained by assuming that the
motif, like the seat of the backless chair in the close-up view of this image, is rectangular.
    On the other hand, in Figure 3, The Astronomer’s visual center (VC ) is set around the
wrist of the model’s right hand, almost at the center of the canvas. VC is located at the center
of the picture, assuming that the window frame is perpendicular to the screen. The depth
line of the chest is toward VC and is drawn such that the area under the windows cannot be
seen. The part between the legs of the chair should ideally reflect the color tones of the floor.
However, as the color tone at dusk dominates the entire picture, the front wall and the floor
integrate, and their boundary becomes unclear.
    Although both paintings have a similar canvas size, The Geographer looks wider. In both
paintings, the chest of drawers, windows, and the picture within the picture are similar in size
and character; thus, these elements cannot be attributed to why the width of the paintings
 1
   Wald showed that the vanishing point of the chair depicted in the foreground in The Art of Painting
    converges on Q1 of the golden section in Figure 1. Wald’s analytical diagram is shown in [5] (Fig. 10 on
    p. 199). In our analysis, the vanishing point of the chair in the foreground in The Woman Standing at the
    Virginal converged to the golden section also.
 2
   According to Nash’s citation, the hypothesis by Arthur Wheelock of the National Gallery of Art in Wash-
    ington is that there are many similarities to the portrait of Leeuwenhoek created in 1686. In fact, after
    Vermeer’s passing, Leeuwenhoek was appointed the trustee of his property and it is believed that they
    were friends.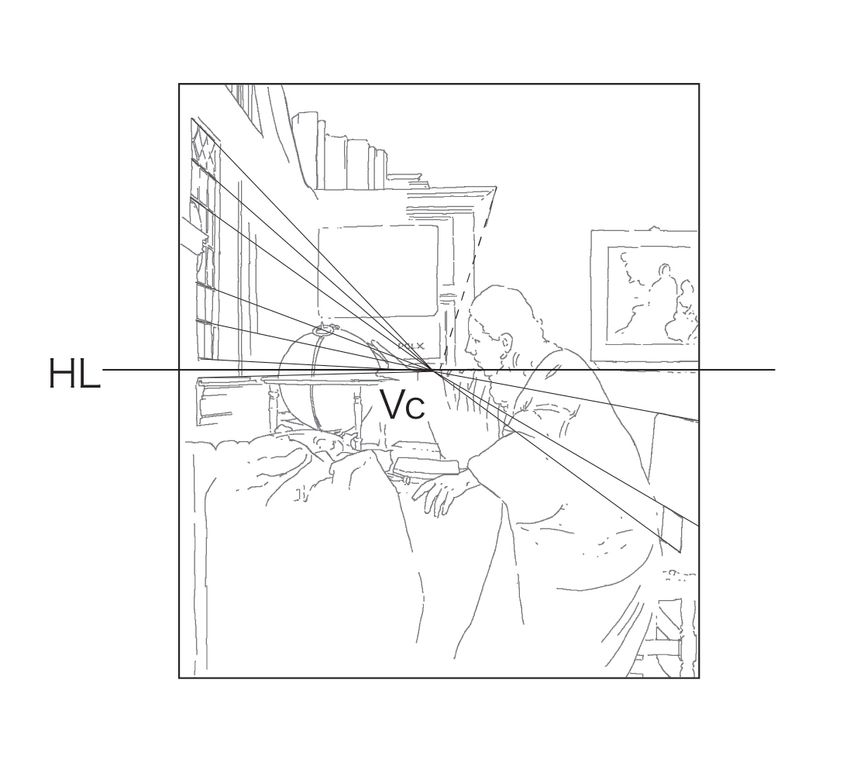
118                   N. Sato: A Graphical Analysis of “The Geographer”

seem different. Therefore, it is inferred that Vermeer’s control of light in his paintings is
a major factor in providing a sense of depth to the room. Both paintings are composed
differently with how the light from outside illuminates the room.
     In order to clearly depict light and shadow on a painting such as The Geographer, the
artist wants to create a feeling of contrast. If this is not achieved, that sense of depth will
be lost like in The Astronomer, and an obstruction will be created on the virtual space in
the painting. Therefore, the treatment of light and the composition of the painting play an
important role in creating a sense of depth in a limited space.

              Figure 2: An Analytical Diagram of The Geographer’s Visual Center.
           The Geographer, 52 cm × 45.5 cm, Städelsches Kunstinstitut, Frankfurt

              Figure 3: An Analytical Diagram of The Astronomer’s Visual Center.
                       The Astronomer, 51 cm × 45 cm, Louvre, Paris.

3.2 An Analysis of the Seats in The Geographer
Sometimes, Vermeer drew a chair with a backrest close to the right or left edge of the picture.
Therefore, it is natural to think that the chair depicted in this work was also arranged with the
same intention. However, it was observed that the angle of the chair’s outline approximated
N. Sato: A Graphical Analysis of “The Geographer” 119
that of the flooring tiles depicted in other works of Vermeer.3 Therefore, an analysis of the
chair (ABCD) was conducted by assuming a square tile with an inclination of 45◦ to the
screen, as shown in Figure 4.
Figure 4: An Analytical Diagram of the Seats in The Geographer
The visual center (VC2 ) was obtained near the left arm of the model. From the results, it
can be observed that these lines drawn for analysis converges at VC2 and the distance point
(D1 and D2 ). The two rectangles shown in Figure 4, like the white and black checkered tiles
depicted in other interior paintings, are inclined at 45◦ to the screen and are assumed to be
square. The part drawn as a seat indicates that Vermeer could have been trying to draw tiles
halfway through the painting. If so, the position of the visual center was changed from VC2 in
Figure 4 to VC1 in Figure 2 in the middle of the depiction then it would have been necessary
to add depth to the chest and change the angle of the crosspiece of the window frames.
Alternatively, it is possible that Vermeer tried to construct only the floor separately from
the chest of drawers and the window frame. Because the visual center has changed. As the
lower part of the chest is hidden behind the gown worn by the model, the consistency of the
perspective lines is not a point of concern. However, if the composition is changed in-between,
things like the arrangement of motifs and color tones must be harmonized. Nevertheless, if
Vermeer changed it, it is probable that he presumed that the new composition would make a
better picture.
3.3 The Relationship Between the Composition of The
Geographer and the Golden Ratio
In The Geographer, as shown in Figure 5, the line from the visual center (VC2 ) to the distance
points (D1 and D2 ) is divided into the golden ratio at points Q1 and Q2 . When the seat in
3
There are several works in which the tiles are organized in the lower right corner of the picture: The
Concert; The Art of Painting; and The Allegory of Faith.120 N. Sato: A Graphical Analysis of “The Geographer”
the foreground is assumed to be two square tiles, Q1 and Q2 are obtained by dividing the area
between the obtained visual center VC2 and the distance points (D1 and D2 ) according to the
golden ratio. Q1 is under the drawn window frame and above the canvas but Q2 is outside
the picture. In this instance, if the area from the upper edge of the canvas to the boundary
line OP of the floor is divided according to the golden ratio, the division point is obtained on
the line HL. Further, if the area from the line HL to the lower edge of the canvas is divided
according to the golden ratio, the division points will be obtained on the floor boundary OP .
After dividing VC2 to D1 into the golden ratio, Q1 was located as the division point near the
left edge of the screen (Figure 5).
Figure 5: An Analytical Diagram of the Golden Ratio in The Geographer
However, the division points of the golden ratio did not overlap the edges of the canvas,
as they did in Wald’s analysis. A straight line of any length can be divided according to the
golden ratio. However, it is not possible to place the division point unintentionally at the
boundary line of the floor and HL which are the predetermined positions for composition.
Such occurrences are possible by chance, but it cannot be considered a coincidence if it occurs
repeatedly. In Figure 1, it is observed that the division points of the golden ratio overlap at
the main positions when the perspective image is drawn. It is observed that the composition
of The Allegory of Faith is also determined using the golden ratio. The composition of the tiles
in The Allegory of Faith will be discussed later, along with the results of The Geographer’s
analysis.N. Sato: A Graphical Analysis of “The Geographer” 121
3.4 The Relationship Between the Golden Ratio and Distance
Points
Pietro Accolti (1579–1642) uses Euclid’s theorem to demonstrate that the triangles ABE
and DCE in Figure 6 are equiangular triangles and their sides are proportional in length [1,
p. 12]4 . If two other lines intersect each other between the two parallel lines, we can draw
another straight line on the part created between them, and divide the parallel lines into two.
Further, proportional sections can be created between them. He states that this proportional
relationship can be used by painters to enlarge a design. This study applies the concept
to the triangles D1 D2 R1 and T SR1 , as shown in Figure 5. It is observed that they shared
a similar relationship. Contrary to the analytical process so far, these important distance
points outside the canvas can be assumed, if the similarity of the golden ratio triangle is used
on the screen.
Figure 6: An Image by Pietro Accolti
A painter who used this method would have been able to draw as if he had used that
point without having to prepare a distance point outside the canvas. We won’t quite go into
how to assume a virtual distance point here, but we’ve already considered the possibility [3].
By setting this point farther from the visual center, the depicted scene will feel as if it were
viewed from a distance. The chair, depicted geometrically, pulls the viewer’s point of view
away from the screen, and as a result, the depicted scene fits inside a circular visual field
giving people a sense of realism. On the contrary, if this chair was not drawn in the near view
of the painting’s visual space, the composition would be as if the model was captured from a
short distance as in The Astronomer.
In The Art of Painting shown in Figure 1, the straight lines SP and OT overlap the
boundaries of the tiles, and these straight lines intersect at point R1 on the dotted line
O1 P1 . At this time, the triangle T R1 S is similar to the triangle OR1 P , which is similar to
the triangle D1 R1 D2 . The point R is located at a position that divides the width of the
canvas into two equal parts. The lines OR and P R are divided into golden ratios at Q3 and
Q4 , respectively. The ratio which divides the floor boundary OP into the golden ratio is
proportional to the straight lines D1 VC and D2 VC . Analysis shows that Vermeer may have
assembled the composition by incorporating the golden ratio vertically and horizontally on
the screen.
4
Quoted from Chapter 13. Same as above. Accolti cites and demonstrates Euclid’s Elements, Volume 1,
Proposition 29 and Proposition 15, Volume 6, Proposition 4, and Volume 5, Proposition 11. Accolti is an
Italian mathematician, painter, and architect. There is no record of this book ever being translated into
Dutch.122 N. Sato: A Graphical Analysis of “The Geographer”
4 Discussion on The Gradual Decrease Ratio of Tiles
The canvas size and depiction of the tiled floor in The Art of Painting and The Allegory of
Faith are similar. Figure 7 shows the relationship between the screen and the golden ratio
based on the line HL obtained from the analysis of the tiles in The Allegory of Faith. Upon
analysis it was noted that lines of the tiles in the painting do not completely converge at the
distance point (D1 ), the height of the line HL which determined by extending the diagonal
line of the tile that converges to the visual center.
Figure 7: An Analytical Diagram of The Allegory of Faith.
The Allegory of Faith, 114.3 cm × 88.9 cm, Metropolitan Museum of Art, New York.
The straight line OT almost coincides with the boundary line of the tile, but only one row
of the innermost tile does not follow this straight line. As a result, the area up to the bottom
edge of the canvas was not divided according to the golden ratio (below the dotted line OP ).
However, the gradual decrease ratio of tiles is derived from the intersection of straight lines
OT and P S in both The Art of Painting (Figure 1) and The Allegory of Faith (Figure 7).
Also, in both Figures 1 and 7, the floor boundary line OP — on the golden section point in
the vertical direction — is divided into two, at point R (OR = P R). As mentioned above,
the exact location of the border depicted in The Allegory of Faith is slightly above the OP
line and the row of tiles.
Figure 8 shows the result of drawing by adjusting the golden ratio in the vertical length of
the canvas as in the Geographer in Figure 5. The HL1 overlaps the shoulder of the model and
divides the vertical length of the canvas into two parts. So, if Vermeer set the visual center
without using distance points, it is possible that from VC1 , from the tiles in the foreground, he
had diagonal lines converge. In the Allegory of Faith, due to a carpet covering the right section
of the tiled floor, the observer can’t see from where diagonal lines would extend from the tiles,
so establishing the visual center as VC1 does not make you feel uncomfortable. However, in
order to set the golden section point at the edge of the screen, the position of the horizontal
line must be moved from HL1 to HL. This naturally causes the problem in that the vertical
length of the screen is not divided into golden sections. To solve this problem as an artist,
by adding a ceiling adjoining the front wall, the golden section along the vertical line can be
repositioned.N. Sato: A Graphical Analysis of “The Geographer” 123
Figure 8: An Analytical Diagram of The Allegory of Faith and the Golden Ratio.
5 Conclusions
This study addresses the question of how the sense of depth in Vermeer’s interior paintings
was created and examines only one of the probable answers. It does not connect the use
of the camera obscura with the needle holes on the picture. Vermeer may have applied the
rules for determining composition that was already attempted in the creation of The Art of
Painting to The Geographer to give depth to the room as depicted in The Astronomer. Then,
considering the order in which the works were painted, it is possible that he may have applied
the compositional division of The Geographer to The Allegory of Faith.
This concept of the golden ratio is nothing special and exists everywhere in nature. How-
ever, Vermeer may have considered the golden ratio as a special one in determining the
composition. That ratio was inherent in Vermeer’s painting’s even before this analysis was
done. And, the golden ratio does not overtly appear visible on the canvas. This fusion of
geometry and God is remarkable especially during the Renaissance. And, for Vermeer, the
golden ratio may have actually been something Divine.
This analysis shows that distance points can be obtained from similar triangles, even if
the camera obscura does not have a tile image. This means that the floor is geometrically
created even if there is no physical distance point in the atelier. In brief, it is also assumed
that Vermeer painted the tiles proportionally to fit the canvas size.
The Allegory of Faith and The Art of Painting were painted on a relatively large canvas.
However, checkered tiles were also painted on canvases smaller than these works. It is inferred
that Vermeer could not see the scene he painted through the camera lens all at once, even if
he used the camera obscura. Moreover, we believe that the performance of the lens Vermeer
used was not as effective as some may claim. From the results of analyzing Vermeer’s work,
the depictions and compositions left on the screen all show the high level of his unique artistic
skill.
Whether this finding can make up for the fact that despite many illustrators having
conducted analyses of the tile lines not matching the distance points, some questions remain
unanswered. Future research could determine whether ratios are repeated in the composition
of other works and are not limited only to the golden ratio, for example.124 N. Sato: A Graphical Analysis of “The Geographer”
Acknowledgments
I would like to thank Honorary Professor Kazuko Mende for her advice on conducting this
research. I would also like to thank to Mr. Scott Atkinson for helping me with the English
proofreading.
References
[1] P. Accolti: Lo inganno degli occhi, prospettiva pratica, trattato in acconcio della pittura.
Firenze, 1625.
[2] J. Nash: Vermeer. London Scala Publications Ltd. in association with the Rijksmuseum
Foundation, Amsterdam, 1991. ISBN 1-870248-62-7.
[3] N. Sato: An Analysis of Vermeer’s Perspective in Composition. J. Geom. Graphics
25(1), 139–154, 2021.
[4] N. Sato: Vermeer’s Painting Space — An Analysis in Descriptive Geometry —. Bigaku
Shuppan, 2022. ISBN 978-4-902078-72-5 C0071.
[5] R. Wald: The Art of Painting, Observation on Approach and Technique. In S. Haag,
E. Oberthaler, and S. Pénot, eds., Vermeer, The Art of Painting, Scrutiny of a
Picture. Residenz Verlag, Vienna, 2010. ISBN 978-3-85497-171-9. German with English
translation.
Received May 19, 2022; final form May 19, 2022.You can also read