A Leading Provider of Cloud Email Security, Productivity & Compliance Solutions - NASDAQ: ZIXI

Page created by Wallace Myers
 
CONTINUE READING
A Leading Provider of Cloud Email Security, Productivity & Compliance Solutions - NASDAQ: ZIXI
A Leading Provider of Cloud
Email Security, Productivity
& Compliance Solutions
NASDAQ: ZIXI

August 2021

                               1
A Leading Provider of Cloud Email Security, Productivity & Compliance Solutions - NASDAQ: ZIXI
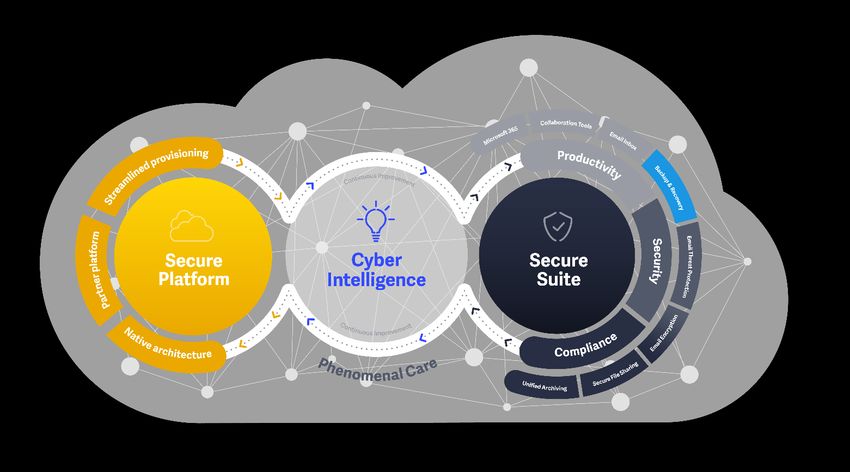
Important Cautions Regarding
             Forward-Looking Statements
Statements in this presentation that are not purely historical facts or that necessarily depend upon future events, including statements about
forecasts of projections of future business, market share, revenue, earnings, EBITDA, recognition of revenues from backlog, cash or other
financial metrics, or other statements about anticipations, beliefs, expectations, hopes, plans, intentions or strategies for the future, may be
forward-looking statements within the meaning of Section 21E of the Securities Exchange Act of 1934, as amended. Readers are cautioned not
to place undue reliance on forward-looking statements. All forward-looking statements are based upon information available to Zix at the time of
its most recent earnings announcement. This presentation is not an update of, and Zix undertakes no obligation to publicly update or revise, any
forward-looking statements, whether as a result of new information, future events or otherwise. Any forward-looking statements involve risks and
uncertainties that could cause actual events or results to differ materially from the events or results described in the forward-looking statements,
including risks or uncertainties related to economic conditions and performance, the ongoing COVID-19 pandemic, migration of customers to
cloud-based solutions, technological change, competitive threats, how privacy and data security law mandates may affect demand for Zix’s
products, Zix’s ability to successfully complete and integrate acquisitions, and Zix’s ability to obtain and retain customers, grow revenues and
deliver new products, whether organically or through acquisitions. Zix may not succeed in addressing these and other risks. Further information
regarding factors that could affect Zix financial and other results can be found in the risk factors sections of Zix's most recent filings on Form 10-
K and Form 10-Q with the Securities and Exchange Commission.

Detailed explanations of our non-GAAP financial measures and reconciliations of our adjusting items to the most directly comparable
GAAP financial measure can be found at http://investor.zixcorp.com.

                                                                                                                                   NASDAQ: ZIXI      2
A Leading Provider of Cloud Email Security, Productivity & Compliance Solutions - NASDAQ: ZIXI
Company Overview

       •          Leader in small medium business email              $252.4M                                      $53.5M (23%)
                  protection and productivity

       •          100% Subscription Revenue, 89% Cloud      Annual Recurring Revenue (ARR)                         Adjusted EBITDA (Margin)
                                                                                                                        Trailing Twelve Months1
                                                                    at June 30, 2021

       •          101% Net Dollar Retention1
                                                                          18%                                         100,000+

       •          527 Employees
                                                                  YOY Revenue Growth                                  Total End Customers
                                                                            Q2 2021                                            Q2 2021
       •          Headquartered in Dallas, TX
                                                          For a reconciliation of GAAP to adjusted non-GAAP results, see the
                                                          company’s earnings release on Aug. 5, 2021, which is available on the investor
                                                          relations Web page at http://investor.zixcorp.com
1. Three months ended June 30, 2021                                                                                    NASDAQ: ZIXI               3
A Leading Provider of Cloud Email Security, Productivity & Compliance Solutions - NASDAQ: ZIXI
Company Vision
 To be THE leading provider of cloud email security, compliance and productivity solutions

                                                                                                            2021 to 2025
                                                World-Class SaaS Platform and Service

                                                Layered Security Around the Mailbox
                                                                                                         $252.4M
2016 to 2021 ARR                                MSP Focus and International Market Expansion
                                                                                                            to
$55M to                                         Platform Intelligence for Enhanced Customer Protection
                                                                                                         $500M in
$252.4M                                         Security, Resiliency and Compliance in the Cloud
                                                                                                           ARR
                                                                                                         Leverage transition to the
                                                                                                           cloud for productivity,
                                                                                                         security and compliance

                                                                                                             NASDAQ: ZIXI      4
A Leading Provider of Cloud Email Security, Productivity & Compliance Solutions - NASDAQ: ZIXI
Secure Cloud

               Backup & Recovery

                   NASDAQ: ZIXI   5
A Leading Provider of Cloud Email Security, Productivity & Compliance Solutions - NASDAQ: ZIXI
Q2 2021 Cloud ARR Growth
Zix’s Growth in Cloud based on Annual Recurring Revenue
Accelerated by Recent Acquisitions
Cloud ARR represents 89% of Total ARR
__% Year-over-year Growth

                                                          NASDAQ: ZIXI   6
Extrinsic Market Drivers
A Confluence of Market Factors are Aligning that Provide Zix with Powerful Tailwinds

                                Email Still the Top                                              Communication                                                          Strengthening
                                 Attacked Vector                                                   is Evolving                                                            the Cloud

                                                                    SaaS Platforms Not                                                  Expanding
                                                                    Liable for Data Loss                                                Regulations
                                               94%                                                            45%                                                                       85%
              Accelerated
                Digital
            Transformation               Of malware sent via
                                                                               96%                          increase in                         43%                           of organizations
                                               email                                                       collaboration
                                                                                                                                                                            Using Office 365 will rely on
                                                                                                             tool spend                                                    non-Microsoft security tools to
                                                                                                                                                                         maintain consistent security policies

                                                                      of companies who                                             increase of annual
                                                                      have a backup and                                            compliance spend
                                                                    recovery plan, survive                                      Average cost of compliance rose
                                                                     ransomware attacks                                            to nearly $5.5M annually

• COVID-19 accelerated        • Expect increases in            • Ransomware accounts         • 30% of the workforce        • Increased public                     • Large market
  the need for digitization     targeted phishing due            for 27% of all malware        will work remotely            scrutiny of business                   opportunity driven
  of business operations        to the SolarWinds                incidents                     a few days a week in          data security                          by the need for
  and services by 4             breach & Microsoft                                             2021 & beyond                                                        specialized security
                                                               • 1 in 3 companies                                          • HIPAA, SEC rules and
  years                         Zero-day disclosures                                                                                                                for cloud offerings
                                                                 experience SaaS             • Microsoft saw a               industry regulations
                                                                 data loss                                                   require protection of
                                                                                               3,891% increased
                                                                                               use of MS Teams               consumer data

                                                                                                                                                                                 NASDAQ: ZIXI                    7
Intrinsic Growth Drivers

 Consistent Customer                                           Expanded Product
                                                                                                                          Future Trajectory
    Satisfaction                                                Offering (R&D)

                                      Prioritized Channel                                     Expanded Product
                                         Investments                                         Offering & Cross-Sell
                                                                                                Opportunities
                                                                                                 (Acquisitions)
                                                                                                                              Strategic expansion of our
                                                                                                                                TAM and focus on the
         Net Promoter Score                                                                                                      cloud, positions the
        exceeds competition,                                                                                                  Company to better exploit
      demonstrating the value                                         Cloud platform                                          market trends in business
      of Zix and the opportunity                                   investments driving                                         resilience, compliance,
            to attach more                                         adoption of our core                                           and email security
                                                                   multi-tenant solution
                                     Expand VAR and MSP
                                      relationships through
                                       automating partner                                   Bundled email security &
                                    specific workflows & PSA                                   compliance solution
                                   integration enhancements                                driving higher cross-selling

                                                                                                                                         NASDAQ: ZIXI      8
Excellence through Experience

  ~20-year relationship as Microsoft CSP

  >14,000 successful M365 migrations

  > 90,000 joint customers

  97% first call resolution on M365 support calls

  Long-standing member of Microsoft PAC

                                                    NASDAQ: ZIXI   9
Better Together – Zix & M365

                               Phenomenal Support
                               for M365
                               Quick, effective support

                               Gold Standard
                               Compliance for M365
                               Simple, effective tools

                               Back up for M365
                               Critical business resilience

                               M365 Security Audit
                               Insight and remediation

                               Email Security
                               for M365
                               Peace of mind security

                               M365 CSP
                               Experience you can trust

                                                              NASDAQ: ZIXI   10
Key Growth Areas

     New Customer    Sales to   Increase
      Acquisition    Existing   Retention
                    Customers

                                            NASDAQ: ZIXI   11
Financial
Information
Financial Highlights
                       Strong Healthcare & Financial Customers Focused on Compliance
                       Mission Critical Applications for the SMB ~ Email Box & Surrounding Security

                                   100%                                  10+ Years                                   No Customer
                           Subscription Revenue                    Consistent Profitability*                         >1% Revenue

                                         101.4% Net Dollar                                                18% Q2 2021
                                        Revenue Retention(1)                                             Revenue Growth

1 Three months ended June 30, 2021      *Zix profitability defined as non-GAAP adjusted net income before deemed                   NASDAQ: ZIXI   13
                                        dividends and excluding deferred tax (benefit) expense
Annual Recurring Revenue (ARR)
• ARR increased 17% year-
  over-year to record $252.4M                                ARR Growth
                                                                                                                 $252.4
                                                                                                       $243.6
• Email security and                                                                          $237.7
                                                                                  $222.3
  productivity solutions driving                     $209.7 $214.3
                                                                   $215.9
  strong cross-selling             $193.7
                                            $200.3
  activity and ARR growth
• Cloud-based offerings
  comprise 89% of ARR

                                   Q2-19    Q3-19    Q4-19   Q1-20     Q2-20          Q3-20   Q4-20     Q1-21     Q2-21

                                                                     *$ in millions

                                                                                                       NASDAQ: ZIXI       14
Q2 2021 Financial Highlights
• Revenue increased 18% year-
  over-year to record $62.8M
                                             Quarterly Revenue Growth
• GAAP fully diluted EPS                                                                                        $62.8
                                                                                                     $60.0
  attributable to common                                                                 $57.9
                                                                                 $54.8
  stockholders of ($0.10)                                    $52.4     $53.3
                                                     $50.4
                                             $47.8
• Non-GAAP fully diluted EPS         $45.9

  before deemed dividends and
  excluding deferred tax (benefit)
  of $0.14
• 14.7M Cash Flow from
  Operations an increase of $10.0
  million from Q2 2020
• $33.9M in cash/investments
                                     Q2-19   Q3-19   Q4-19   Q1-20     Q2-20     Q3-20   Q4-20       Q1-21      Q2-21

                                                                *$ in millions

                                                                                                 NASDAQ: ZIXI       15
New Customers & Secure Cloud Adoption
                       Majority of New Customers On-boarded to Secure Cloud Platform

                   New Customers                                New Partners by Year                  Number  of Services
                                                                                                       Percentage of New per
                                                                                                      Secure Cloud Customer
                                                                                                    Customers on-boarded  to
                                                                                                     Secure Cloud in Q4-20

                                                5,232                                   5,644
                                                                                                                                  1.32
                                                                                5,003
     4,503      4,520                                                   4,734                                           1.31
                           4,256                                4,459
                                        3,863                                                                   1.30
                                                        3,849
                                                                                                        1.29

                                                                                                1.26

     Q2-20       Q3-20      Q4-20       Q1-21   Q2-21   2017     2018   2019    2020    2021    Q2-20   Q3-20   Q4-20   Q1-21     Q2-21

*Secure Cloud launched in April 2020.                                                                              NASDAQ: ZIXI      16
Generating Substantial Cash Flow

   Cash Flow from
   Operations                     $31.3
 *$ in millions
                                                                                 $25.4

$18.2
                  $16.7
                                                     $14.7
                          $14.0

                                                                $9.1

                                           $4.7

2017              2018    2019    2020    Q2 2020   Q2 2021   YTD 2020        YTD 2021

                                                                       NASDAQ: ZIXI      17
Balance Sheet & Capital Structure
                      Strong, unlevered free cash flow generation positions Zix
                      favorably versus debt obligations
                                                                                                                                           Maximum Total Net
                                                                                Leverage Ratio vs.                                      Leverage Ratio by Quarter4
                                                                             Debt Covenant Schedule3
• Cash: $33.9M1                                                                                                                          Date
                                                                                                                                                              Maximum Total
                                                                                                                                                              Net Leverage
                                                                                 Net Debt to Adj. EBITDA Ratio    Cushion                                     Ratio

                                                                                                                                         September 30, 2019   5.25:1.00

• Total Debt: $211.3M1(due Feb. 20, 2024)                                                                                                December 31, 2019    5.00:1.00

                                                                      4.75              4.75                                             March 31, 2020       5.00:1.00
   •    5-Year Term Loan: $201.5M (@ 4.00%)                                                               4.50              4.50         June 30, 2020        5.00:1.00

   •    Delayed Draw Term Loan: $9.8M (@ 3.41%)                       1.05              1.25
                                                                                                                                         September 30, 2020   4.75:1.00

                                                                                                          1.20              1.50         December 31, 2020    4.75:1.00

                                                                                                                                         March 31, 2021       4.75:1.00

• Adjusted EBITDA (FY21): ~$56.0M2                                                                                                       June 30, 2021        4.50:1.00

                                                                                                                                         September 30, 2021   4.50:1.00

1. Balance sheet data as of June 30, 2021                                                                                                December 31, 2021    4.50:1.00
2. Outlook effective only as of August 5, 2021                        3.7               3.5                3.3
3. Leverage ratios based on adjusted EBITDA calculations for the                                                            3.0          March 31, 2022 and
                                                                                                                                                              4.25:1.00
   trailing four quarters in each period as previously disclosed in                                                                      thereafter

   quarterly results press releases and 8K filings
4. Maximum Total Net Leverage Ratio by Quarter4 as stated in Zix’s
   credit agreement dated Feb. 20, 2019, as amended, and filed
   under an 8-K on November 9, 2021
                                                                       Q4 2020        Q1 2021           Q2 2021      Q4 2021 Estimate
                                                                                                                     Based on ~$56.0M
                                                                                                                     Adjusted EBITDA
                                                                                                                                             NASDAQ: ZIXI                 18
ESG Efforts Enhance Business Resiliency
                   Zix exceeds sector-specific ESG performance
                   requirements set by ISS, earning a top industry ranking
                   *“Prime Status” ranking by ISS (2020-2021)

ENVIRONMENT                                               S O C I AL                                    G O V E R N AN C E

                                                                New Ideas and                                 Preparedness
    Reduced                                                     Techniques from
    Consumption &                                                                                             Corporate “Operating
                                                                Diverse Viewpoints                            System” for Setting and
    Cost Savings                                                DE&I Strategy to Grow Diversity,              Achieving Goals
    Data Center Efficiency
                                                                Initially Focused on Inclusion in:            (modeled after the
                                                                • Assignments                                 Objective Key-Result
    Management                                                  • Decision Making, and
                                                                                                              process)
    • 2011 Upgrade and                                          • Mentoring
      Ongoing Upkeep

                                                                Employee Career
                                                                Development
                                                                                                              Risk Mitigation
    14% Office Space                                                                                          Tested Business
                                                                Self-Directed and Team
    Reduction                                                   Developmental Learning                        Continuity Procedures,
                                                                (+500 Employees)                              Including During the Covid
                                                                • Average Time per Individual: 6h 15m         Shift to Work-From-Home
                                                                • Courses Completed: 2,409

                                                                                                                      NASDAQ: ZIXI         19
Key Takeaways
•   Industry leader in cloud email
    security, productivity and compliance
    solutions
                                                                                                  Revenue                                 $253.1-
                                                                 $ in millions
                                                                                                                                   $218.5 $253.9
•   Broad solution suite addresses
                                                                                                                      $173.4
    entire business communications
    market from enterprise to SMB
                                                                   $54.7         $60.1       $65.7        $70.5
•   Diversified customer base with
                                                                    2015         2016         2017         2018         2019         2020        2021F
    robust go-to-market channels of
    direct sales teams, VARs, and MSPs
•   100% subscription-based                                                      Fully Diluted Non-GAAP
    predictable business model with
    eight consecutive years of profitability
                                                                                      Adjusted EPS
•   Strong cash flow generation and
                                                                                                                                     $0.60       $0.58-
    $200M+ in NOLs
                                                                                                                       $0.43                     $0.60
•   Strong outlook for adjusted EBITDA                                           $0.26       $0.29        $0.33
                                                                   $0.21
    dollar growth and market share                                  2015         2016         2017         2018          2019         2020        2021F
    expansion

                                                     •   Before deemed dividends and acquisition related expenses and excluding deferred tax (benefit) expense
                                                     •   For a reconciliation of GAAP to adjusted non-GAAP results, see the company’s earnings release on August 5,
Note: Outlook effective only as of August 5, 2021.       2021, which is available on the investor relations Web page at http://investor.zixcorp.com

                                                                                                                                             NASDAQ: ZIXI             20
Contact Us
Company Contact:
Dave Rockvam
Chief Financial Officer
Zix Corporation
drockvam@zixcorp.com

Investor Relations:
Matt Glover or Tom Colton
Gateway Investor Relations
(949) 574-3860
ZIXI@gatewayir.com

                             NASDAQ: ZIXI   21
Appendix

           NASDAQ: ZIXI   22
Reconciliation of GAAP to Non-GAAP Financial Measures
                                                                                                        Three Months Ended                   Six Months Ended
2nd Quarter 2021 (Unaudited)                                                                            2021
                                                                                                              June 30,
                                                                                                                       2020                2021
                                                                                                                                                  June 30,
                                                                                                                                                           2020
          Revenue:
           GAAP revenue                                                                            $   62,829,000    $ 53,337,000      $ 122,844,000     $ 105,771,000
          Cost of revenue
           GAAP cost of revenue                                                                    $   34,604,000    $ 28,258,000      $   67,742,000    $   54,337,000
           Stock-based compensation charges (1)                                              (A)         (123,000)       (836,000)           (391,000)       (1,008,000)
           Strategic consulting and litigation costs (2)                                     (B)           (8,000)        (56,000)             (9,000)         (115,000)
           Intangible Amortization (3)                                                       (C)       (2,916,000)     (2,339,000)         (5,839,000)       (4,946,000)
           Corporate separation payment (4)                                                  (D)          (52,000)       (867,000)            (52,000)         (867,000)
             Non-GAAP adjusted cost of revenue                                                     $   31,505,000    $ 24,160,000      $   61,451,000    $   47,401,000
          Gross profit:
           GAAP gross profit                                                                       $   28,225,000    $ 25,079,000      $   55,102,000    $   51,434,000
           Stock-based compensation charges (1)                                              (A)          123,000         836,000             391,000         1,008,000
           Strategic consulting and litigation costs (2)                                     (B)            8,000          56,000               9,000           115,000
           Intangible Amortization (3)                                                       (C)        2,916,000       2,339,000           5,839,000         4,946,000
           Corporate separation payment (4)                                                  (D)           52,000         867,000              52,000           867,000
             Non-GAAP adjusted gross profit                                                        $   31,324,000    $ 29,177,000      $   61,393,000    $   58,370,000
          Research and development expense
           GAAP research and development expense                                                   $    6,882,000    $   5,820,000     $   12,942,000    $   11,206,000
           Stock-based compensation charges (1)                                              (A)         (963,000)        (414,000)        (1,576,000)         (752,000)
           Strategic consulting and litigation costs (2)                                     (B)          (17,000)         (26,000)           (33,000)         (132,000)
           Intangible Amortization (3)                                                       (C)          (76,000)         (76,000)          (151,000)         (152,000)
           Corporate separation payment (4)                                                  (D)         (167,000)        (128,000)          (167,000)         (128,000)
             Non-GAAP adjusted research and development expense                                    $    5,659,000    $   5,176,000     $   11,015,000    $   10,042,000
          Selling and marketing expense
           GAAP selling and marketing expense                                                      $   15,646,000    $ 14,458,000      $   30,568,000    $   28,799,000
           Stock-based compensation charges (1)                                              (A)       (1,256,000)       (767,000)         (2,338,000)       (1,311,000)
           Strategic consulting and litigation costs (2)                                     (B)           (1,000)        (13,000)             (2,000)          (52,000)
           Intangible Amortization (3)                                                       (C)       (3,348,000)     (3,108,000)         (6,675,000)       (6,227,000)
           Corporate separation payment (4)                                                  (D)         (131,000)       (439,000)           (174,000)         (439,000)
             Non-GAAP adjusted selling and marketing expense                                       $   10,910,000    $ 10,131,000      $   21,379,000    $   20,770,000
          General and administrative expense
           GAAP general and administrative expense                                                 $    6,745,000    $    4,758,000    $   13,120,000    $   10,446,000
           Stock-based compensation charges (1)                                              (A)       (2,117,000)       (1,233,000)       (3,959,000)       (2,170,000)
           Strategic consulting and litigation costs (2)                                     (B)          (89,000)          (26,000)         (492,000)         (202,000)
           Corporate separation payment (4)                                                  (D)          (45,000)         (109,000)          (45,000)         (109,000)
             Non-GAAP adjusted general and administrative expense                                  $    4,494,000    $    3,390,000    $    8,624,000    $    7,965,000

                               Note – referenced footnotes (1) – (4) can be found on the following page and (A) – (D) on page 4
                                                                                                                                                                           23
Reconciliation of GAAP to Non-GAAP Financial Measures
                                                                                                                  Three Months Ended                       Six Months Ended
2nd Quarter 2021 (Unaudited)                                                                                      2021
                                                                                                                        June 30,
                                                                                                                                 2020                    2021
                                                                                                                                                                June 30,
                                                                                                                                                                         2020
     Operating income:
      GAAP operating income                                                                                 $    (1,048,000)     $     43,000       $   (1,528,000)   $      983,000
      Stock-based compensation charges (1)                                                           (A)          4,459,000         3,250,000            8,264,000         5,241,000
      Strategic consulting and litigation costs (2)                                                  (B)            115,000           121,000              536,000           501,000
      Intangible Amortization (3)                                                                    (C)          6,340,000         5,523,000           12,665,000        11,325,000
      Corporate separation payment (4)                                                               (D)            395,000         1,543,000              438,000         1,543,000
        Non-GAAP adjusted operating income                                                                  $    10,261,000      $ 10,480,000       $   20,375,000    $
                                                                                                                                                                      $   19,593,000
                                                                                                                                                                                 -
     Adjusted Operating Margin                                                                                         16.3%               19.6%             16.6%             18.5%
     Net income:
      GAAP net (loss) income                                                                                $    (2,931,000)     $    (1,902,000)   $   (5,391,000)   $   (2,754,000)
      Stock-based compensation charges (1)                                                           (A)          4,459,000            3,250,000         8,264,000         5,241,000
      Strategic consulting and litigation costs (2)                                                  (B)            115,000              121,000           536,000           501,000
      Intangible Amortization (3)                                                                    (C)          6,340,000            5,523,000        12,665,000        11,325,000
     Corporate separation payment (4)                                                                (D)            395,000            1,543,000           438,000         1,543,000
        Non-GAAP adjusted net income                                                                        $     8,378,000      $     8,535,000    $   16,512,000    $   15,856,000
      Deferred tax (benefit) expense                                                                               (510,000)            (574,000)         (732,000)       (1,207,000)
       Non-GAAP adjusted net income excluding deferred tax (benefit) expense                                $     7,868,000      $     7,961,000    $   15,780,000    $   14,649,000
     Deemed and accrued dividends on preferred stock                                                             (2,399,000)          (2,218,000)       (4,722,000)       (4,447,000)
       Adjusted Net income attributable to common stockholders                                              $     5,469,000      $     5,743,000    $   11,058,000    $   10,202,000
     Diluted net income per common share:
      GAAP net income per share before deemed dividends                                                   $             (0.05)   $         (0.03)   $        (0.10)   $         (0.05)
      Adjustments per share                                                                         (A-D) $              0.20    $          0.19    $         0.40    $          0.34
         Non-GAAP adjusted net income per share before deemed dividends                                   $              0.15    $          0.16    $         0.30    $          0.29
                                                                                           dividends
      Deferred tax (benefit) expense impact to Non-GAAP adjusted net income before deemed (E)             (0.01)
                                                                                                 $ per share                     $         (0.01)   $        (0.01)   $         (0.02)
                                                                                                 $
       Non-GAAP adjusted net income before deemed dividends per share excluding deferred tax (benefit)     0.14
                                                                                                       expense                   $          0.15    $         0.29    $          0.27
      Deemed dividends per share impact to Non-GAAP adjusted net income                                     $           (0.04)   $         (0.04)   $        (0.09)   $         (0.08)
       Adjusted Net income per share attributable to common stockholders                                    $            0.10    $          0.10    $         0.20    $          0.19

      Shares used to compute Non-GAAP adjusted net income per share - diluted                                   55,075,242           54,788,858         54,806,858        53,770,821
                                        Note – referenced footnotes (1) – (4) can be found on the following page and (A) – (E) on page 4
                                                                                                                                                                                         24
Reconciliation of GAAP to Non-GAAP Financial Measures
                                                                                                                            Three Months Ended                    Six Months Ended

2nd Quarter 2021 (Unaudited)                                                                                                2021
                                                                                                                                  June 30,
                                                                                                                                           2020                 2021
                                                                                                                                                                       June 30,
                                                                                                                                                                                2020
               Reconciliation of Net income to EBITDA and Adjusted EBITDA:                                        (F)
               Net income                                                                                               $   (2,931,000)   $   (1,902,000)   $   (5,391,000)   $   (2,754,000)
               Income tax provision                                                                                           (352,000)         (570,000)         (455,000)       (1,440,000)
               Interest expense                                                                                              2,187,000         2,508,000         4,313,000         5,155,000
               Depreciation                                                                                                  1,059,000         1,285,000         2,207,000         2,597,000
               Amortization                                                                                                  8,323,000         6,436,000        16,475,000        12,917,000
                 EBITDA                                                                                                      8,286,000         7,757,000        17,149,000        16,475,000
               Adjustments:
                Stock-based compensation charges (1)                                                              (A)        4,459,000       3,250,000           8,264,000         5,241,000
                Strategic consulting and litigation costs (2)                                                     (B)          115,000         121,000             536,000           501,000
                Corporate separation payment (4)                                                                  (D)          395,000       1,543,000             438,000         1,543,000
                  Adjusted EBITDA                                                                                       $   13,255,000    $ 12,671,000      $   26,387,000    $   23,760,000
                  Adjusted EBITDA margin                                                                                         21.1%            23.8%              21.5%             22.5%

               (1) Stock-based compensation charges are included as follows:
                   Cost of revenues                                                                                     $      123,000    $     836,000     $      391,000    $    1,008,000
                   Research and development                                                                                    963,000          414,000          1,576,000           752,000
                   Selling and marketing                                                                                     1,256,000          767,000          2,338,000         1,311,000
                   General and administrative                                                                                2,117,000        1,233,000          3,959,000         2,170,000
                                                                                                                        $    4,459,000    $   3,250,000     $    8,264,000    $    5,241,000
               (2) Strategic consulting, acquisition, integration and litigation costs are included as follows:
                   Cost of revenues                                                                                             8,000            56,000             9,000           115,000
                   Research and development                                                                                    17,000            26,000            33,000           132,000
                   Selling and marketing                                                                                        1,000            13,000             2,000            52,000
                   General and administrative                                                                                  89,000            26,000           492,000           202,000
                                                                                                                        $     115,000     $     121,000     $     536,000     $     501,000
               (3) Intangible Amortization is included as follows:
                   Cost of revenues                                                                                          2,916,000        2,339,000          5,839,000         4,946,000
                   Research and development                                                                                     76,000           76,000            151,000           152,000
                   Selling and marketing                                                                                     3,348,000        3,108,000          6,675,000         6,227,000
                                                                                                                        $    6,340,000    $   5,523,000     $   12,665,000    $   11,325,000
               (4) Corporate separation payment is included as follows:
                   Cost of revenues                                                                                            52,000           867,000            52,000            867,000
                   Research and development                                                                                   167,000           128,000           167,000            128,000
                   Selling and marketing                                                                                      131,000           439,000           174,000            439,000
                   General and administrative                                                                                  45,000           109,000            45,000            109,000
                                                                                                                        $     395,000     $   1,543,000     $     438,000     $    1,543,000

               (5) Net Income tax components:
                   Current tax (benefit)/expense                                                                               157,000            4,000            277,000          (233,000)
                   Deferred tax (benefit)/expense                                                                             (510,000)        (574,000)          (732,000)       (1,207,000)
                                                                                                                        $     (353,000)   $    (570,000)    $     (455,000)   $   (1,440,000)

                   Note – referenced footnotes (1) – (4) can be found on the following page and (A) – (D) on page 4
                                                                                                                                                                                                25
Use of Non-GAAP Financial Information
   This presentation includes Non-GAAP measures. Our Non-GAAP measures are not meant to be considered in isolation or as a substitute
   for comparable GAAP measures and should be read only in conjunction with our consolidated financial statements prepared in
   accordance with GAAP. For a detailed explanation of the adjustments made to comparable GAAP measures, the reasons why
   management uses these measures, the usefulness of these measures and the material limitations of these measures, see items (A)
   through (F) below.
   Items (A) through (F) on the "Reconciliation of GAAP to Non-GAAP Financial Measures" table are listed to the right of certain categories
   under "Gross profit," "Operating income," "Net income," "Net income excluding deferred tax (benefit) expense," "Net income per share –
   diluted," "Net income per share excluding deferred tax (benefit) expense- diluted" and "EBITDA" and correspond to the categories
   explained in further detail below under (A) through (F).
   (A) Non-cash stock-based compensation charges relating to stock option grants, restricted stock, restricted stock units, and performance
   units awarded to employees and accounted for in accordance with Share-Based Payment accounting guidance. See (1) on previous page
   for breakdown of stock-based compensation. Because of varying valuation methodologies, subjective assumptions and varying award
   types, the Company believes that the exclusion of stock-based compensation charges provides for more accurate comparisons to our
   peer companies and for a more accurate comparison of our financial results to previous periods. Additionally, the Company believes it is
   useful to investors to understand the specific impact of non-cash stock-based compensation charges on our operating results.
   (B) Strategic consulting, acquisition, integration and litigation costs. See item (2) on previous page for breakdown of strategic consulting,
   acquisition, integration and legal costs. The Company’s management excludes these costs when evaluating its ongoing performance
   and/or predicting its earnings trends and therefore excludes these charges on our adjusted operating results.
   (C) Intangible amortization costs. See item (3) on previous page. The Company’s management excludes amortization expenses
   associated with the acquisition of intangible assets when evaluating its ongoing performance and/or predicting its earnings trends and
   therefore excludes these charges on our adjusted operating results.
   (D) Corporate separation payment relating to employment termination benefits agreement. See item (4) on previous page. The Company’s
   management excludes these costs when evaluating its ongoing performance and/or predicting its earnings trends and therefore excludes
   these charges on our adjusted operating results.
   (E) Deferred tax expense represents the non-cash tax expense included in the GAAP tax provision, including the current period utilization
   of deferred tax assets created in previous periods. The remaining provision for income taxes represents expected cash taxes to be paid.
   (F) EBITDA represents earnings before interest, taxes, depreciation and amortization. Adjusted EBITDA adds back stock-based
   compensation charges and non-recurring litigation expenses.                                                                                     26
Executive Management Team

                               David Wagner                                                                     Dave Rockvam

                       President & Chief Executive Officer                                                     Chief Financial Officer

David Wagner joined Zix as President and Chief Executive Officer in January       Dave Rockvam joined Zix as Vice President and Chief Financial Officer in
2016. He is a member of Zix's Board of Directors. Prior to Zix, David held        June 2016. Dave brings a wealth of experience in the data security market and
leadership roles at Entrust for 20 years. Most recently David served as           more than 20 years of experience in investor relations, financial planning, and
President of Entrust from 2013 through 2015, where he led the successful          business and corporate development. Prior to his role at Zix, Dave served in
integration of Entrust after its acquisition by Datacard. David delivered         several executive roles during 18 years with Entrust, including Chief Investor
revenue growth and led the re-investment strategy to move Entrust solutions       Relations Officer and CFO of Asia Digital Media, an Entrust joint venture. He
to the cloud. He also served as Chief Financial Officer of Entrust from 2003 to   also held executive roles at Entrust such as General Manager of Entrust
2013. Before joining Entrust, David held various finance and accounting           Certificate Services, Chief Marketing Officer, and SVP of Product Marketing.
positions at Nortel Networks and at Raytheon Systems. He is a graduate of         Dave began his career at Nortel Networks, where he served in various
The Pennsylvania State University where he received an undergraduate              financial leadership positions. He earned a master of business administration
degree in accounting and a master’s of business administration.                   from The University of Texas at Dallas and an undergraduate degree from
                                                                                  Texas Tech University.

                                                                                                                                           NASDAQ: ZIXI       27
You can also read