A new method to select demulsifiers and optimize dosage at wet crude oil separation facilities
←
→
Page content transcription
If your browser does not render page correctly, please read the page content below

Oil & Gas Science and Technology – Rev. IFP Energies nouvelles 76, 19 (2021)                                                  Available online at:
Ó G. Raynel et al., published by IFP Energies nouvelles, 2021                                                             ogst.ifpenergiesnouvelles.fr
https://doi.org/10.2516/ogst/2020096

 REGULAR ARTICLE

A new method to select demulsifiers and optimize dosage
at wet crude oil separation facilities
Guillaume Raynel*, Debora Salomon Marques, Sajjad Al-Khabaz, Mohammad Al-Thabet, and Lanre Oshinowo

Saudi Aramco, Research and Development Center, 31311, Dhahran, Saudi Arabia

            Received: 25 October 2020 / Accepted: 9 December 2020

            Abstract. The current practice for crude oil demulsifier selection consists of pre-screening of the best
            performing demulsifiers followed by field trials to determine the optimum demulsifier dosage. The method of
            choice for demulsifier ranking is the bottle test. As there is no standard bottle test method, there are different
            methodologies reported in the literature. In this work, a new approach to bottle test and field trial was
            described which improved significantly the selection and dosage of the demulsifier. The bottle test was
            optimized by measuring an accurate mass of demulsifier. This method produces repeatable results. This
            bottle-test methodology was benchmarked against field trial results performed in oil processing plants. The field
            trials were also improved to avoid the accumulation effect of demulsifier, when optimizing their dosage. The
            field data for the optimization of demulsifier dosage was analyzed mathematically; and a graphical method
            to determine the optimum range is described.

1 Introduction                                                                  The stabilization of crude oil emulsions is believed to be
                                                                            dependent on the asphaltene solubility in the oil, the
Crude oil is typically extracted with dispersed water in                    asphaltene-to-resin ratio, the pH and the degree of polarity
varying concentrations. The Water-in-Oil (W/O) emulsions                    of the asphaltenes and resins [11]. The composition of crude
are believed to be initially formed during the migration of                 oils can vary greatly from one producing field to another,
oil and water through the porous reservoir rocks to the                     resulting in different combinations of these parameters with
production wells [1] and subsequent transport to production                 unique effects. In some particularly tight oil emulsions,
facilities for phase separation. Pressure drop across choke                 water cannot be separated solely by physical methods, such
valves at production headers used to manage production                      as, retention, heating and electrocoalescence [12]. In such
flows creates significant agitation and turbulent energy                      cases, a combination of physical and chemical methods is
further emulsifying the water and oil [2, 3]. The dispersed                 required to achieve the desired water separation. Zolfaghari
water droplets are stabilized by surface active compounds                   et al. [4] published a comprehensive review of different
naturally present in the oil such as resins, asphaltenes, solid             demulsification methods and mechanisms of demulsifier
particles, organic acids and bases [4, 5]. These surfactants                action.
migrate to the oil–water interface forming a film around                         For decades, demulsifiers have been designed to break
the water droplets slowing the natural process of coales-                   crude oil–water emulsions. The proper demulsifier selection
cence between droplets [4–8]. The film significantly influ-                    is essential to crude oil production. The demulsifier dosage
ences whether the emulsion separates easily (loose                          affects directly the crude oil quality exiting the production
emulsion) or will not separate spontaneously (tight emul-                   facility to the refinery or export [13]. No single demulsifier
sion) [8, 9]. Tight emulsions require great investment by                   can break all crude oil emulsions with the same water
the oil companies in processes and chemical intervention                    separation performance due to the vast crude oil and water
to separate, or break, the emulsion [2] to produce crude                    compositional differences. Demulsifiers are formulated from
oil within export specifications, required by the recipient                  various polymers, such as alkoxylated phenolic resins, to
(i.e. other producers, transporters or refiners). These                      specifically address two factors: water separation efficiency,
requirements are usually of less than 0.5 v/v% in Basic                     and the separation rate. The separation efficiency is the
Sediment and Water (BS&W); and less than 10 lbs. of total                   amount of water removed from the emulsion. The separa-
dissolved salts Per Thousand Barrels (PTB) of oil [10].                     tion rate is the speed at which the emulsion resolves in
                                                                            two phases, oil and water. For a specific production facility,
* Corresponding author: guillaume.raynel@aramco.com                         the demulsifier can be selected based on the residence time
This is an Open Access article distributed under the terms of the Creative Commons Attribution License (https://creativecommons.org/licenses/by/4.0),
              which permits unrestricted use, distribution, and reproduction in any medium, provided the original work is properly cited.
2                G. Raynel et al.: Oil & Gas Science and Technology – Rev. IFP Energies nouvelles 76, 19 (2021)

in each separation vessel and desired water removal, or
water dropout, from the different separation vessels [12, 14].
    The bottle test is the traditional method used to assess
oil emulsion stability [2, 12, 13, 15]. The bottle test is a sim-
ple assessment of the rate of emulsion separation by visual
observation of the separated volume of water with time.
The bottle test does not take into consideration the “live”
production stream pressure or the geometric and flow
conditions in the separation vessels. Many authors have
published experimental protocols used to perform bottle             Fig. 1. Two 100-mL centrifuge tubes used for bottle testing.
tests [12, 14]. The bottle test is used to select an effective
demulsifier. Following the bottle test demulsifier screening
to select a short-list of trial candidates, a final demulsifier       Table 1. 100-mL KIMBLE centrifuge tube graduation
selection is made following field trials of the short-listed         scales.
demulsifiers at a large scale in the actual production facili-
ties. Bottle tests have an important role selecting the best        Graduations (mL)                                  Scale (mL)
demulsifier formulations to reduce the time and cost of field         0–1                                                  0.05
trials.                                                             1–3                                                   0.1
    In this paper, the demulsifier selection for a Saudi
Arabian oil production facility based on bottle testing and         3–6                                                   0.2
field trials is described. The limitations of the bottle test        6–10                                                  0.5
are described and a set of best practices to improve the            10–100                                                 1
reliability of the results are recommended. The data
generated during field trials by the production facility is
analyzed to identify an important effect of the sequence of
demulsifier dosages. Finally, a mathematical formula of              (Sigma Aldrich), methanol (Sigma Aldrich), chloroform
the demulsifier performance is used to determine the opti-           (Sigma Aldrich), acetone (Sigma Aldrich), and silica gel
mum demulsifier dosage.                                              (Sigma Aldrich) were used without further purification.
                                                                    The Arab medium crude oil is composed of 30 wt%
                                                                    Saturated hydrocarbons, 34 wt% Aromatics, 11 wt% Resins
                                                                    (NSO), and 25 wt% Asphaltenes. The wet crude oil emulsion
2 Materials and methods                                             is highly stable up to a high temperature of 80 °C. The water
                                                                    droplets preferably sediment, as opposed to coalesce. This
A precision balance (PRECISA XT220A-FR) with a closed               sedimentation forms a sludge at the bottom of the container,
glass-cover was used to weigh the demulsifier with an accu-          which was difficult to re-homogenize after a week. The water
racy of one tenth of milligram. Figure 1 shows a picture of         cut of this emulsion was 24 vol%.
100-mL glass centrifuge tubes from KIMBLE (KIMAX
28-410) used in the bottle test with dissimilar graduated
scales, as described in Table 1. The tubes have a screwcap          3 Experimental
with a PTFE liner to reduce the loss of light hydrocarbon
components during the experiment. The crude oil specific             3.1 Bottle test improvements
gravity was measured at 15.56 °C (60 °F) using a density
meter with an oscillating U-tube (DMA 5000M ANTON                   The bottle test technique is used for selecting demulsifiers
PAAR), as described in ASTM D4052-18a [16]. The API                 at the production facility by measuring the water separa-
gravity is calculated from the measured specific gravity.            tion performance on crude oil emulsions [12]. Extensive
The Arabian medium crude oil used in this study has an              studies in the past have shown that this experimental
API gravity of 28.8°. A thermostatic oven (Lindberg/Blue            method is affected by various physical and chemical param-
M Laboratory Gravity Oven Model GO1330A) was used                   eters: salinity [17–19], pH [20, 21], wall and boycott effect
to maintain a sample temperature of 30 °C during the                [22], temperature [17, 21], ageing [23], shaking/mixing
bottle test.                                                        [2, 24] and diluent [24, 25]. The procedure used in this work
     A Saturate, Aromatic, Resin and Asphaltene (SARA)              has similarities and differences to procedures reported in the
analysis was performed. The quantity of asphaltene                  literature and is listed in bold text in Table 2.
was determined by precipitation with 30 volumes of cold                 The following improvements in the methodology of the
n-pentane (3 °C). The composition of the de-asphaltenated           bottle test experiment were established in this study:
filtrate was obtained by open column chromatography on a
silica gel column sequentially eluted with n-pentane, a 50:50         Chemical integrity of the sample
mixture of n-pentane and dichloromethane, and a 15:15:70
mixture of methanol, acetone and chloroform to isolate               All bottle tests were performed in glass centrifuge tubes
saturated hydrocarbons, aromatics and non-asphaltenic                with a screwcap to avoid the loss of light components,
polar compounds – Nitrogen, Sulfur and Oxygen (NSO)                  like pentanes and hexanes, from the wet crude oil emul-
compounds. Dichloromethane (Sigma Aldrich), n-pentane                sion. These volatile compounds affect the bulk viscosity
G. Raynel et al.: Oil & Gas Science and Technology – Rev. IFP Energies nouvelles 76, 19 (2021)            3

Table 2. Differences between bottle test techniques.
Parameter                                                                                              Reference
Bottle test tube                        Tube material
                                               Glass                                    [12, 17–19, 21, 23] and this work
                                               Plastic                                                  [25]
                                        Jar (bottle)                                                    [24]

Demulsifier addition                     Dilution
                                               Distilled water                                      [17–19, 25]
                                               Organic solvents                                       [12, 21]
                                        Volume                                                          [24]
                                        Mass                                                        This work

Mixing method                           Table shaker                                               [12, 17, 21, 24]
                                        Homogenizer                                              [18, 20, 21, 23, 25]
                                        Hand shaker                                             [19] and this work
Emulsion                                Fresh (from process)                                  [12, 24] and this work
                                        Synthetic (made at the lab)                              [17, 19–21, 23, 25]
Temperature control                     Thermostatic bath                                          [12, 17, 23, 24]
                                        Thermostatic oven                                       [21] and this work
                                        Room temperature                                             [19, 20, 25]
Data processing                         Error                                                   [21] and this work
                                        Correction                                                   This work

 of the wet crude oil emulsion directly influencing the            displacement of the liquid by the vapor (mixture of air
 bottle test repeatability [12]. To ensure the chemical           and light components from the emulsion) constituting
 integrity of the crude oil emulsion, no other chemicals,         the head space inside the vial. In other words, the sample
 such as salts, solvents, acids or bases, were added to           bottles were rotated manually (2 s per cycle) for 10 s.
 the sample.                                                      This step can also be performed using a vertical rotating
                                                                  mixer.
  Ageing of the crude oil emulsion and demulsifier
                                                                   Temperature of bottle test
 Ageing of the crude oil emulsion significantly increases
 the viscosity due to a loss of the light hydrocarbons            The temperature source was kept low at 30 °C to reduce
 (e.-g., hexane, heptane, and pentane) and the partial            coalescence and accentuate the demulsifier effect on
 oxidation of aromatics (e.g., phenol and cumene) and             water separation. At higher temperatures, the slopes of
 sulfur-containing molecules. This has a substantial effect       the coalescence curves are greater leading to increase
 on the bottle test repeatability [23]. All crude oil emul-       ambiguity in the interpretation of the bottle-test results
 sion samples in this work were used within three days            for different conditions.
 of sampling from the production facility. Demulsifier
 ageing was also shown to affect bottle test repeatability         Mass of demulsifier
 again due to the loss of light components in the demul-
 sifier, such as methanol and light naphtha. Therefore,            The demulsifier dosage was measured by mass rather
 the demulsifiers in this study were used within one               than by volume. The measurement of mass is more accu-
 month of production.                                             rate than volume at the dosages required and is indepen-
                                                                  dent of temperature, density, vapor pressure, surface
  Mixing of crude oil emulsion and demulsifier                    tension and viscosity of the demulsifier [26, 27].

 Different methods to mix the demulsifier with the crude            Repeatability of the bottle test
 oil emulsion were tested. The mixing required to incor-
 porate the demulsifying agent cannot be too vigorous             The repeatability of the bottle test was assessed by
 as the agitation may shear the emulsion and stabilize            repeating the experiment two times. If the data points
 the emulsion. On the other hand, if the mixing is insuf-         constituting each water separation curve was within
 ficient, little water separation will be obtained. The            the established level of confidence (97.5%), the run was
 most reliable homogenization technique was by stirring           validated as acceptable. If not, the experiment was
 the demulsifier in the crude oil emulsion using the               discarded and repeated.
4                G. Raynel et al.: Oil & Gas Science and Technology – Rev. IFP Energies nouvelles 76, 19 (2021)

     Correction of the free water separated based on             is flushed for 10 min and a 1-L container is filled with the
      demulsifier dosage                                           emulsion sample. The demulsifier is injected in the wet
                                                                  crude oil stream downstream of the production header at
    When the precise demulsifier mass to achieve the target        the entrance to the production facility. The wet crude oil
    demulsifier dosage is not applied to the emulsion sample,      stream enters a three-phase separator (Vessel 1) where
    and if the range of the resulting dosage is within            gas, free water and crude oil are separated. The wet crude
    +5 ppmw of the target dosage, the volume of free water        oil is heated in a heat exchanger and following a further
    separated V SD
                 e   is corrected for the applied dosage.         decrease in pressure enters a second three-phase separator
    Within this small dosage range, the volume of water           (Vessel 2). All separated gas and water are sent to gas
    separated from the emulsion increases linearly with the       and water gathering facilities.
    demulsifier dosage. This correction accounts for the                The residence time of the crude oil stream through each
    effect of demulsifier dosage variation on the demulsifier       section of the facility is noted in Figure 2. The residence
    water separation performance. Hence, the volume of free       time is important for consideration in the interpretation
    water separated V SD
                       c  from the bottle tests is corrected      of bottle test results. The bottle test is a time-dependent
    as:                                                           batch experiment applied to the continuous process shown
                                                                  in Figure 2, where the residence time for the wet crude oil in
                                                                  the separation vessels is considered in the analysis of the
                              m SD                                test results. The main criterion for ranking demulsifiers in
                        c ¼
                      V SD          V SD
                                       e ;
                               m                                  this work is the amount of water separated (water dropout)
                                                                  during the first 15 min of the bottle test experiment. This
where mSD and m are the mass for the specified dosage              period of time corresponds approximately to the residence
and the mass added to the specific emulsion sample,                time of the wet crude oil from the demulsifier injection point
respectively.                                                     to the outlet of Vessel 1. The period between 15 min and
                                                                  60 min corresponds to the residence time from the outlet
3.2 Bottle test procedure                                         of Vessel 1 to the Vessel 2 outlet which is also of interest.
                                                                  The ranking of the demulsifier was not affected by the tem-
Arab Medium crude oil emulsions were sampled from the             perature difference between the bottle tests and the field
production header of the production facility, upstream of         trial. The field trials are sensitive to large variations in
chemical addition. The bottle tests were conducted within         the process parameters. The field trials should be performed
three days of sampling. The crude oil emulsion was                sequentially with little changes in temperature, wash water
re-homogenized by rotating the 1-L container five times,           rate, interface and liquid levels to limit their impact on the
end-over-end for 3 s each cycle. The crude oil emulsion           dewatering. The diurnal temperature variation of the crude
was added to six 100-mL glass tubes (See Fig. 1), at room         oil emulsion entering the Vessel 1 was 35 ± 5 °C. The crude
temperature. The liquid level of emulsion in each tube            oil emulsion is heated to 46 ± 2 °C before entering the
was 100 mL. Each demulsifier was properly mixed prior              Vessel 2 (Fig. 2) and water separation mostly occurred in
to dosing measurement. No solvent or diluent was added            the Vessel 2, the effect of process temperature on the demul-
to the demulsifier. A 1-mL disposable plastic syringe was          sifiers was minimal during the field trials. Flowmeters are
used to take approximately 0.2 mL of the demulsifier.              key instruments during demulsifier field trial to measure
The mass of the syringe with demulsifier was recorded.             and monitor the addition of demulsifier (Fd in Fig. 2) and
The demulsifier was dispensed to the 100-mL tube contain-          the water separated from the separator vessels (F1, F2
ing the crude oil emulsion and the mass of the syringe was        and FD in Fig. 2). Flow rate measurements in the field
then measured using the balance. The difference in the syr-       are by orifice differential pressure flowmeters. Flowmeter
inge mass before and after dispensing the demulsifier gives        reliability is a key variable in the field test and the orifice
an accurate measurement of the demulsifier mass (mSD)              plate flow meter is robust, has good accuracy and is easy
dispensed to the emulsion. A demulsifier concentration of          to maintain. The demulsifiers tested were injected upstream
50 ppm was added to five tubes. The sixth was used as ref-         of Vessel 1. Additionally, the incumbent demulsifier was
erence. The mixing of the demulsifier with the emulsion was        injected at the dehydrator inlet to minimize production
performed manually by rotating the tube, five times, end-          upsets caused by poor separation. The fractional water sep-
over-end for 2 s each cycle. Each tube was adjusted into a        aration from the three multiphase separators (see Fig. 2) is
straight vertical position in a tube rack and placed in a ther-   a primary quantification of the water separation perfor-
mostatic oven at 30 °C. The amount of free water separated        mance or demulsifier efficiency. Although the production
was measured every 20 min. The viscosity of these mixtures        facility process and instruments vary, the field trial proce-
was not measured.                                                 dure remains the same.
                                                                       The initial demulsifier dosage is 5 vol% greater than the
3.3 Field-trial procedure for demulsifier selection                incumbent dosage. The first dosage of the tested demulsifier
                                                                  is maintained for at least one day to ensure that no traces of
A schematic of the wet crude oil handling section of a pro-       the previous demulsifier remain in the process. The demul-
duction facility is shown in Figure 2. Emulsion samples for       sifier dosage is subsequently decreased in steps of 10 ppm
the study were collected from crude oil sampling points           starting from the initial dosage of the course of several days.
upstream of the demulsifier injection. The sampling port           This procedure continues until a dehydrator upset occurs.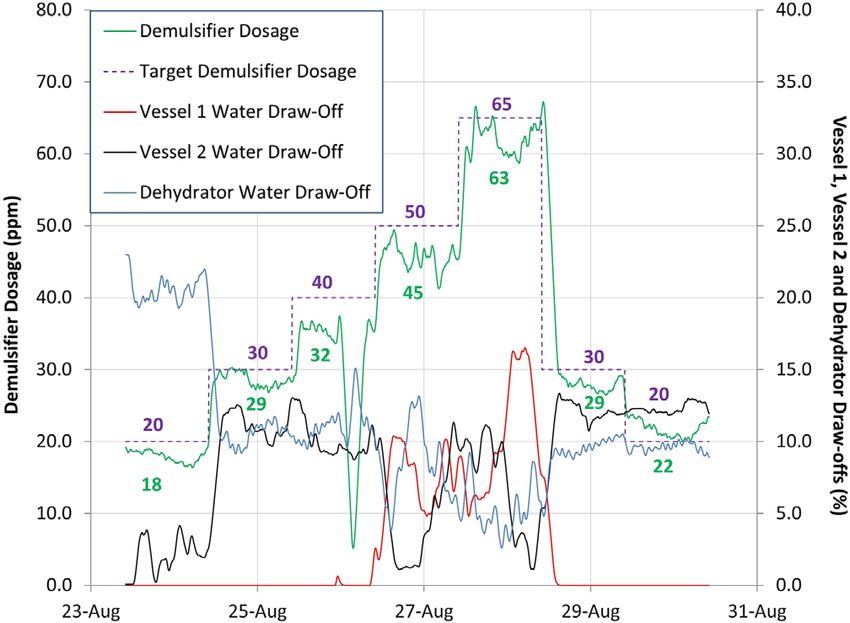
G. Raynel et al.: Oil & Gas Science and Technology – Rev. IFP Energies nouvelles 76, 19 (2021)                5

Fig. 2. Schematic of the wet crude oil handling section of the production facility.

The dehydrator upset occurs when there is rapid change in           4.2.1 Demulsifier B (incumbent demulsifier) field trial
the dehydrator grid voltage caused by an increase in
conductivity due to poor water separation. The demulsifier           The Demulsifier B dosage (incumbent demulsifier) and the
dosage is increased slightly above the dosage that caused           percentage of water draw-off from Vessel 2 and the
dehydrator upset. At the end of the field trial, the water           Dehydrator during the field trial are plotted in Figure 4.
separation efficiency, the percentage of the total water             No significant water separation was observed in Vessel 1
separated from Vessel 1, F1/(F1 + F2 + FD), and Vessel 2,           during the field trial. The water draw-off is calculated as:
F2/(F1 + F2 + FD), is calculated as a function of demulsifier         % Water draw  off ¼
dosage.
                                                                             Flowrate of water separated from a vessel
                                                                                                                           :
                                                                            Total inlet flowrate of wet crude oil emulsion
4 Results and discussion
                                                                    Figure 4 shows that the time-varying profile of the Vessel 2
4.1 Bottle test results
                                                                    draw-off remains relatively constant as the demulsifier
Four demulsifiers were tested for their water separation per-        dosage is decreased in decrements of 10 ppm. A large drop
formance at 30 °C using the methodology for bottle-test             in draw-off occurs from the 30 ppm to 25 ppm target
experiments described in the previous section. Figure 3             dosage. The target dosage is the dosage inputted by the
shows the water separation performance as the percentage            operator. The water draw-off from the downstream
of water separated with time of the four demulsifiers at a           dehydrator vessel increases as a consequence. Table 3 lists
dosage of 50 ppmw. The error bars on Figure 3 represent             the target and actual demulsifier dosage and the average
the range of interface level measurements in each bottle-test       water draw-off from Vessel 2 during the field trial of
experiment and on average was ±1.25%. Demulsifiers A                 Demulsifier B.
and C show the highest water separation after 60 min                    Figure 4 and Table 3 also show that the demulsifier
and were selected for field-testing along with the incum-            target dosage can differ from the actual dosage during oper-
bent demulsifier (Demulsifier B). The water quality from              ation because of the process dynamics. The actual dosage is
all four demulsifiers was qualitatively excellent with no oil        the dosage recorded by a calibrated flowmeter.
droplets on the bottle/tube wall and clear water with no                There is little change in the average water draw-off from
coloration.                                                         Vessel 2 when decreasing the demulsifier dosage from
                                                                    50 ppm to 30 ppm. It is likely that there is a residual
4.2 Field-trial optimization of demulsifier dosage                   accumulation of the demulsifier in the process following
                                                                    the relatively high 50 ppm dosage. The field trial protocol
The demulsifier dosage was varied during the field trial to           improved for subsequent field trials by changing the dosing
observe the demulsifier dosage effect on the water                   procedure from decreasing the dosage to increasing the
separation.                                                         dosage so that the effect of residual demulsifier accumulation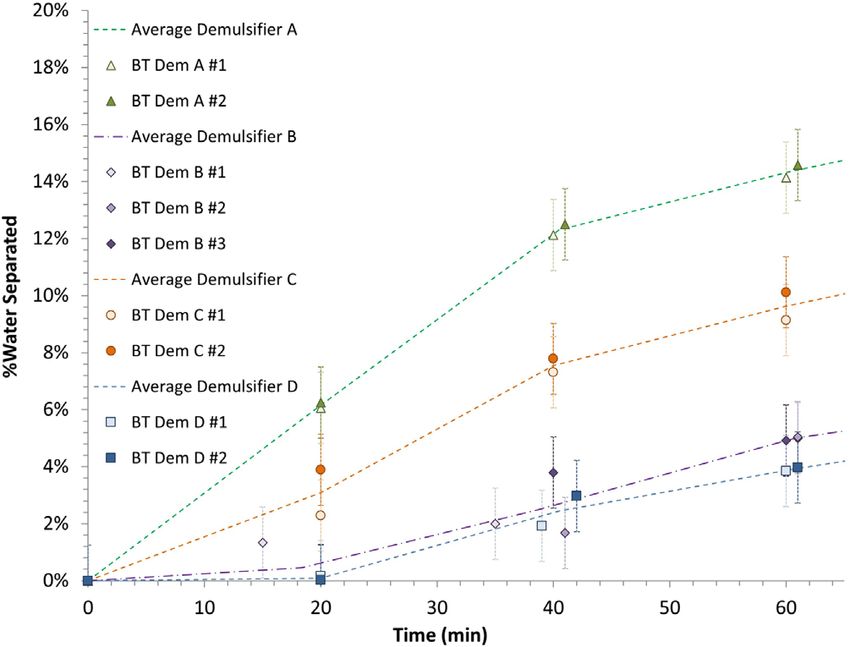
6               G. Raynel et al.: Oil & Gas Science and Technology – Rev. IFP Energies nouvelles 76, 19 (2021)

                                                                 Table 3. Average water draw-off for different dosages of
                                                                 Demulsifier B.
                                                                 Time               Target           Actual        Average
                                                                                  demulsifier       demulsifier        water
                                                                                    dosage           dosage        draw-off
                                                                                    (ppm)            (ppm)           from
                                                                                                                  Vessel 2 (%)
                                                                 17-May 3:30            9            11   ±   2         0
                                                                 17-May 16:00          50            45   ±   4        15
                                                                 19-May                40            37   ±   3        15
                                                                 20-May                30            36   ±   2        14
                                                                 21-May                25            29   ±   6         6
                                                                 24-May                35            28   ±   4         6

Fig. 3. Water separation performance of four demulsifiers at      bottle-test results is also likely due to a change in composi-
30 °C (dosage of 50 ppmw).
                                                                 tion with time of Demulsifier B caused by evaporation of
                                                                 the demulsifier solvents. Figure 5 shows the lack of
                                                                 homogeneity in the Demulsifier B sample with a layer of a
                                                                 white solid at the container bottom and a dark brown layer
                                                                 on the top. Demulsifiers A and C were a homogenous dark
                                                                 orange solution. Bottle tests performed with Demulsifier B
                                                                 extracted from below the surface, and from the middle of
                                                                 the sample bottle gave different amounts of water
                                                                 separation.

                                                                 4.2.2 Demulsifier C field trial
                                                                 A new procedure was developed to prevent the accumula-
                                                                 tion of residual demulsifier following a step-change in
                                                                 dosage. The initial demulsifier dosage is 20 ppm. The
                                                                 dosage is incremented by 10 ppm daily. After the original
                                                                 incumbent dosage plus 5 % is reached, the dosage is reduced
                                                                 stepwise to 30 ppm and then to 20 ppm. The Demulsifier C
                                                                 field trial was performed using this improved field-trial
                                                                 procedure.
Fig. 4. Demulsifier target dosage and percentage of water draw-       Figure 6 shows the water draw-off and demulsifier
off from Vessel 2 and the dehydrator during the field trial of    dosage during the field trial. The average quantities are
Demulsifier B.                                                    summarized in Table 5. At a low dosage of 17–26 ppm,
                                                                 there is approximately 1% water separation from the
                                                                 Vessel 2. When the demulsifier dosage is increased to
is eliminated. In Table 4, the average water draw-off from       34 ppm, the water draw-off increases to 5%.
Vessel 2 is shown whereby the water draw-off is averaged             Referring to Table 5, a dosage of 42 ppm and 58 ppm,
during a period of relatively constant or steady water           produced water draw-off of 9% and 11%, respectively. No
draw-off from the dehydrator. The average water draw-off         significant water separation was observed in Vessel 1 during
reached 14% in Vessel 2 for an average demulsifier concen-        the entire period of this field trial. When the demulsifier
tration of 36 ppm. For a dosage of 45 ppm, little improve-       dosage was decreased from 58 ppm to 26 ppm, a significant
ment in water separation is observed. The Demulsifier B           accumulation effect is observed on the water drop-off, as
bottle test showed approximately 5 vol% water separated          shown by the yellow box in Figure 6. The water draw-off
with 50 ppm of demulsifier after 60 min. This result is com-      slowly decreases following the step change in demulsifier
pared with the average water draw-off of 16 vol% from            rate illustrating the demulsifier accumulation effect. There
Vessel 2 at a 45 ppm dosage of Demulsifier B. The bottle-test     is a substantial residual concentration of demulsifier present
water separation performance of Demulsifier B is signifi-          in the process. In the separator vessels, the residence time is
cantly lower than the field-trial water separation perfor-        distributed over a wide range. The circulation patterns in
mance. It is well known that vessel hydrodynamics and the        Vessel 1 are known to promote short circuiting from the
presence of light components generally lead to a lower           inlet to the outlet but also present a long tail in the
demulsifier dosage in field trials as compared to bottle           residence time distribution. This distribution is likely the
tests. However, the discrepancy between the field-trial and       reason for the under-damped response in the Vessel 2 water
G. Raynel et al.: Oil & Gas Science and Technology – Rev. IFP Energies nouvelles 76, 19 (2021) 7
Table 4. Average water draw-off for different dosages of Demulsifier B.
Time Actual demulsifier Average water draw-off
dosage (ppm) from Vessel 2 (%)
17-May 03:30 – 17-May 14:10 11 ± 2 0
18-May 00:00 – 19-May 11:10 45 ± 4 16
19-May 23:50 – 20-May 02:20 37 ± 3 15
20-May 21:50 – 21-May 10:40 36 ± 2 15
24-May 13:00 – 25-May 12:20 25 ± 2 5
Fig. 5. Picture of Demulsifier B showing a white precipitate
(right) and Demulsifier A showing a clear solution (left).
Fig. 6. Demulsifier dosage and percentage of water draw-off
draw-off. Holding the demulsifier dosage constant for a per- from Vessel 2 and the Dehydrator during the field trial of
iod of 2 or more days would see the water draw-off stabilize. Demulsifier C. The yellow region identifies the demulsifier
accumulation effect.
This is not desirable as the production facility would prefer
to compress the demulsifier testing into the shortest period
allowable. The average of water drained from Vessel 2 was
adjusted to correct the accumulation effect of the system by field trial and described in the previous section. Figure 7
identifying area of process stability. The accumulation shows the water draw-off and demulsifier dosage during
effect wasn’t observed, when the demulsifier dosage was the field trial. The average quantities are summarized in
increased. The average of water drained from the Vessel 2 Table 6.
is 1.5% for an average of 26 ppm (4-May in Tab. 5) and In Table 6, there is approximately 2% water separation
1% for an average of 18 ppm (5-May in Tab. 5), which observed in Vessel 2 at a low demulsifier dosage of 18 ppm.
correlates well with value at the beginning of the field trial: When the demulsifier dosage is increased to 29–32 ppm, the
1% for an average of 26 ppm (29-Apr in Tab. 5) and 1% for water separation increases significantly to approximately
an average of 17 ppm (27-Apr in Tab. 5). 10–11%. A small water separation of 8% water draw-off
The Demulsifier C bottle test results (see Fig. 3) are in was observed in Vessel 1 at a demulsifier dosage of
good agreement with the field trial. In the bottle test, 45 ppm. The total water draw-off from Vessel 1 and Vessel 2
approximately 10 vol% water was separated with 50 ppm increased to 13%. When the demulsifier dosage is increased
of demulsifier after 60 min. In the field trial, the water to 63 ppm, the water separation performance increased
draw-off from Vessel 2 was 9–11 vol% for 42 and 58 ppm even further to 16% total water separated from Vessel 1
dosage of Demulsifier C, respectively. and Vessel 2, significantly decreasing the load on the dehy-
Future demulsifier field trials must be conducted with drator. The accumulation effect wasn’t observed, when the
demulsifier dosage increments rather than dosage decre- demulsifier dosage was increased. When the dosage was
ments to prevent false results from the delayed change in reduced from 63 ppm to 29 ppm and then to 22 ppm, the
demulsifier concentration due to accumulation in the water draw-off remained at a stable level of 12% from the
process. Vessel 2. The demulsifier accumulation effect in the process
was greatest with Demulsifier A, compared to demulsifiers B
4.2.3 Demulsifier A field trial and C, because the process didn’t stabilize even after 1 day.
For the last two demulsifier dosages of this field trial
The Demulsifier A field trial was performed using the (28-Aug and 29-Aug in Tab. 6), a correction for the accu-
improved field-trial procedure applied in the Demulsifier C mulation effect was not possible as the accumulation effect8 G. Raynel et al.: Oil & Gas Science and Technology – Rev. IFP Energies nouvelles 76, 19 (2021)
Table 5. Average water draw-off for different dosages of Demulsifier C.
Time Target demulsifier Actual demulsifier Average water draw-off
dosage (ppm) dosage (ppm) from Vessel 2 (%)
27-Apr 20 17 ± 3 1
29-Apr 30 26 ± 2 1
30-Apr 40 34 ± 3 5
2-May 50 42 ± 4 9
3-May 65 58 ± 4 11
4-May 30 26 ± 2 7 (corr. 1.5%)a
5-May 20 18 ± 3 3 (corr. 1%)a
a
Average of water drained from Vessel 2 when the accumulation of demulsifier in the process is taken into consideration.
caused water separation only in Vessel 2. Figure 9 also
shows the water drained from both vessels and the total,
using Demulsifier A.
A sigmoid or “S-curve” is commonly used to describe
kinetic curves. The results in Figures 8 and 9 show that a
sigmoid curve is the best suited mathematical description
for the effect of demulsifier dosage. The sigmoid is described
in three phases: a lag phase, a growth phase and a final
equilibrium phase or plateau [28, 29]. The lag phase is a
period of low water separation caused by a concentration
of demulsifier below the minimum dosage necessary to have
an effective action. The demulsifier concentration is too
low to cause a significant change in water draw-off. The
quantity of demulsifier molecules on water droplets dis-
persed in the crude oil emulsion are insufficient to cause
significant coalescence. The growth phase is the phase in
which the demulsifier effectiveness increases. After the
Fig. 7. Demulsifier dosage and percentage of water draw-off inflexion point, the rate of change of water draw-off deceler-
from Vessel 1, Vessel 2 and the dehydrator during the field trial ates (second derivative) leading to the equilibrium plateau.
of Demulsifier A. The demulsifier action is limited by an excessive concentra-
tion of demulsifier molecules (saturation). It has been
reported that a decrease in separation performance can
was present for the full day between set point changes in the occur as the demulsifier concentration increases due to the
dosage. reverse demulsifier action of stabilizing the emulsion dro-
Similarly to Demulsifier C, the bottle test results for plets [4, 30–32]. This effect is not seen in Figure 8, as the
Demulsifier A were in good agreement with the field trial. water draw-off plateaus to the demulsifier dosages employed
The bottle test gave approximately 14 vol% of water sepa- in the field trials.
ration at a 50 ppm of demulsifier dosage after 60 min, while A mathematical analysis of the third derivative, or jerk,
the field trial had a total water draw-off for Vessels 1 and 2 of the sigmoid curve indicates that there is one minimum at
of 13–16 vol% for 45 and 63 ppm dosage of Demulsifier A, the inflexion point and two maxima, one in the lag phase
respectively. The accumulation effect is shown to have a and one at the end of the growth phase. The maxima of
significant influence on water separation when the demulsi- the jerk are points of interest to the optimization of demul-
fier dosage is decreased during the field trials. sifier dosage. The first maximum corresponds to the point
in which the minimum effective demulsifier dosage is neces-
4.3 Mathematical interpretation of the demulsifier sary to see 1% of water separation. The demulsifier dosage
performance at this point can be graphically determined by the intersec-
tion of the tangent to the growth slope and the value of zero
Figure 8 plots the average water draw-off during the trial as water separation (x-axis). The second maximum of the jerk
a function of the demulsifier dosage and illustrates the defines the limit situations in which any further increase in
demulsifier water separation performance. The demulsifier concentration will not lead to an increase in water separa-
performance of increased water draw-off with increased tion. The demulsifier concentration at this limiting value
demulsifier dosage can be curve-fit with a sigmoidal func- can be graphically determined as the intersection of the
tion. Demulsifier A was the only demulsifier that produced tangent to the plateau (maximum separation) and the
water separation in Vessel 1, while demulsifiers B and C tangent to the slope at the inflection point (maximumG. Raynel et al.: Oil & Gas Science and Technology – Rev. IFP Energies nouvelles 76, 19 (2021) 9
Table 6. Average water draw-off for different dosages of Demulsifier A.
Time started Target Actual Average water Average water Total water
demulsifier demulsifier draw-off from draw-off from draw-off from
dosage (ppm) dosage (ppm) Vessel 1 (%) Vessel 2 (%) Vessel 1 & 2 (%)
23-Aug 20 18 ± 2 0 2 2
24-Aug 30 29 ± 2 0 11 11
25-Aug 40 32 ± 8 0 10 10
26-Aug 50 45 ± 4 8 5 13
27-Aug 65 63 ± 5 9 7 16
28-Aug 30 29 ± 5 0 12 12
29-Aug 20 22 ± 2 0 12 12
Table 7. Minimum and maximum demulsifier dosage of
different demulsifiers tested in this study.
Demulsifier Minimum Maximum
dosage (ppm) dosage (ppm)
Demulsifier A 15 40
Demulsifier A (Vessel 1) 36 45
Demulsifier B 19 34
Demulsifier C 25 44
With the goal of optimizing demulsifier dosage to maxi-
mize water separation, the maximum demulsifier dosage is
determined graphically from Figure 8. For a demulsifier
dosage set point below the minimum demulsifier dosage, lit-
tle or no water separation will occur wasting the demulsifier.
Fig. 8. Average water draw-off as a function of demulsifier The minimum, maximum and most efficient values for
dosage. the tested demulsifiers are summarized in Table 7. This
information may be used to determine the optimum demul-
sifier dosage required to achieve a specific water concentra-
tion at the dehydrator inlet which has a positive economic
benefit to the facility operations.
5 Conclusion
This study develops a strategy to improve the bottle test
and the reliability of the demulsifier evaluation and selec-
tion for dewatering wet crude oil emulsions. The following
conclusions were obtained:
Good agreement between the bottle tests and the field
trials was obtained by improving the commonly prac-
ticed methods with the exception of the inhomoge-
neous demulsifier.
With the following improvements to the bottle test
experimental protocol, a confidence level of 97.5% is
Fig. 9. Combination of water draw-off in Vessel 1 and Vessel 2 achieved in repeatability:
for Demulsifier A. The chemical integrity of the emulsion and demul-
sifier is maintained by not using diluents or add-
efficiency or speed). A simple sigmoidal fit can be employed ing any other chemicals.
for demulsifiers A, B and C on Figure 8, as well as for the The ageing of samples is minimized with three
Vessel 1 for Demulsifier A. This is not the case for Vessel 2 days for the emulsion and one month for the
with Demulsifier A, as shown on Figure 9. demulsifier.10 G. Raynel et al.: Oil & Gas Science and Technology – Rev. IFP Energies nouvelles 76, 19 (2021)
The bottle-test temperature is optimized for properties of the asphaltic constituents of crude oil, Colloids
maximum water separation effect. Surf. A Physicochem. Eng. Asp. 80, 2–3, 237–242.
Demulsifier dosage errors are significantly minimized https://doi.org/10.1016/0927-7757(93)80203-Q.
by measuring the demulsifier mass and by correcting 9 Jones T.J., Neustadter E.L., Whitting K.P. (1978) Water-in-
the separated water volume by multiplying with the crude oil emulsion stability and emulsion destabilization by
ratio of specified dosage mass and the actual mass chemical demulsifiers, J. Can. Pet. Technol. 17, 2, 100–108.
https://doi.org/10.2118/78-02-08.
added to the emulsion sample.
10 Less S., Vilagines R. (2012) The electrocoalescers’ technol-
During the demulsifier field trials the dosage is
ogy: Advances, strengths and limitations for crude oil
increased and not decreased to avoid the demulsifier separation, J. Pet. Sci. Eng. 81, 57–63. https://doi.org/
accumulation effect when changing from higher to 10.1016/j.petrol.2011.12.003.
lower dosage as shown from the data. 11 McLean J.D., Kilpatrick P.K. (1997) Effects of asphaltene
A mathematical model was used to describe the solvency on stability of water-in-crude-oil emulsions,
demulsifier water separation performance. A simple J. Colloid Interface Sci. 189, 2, 242–253. https://doi.org/
method to determine the optimal demulsifier range 10.1006/jcis.1997.4807.
was established using graphical analysis. 12 Manning F.S., Thompson R.E. (1995) Dehydration of crude
The application of the improved field-trial methodol- oil, in: Oilfield processing volume two: Crude oil, Penn Well
ogy may be used to determine the optimal demulsifier Corporation, Tulsa, Oklahoma, pp. 113–143. ISBN 13:
dosage to achieve a desired water concentration in the 9780878143542.
wet crude oil to the dehydrator inlet. 13 Kokal S.L. (2005) Crude oil emulsions: A state-of-the-art
review, SPE Prod. Facil. 20, 1, 5–13. https://doi.org/
10.2118/77497-PA.
Acknowledgments. This work is the result of a collaboration 14 Graham D.E., Stockwell A. (1980) Selection of demulsifiers
between the Saudi Aramco Research & Development Center for produced crude oil emulsions, SPE, 453–458. https://doi.
and the Northern Area Oil Operations. The authors would like org/10.2118/191-1980-MS.
to acknowledge Dr. Regis Vilagines and Dr. Simone Less for 15 Goldszal A., Bourrel M. (2000) Demulsification of crude oil
their support; and would like to especially thank, Ellyes Mecikar, emulsions: Correlation to microemulsion phase behavior, Ind.
for his support and his valuable contributions to the progress Eng. Chem. Res. 39, 8, 2746–2751. https://doi.org/10.1021/
of this work. The authors would also like to thank ie990922e.
Mr. Philip Embleton for his support in reviewing the manuscript 16 ASTM Standard D4052-18a (2019) Standard test method for
for submission. density, relative density, and API gravity of liquids by digital
density meter, ASTM International, West Conshohocken,
PA, USA. https://doi.org/10.1520/D4052-18A.
References 17 Zargar G., Gheysari R.G., Takassi M.A., Rostami A.,
Zadehnazari A. (2018) Evaluation of a sulfanilic acid based
1 Sjöblom J., Aske N., Auflem I.H., Brandal Ø., Havre T.E., surfactant in crude oil demulsification: an experimental
Sæther Ø., Westvik A., Johnsen E.E., Kallevik H. (2003) Our study, Oil Gas Sci. Technol. – Rev IFP Energies nouvelles
current understanding of water-in-crude oil emulsions: 73, 20. https://doi.org/10.2516/ogst/2018016.
Recent characterization techniques and high pressure per- 18 Wang X., Alvarado V. (2012) Effects of aqueous-phase
formance, Adv. Colloid Interface Sci. 100, 399–473. salinity on water-in-crude oil emulsion stability, J. Dispers.
https://doi.org/10.1016/S0001-8686(02)00066-0. Sci. Technol. 33, 165–170. https://doi.org/10.1080/
2 Harr J.D. (1969) Field approach to crude oil demulsification, 01932691.2010.548689.
SPE, 1–9. https://www.onepetro.org/general/SPE-2694-MS. 19 Borges B., Rondon M., Sereno O., Asuaje J. (2009) Breaking
3 Thompson D.G., Taylor A.S., Graham D.E. (1985) Emulsi- of water-in-crude-oil emulsions. 3. Influence of salinity and
fication and demulsification related to crude oil production, water-oil ratio on demulsifier action, Energy Fuels 23, 1568–
Colloids Surf. 15, 175–189. https://doi.org/10.1016/0166- 1574. https://doi.org/10.1021/ef8008822.
6622(85)80070-6. 20 Silva I., Borges B., Blanco R., Rondon M., Salager J.-L.,
4 Zolfaghari R., Fakhru’l-Razi A., Abdullah L.C., Elnashaie S. Pereira J.C. (2014) Breaking of water-in-crude oil emulsions.
S.E.H., Pendashteh A. (2016) Demulsification techniques of 5. Effect of acid-alkaline additives on the performance of
water-in-oil and oil-in-water emulsions in petroleum indus- chemical demulsifiers, Energy Fuels 28, 6, 3587–3593.
try, Sep. Sci. Technol. 170, 377–407. https://doi.org/ https://doi.org/10.1021/ef5006918.
10.1016/j.seppur.2016.06.026. 21 Hajivand P., Vaziri A. (2015) Optimization of demulsifier
5 Kilpatrick P.K. (2012) Water-in-crude oil emulsion stabi- formulation for separation of water from crude oil emulsions,
lization: Review and unanswered questions, Energy Fuels 26, Braz. J. Chem. Eng. 32, 1, 107–118. https://doi.org/
7, 4017–4026. https://doi.org/10.1021/ef3003262. 10.1590/0104-6632.20150321s00002755.
6 Kumar K., Nikolov A.D., Wasan D.T. (2001) Mechanisms of 22 Acrivos A., Herbolzheimer E. (1979) Enhanced sedimenta-
stabilization of water-in-crude oil emulsions, Ind. Eng. Chem. tion in settling tanks with inclined walls, J. Fluid Mech. 92,
Res. 40, 14, 3009–3014. https://doi.org/10.1021/ie000663p. 3, 435–457. https://doi.org/10.1017/S0022112079000720.
7 Bowman R.W., Burton W.D., Pryor J.A. (1977) Statistically 23 Filho D.C.M., Ramalho J.B.V.S., Spinelli L.S., Lucas E.F.
designed oil dehydration tests, in: California Regional (2012) Aging of water-in-crude oil emulsions: Effect on water
Meeting, Bakersfield, California. content, droplet size distribution, dynamic viscosity and
8 Mohammed R.A., Bailey A.I., Luckham P.F., Taylor S.E. stability, Colloids Surf. A Physicochem. Eng. Asp. 396,
(1993) Dewatering of crude oil emulsions 2. Interfacial 208–212. https://doi.org/10.1016/j.colsurfa.2011.12.076.G. Raynel et al.: Oil & Gas Science and Technology – Rev. IFP Energies nouvelles 76, 19 (2021) 11 24 Salam K.K., Alade A.O., Arinkoola A.O., Opawale A. (2013) autocatalytic growth: Explicit formulas for the lag and Improving the demulsification process of heavy crude oil growth times plus other key insights, J. Phys. Chem. C 121, emulsion through blending with diluent, J. Pet. Eng. 2013, 9, 5302–5312. https://doi.org/10.1021/acs.jpcc.6b12021. 1–6. https://doi.org/10.1155/2013/793101. 29 Uversky V.N., Li J., Fink A.L. (2001) Evidence for a 25 Rondon M., Pereira J.C., Bouriat P., Graciaa A., Lachaise J., partially folded intermediate in a-synuclein fibril formation, Salager J.-L. (2008) Breaking of water-in-crude-oil emul- J. Biol. Chem. 276, 14, 10737–10744. https://doi.org/ sions. 2. Influence of asphaltene concentration and diluent 10.1074/jbc.M010907200. nature on demulsifier action, Energy Fuels 22, 702–707. 30 Nguyen D., Sadeghi N., Houston C. (2012) Chemical https://doi.org/10.1021/ef7003877. interactions and demulsifier characteristics for enhanced oil 26 Feldmann R., Lochner K.H. (2015) Influences on volume in recovery applications, Energy Fuels 26, 5, 2742–2750. piston-operated air-displacement pipettes, Accred. Qual. Assur. https://doi.org/10.1021/ef201800b. 21, 1, 69–82. https://doi.org/10.1007/s00769-015-1171-y. 31 Al-Sabagh A.M., Kandile N.G., Noor El-Din M.R. (2011) 27 Lochner K.H., Ballweg T., Fahrenkrog H.-H. (1996) Unter- Functions of demulsifiers in the petroleum industry, Sep. Sci. suchungen zur Meßgenauigkeit von Kolbenhubpipetten mit Technol. 46, 7, 1144–1163. https://doi.org/10.1080/01496395. Luftpolster [Factors influencing the measuring accuracy of 2010.550595. piston pipettes with air interface], J. Lab. Med. 20, 7/8, 32 Mohammed R.A., Bailey A.I., Luckham P.F., Taylor S.E. 430–440. https://doi.org/10.1515/labm.1996.20.7-8.430. (1993) Dewatering of crude oil emulsions 1. Rheological 28 Bentea L., Watzky M.A., Finke R.G. (2017) Sigmoidal behaviour of the crude oil—water interface, Colloids Surf. A nucleation and growth curves across nature fit by the Physicochem. Eng. Asp. 80, 2–3, 223–235. https://doi.org/ Finke-Watzky model of slow continuous nucleation and 10.1016/0927-7757(93)80202-P.
You can also read